| Param | Original file | Final file |
|---|---|---|
| Filename | modeM0/AS1G06_083T01_9000000984_07205cztM0_level2.evt | modeM0/AS1G06_083T01_9000000984_07205cztM0_level2_quad_clean.evt |
| Size (bytes) | 465,972,480 | 108,504,000 |
| Size | 444.4 MB | 103.5 MB |
| Events in quadrant A | 3,100,037 | 732,284 |
| Events in quadrant B | 3,276,176 | 737,381 |
| Events in quadrant C | 2,878,141 | 708,488 |
| Events in quadrant D | 4,425,615 | 664,279 |
| Mode M9 | |||
|---|---|---|---|
| Quadrant | BADHDUFLAG | Total packets | Discarded packets |
| A | 0 | 12 | 0 |
| B | 0 | 12 | 0 |
| C | 0 | 12 | 0 |
| D | 0 | 12 | 0 |
| Mode SS | |||
|---|---|---|---|
| Quadrant | BADHDUFLAG | Total packets | Discarded packets |
| A | 0 | 128 | 0 |
| B | 0 | 128 | 0 |
| C | 0 | 128 | 0 |
| D | 0 | 128 | 0 |
| Mode M0 | |||
|---|---|---|---|
| Quadrant | BADHDUFLAG | Total packets | Discarded packets |
| A | 0 | 13704 | 2 |
| B | 0 | 13985 | 1 |
| C | 0 | 13005 | 1 |
| D | 0 | 17205 | 1 |
| Quadrant | Total seconds | Saturated seconds | Saturation percentage |
|---|---|---|---|
| A | 6362 | 48 | 0.754480% |
| B | 6362 | 65 | 1.021691% |
| C | 6362 | 26 | 0.408677% |
| D | 6362 | 318 | 4.998428% |
Noise dominated data is calculated using 1-second bins in cleaned event files. If a bin has >2000 counts, and if more than 50% of those come from <1% of pixels, then it is considered to be noise-dominated and hence unusable.
| Quadrant | # 1 sec bins | Bins with >0 counts | Bins with >2000 counts | High rate bins dominated by noise | Noise dominated (total time) | Noise dominated (detector-on time) | Marked lightcurve |
|---|---|---|---|---|---|---|---|
| A | 7507 | 6362 | 3 | 3 | 0.04% | 0.05% | 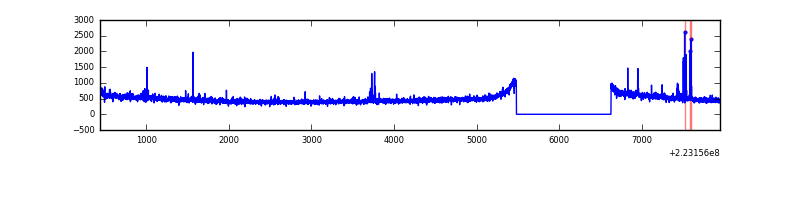 |
| B | 7507 | 6362 | 1 | 1 | 0.01% | 0.02% | 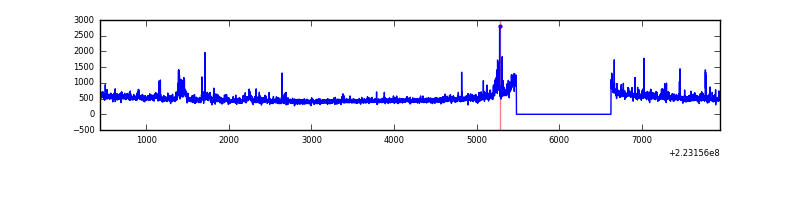 |
| C | 7507 | 6362 | 0 | 0 | 0.00% | 0.00% | 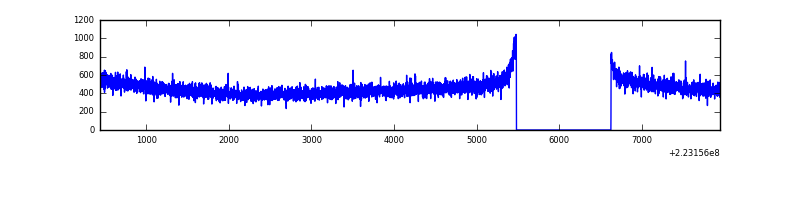 |
| D | 7507 | 6362 | 215 | 215 | 2.86% | 3.38% | 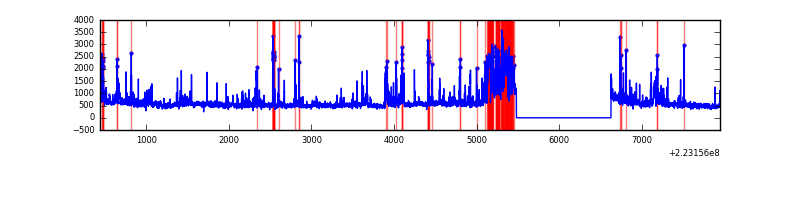 |
Top three noisy pixels from each quadrant. If the there are fewer than three noisy pixels in the level2.evt file, extra rows are filled as -1
| Pixel properties | Quadrant properties | ||||||
|---|---|---|---|---|---|---|---|
| Quadrant | DetID | PixID | Counts | Sigma | Mean | Median | Sigma |
| A | 13 | 248 | 42195 | 268.7 | 768 | 754 | 154.2 |
| A | 14 | 14 | 39115 | 248.73 | 768 | 754 | 154.2 |
| A | 14 | 31 | 20555 | 128.39 | 768 | 754 | 154.2 |
| B | 0 | 219 | 114601 | 780.7 | 773 | 757 | 145.8 |
| B | 0 | 214 | 83080 | 564.54 | 773 | 757 | 145.8 |
| B | 4 | 81 | 28654 | 191.31 | 773 | 757 | 145.8 |
| C | 13 | 61 | 5674 | 28.99 | 737 | 740 | 170.2 |
| C | 8 | 222 | 2298 | 9.15 | 737 | 740 | 170.2 |
| C | 1 | 0 | 2149 | 8.28 | 737 | 740 | 170.2 |
| D | 2 | 216 | 754020 | 4282.27 | 717 | 696 | 175.9 |
| D | 8 | 195 | 620805 | 3525.01 | 717 | 696 | 175.9 |
| D | 14 | 34 | 152392 | 862.32 | 717 | 696 | 175.9 |
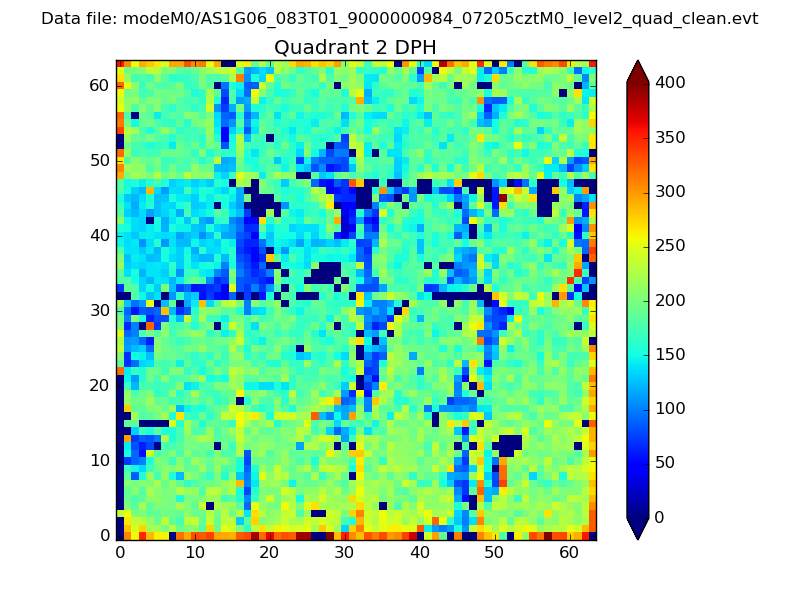
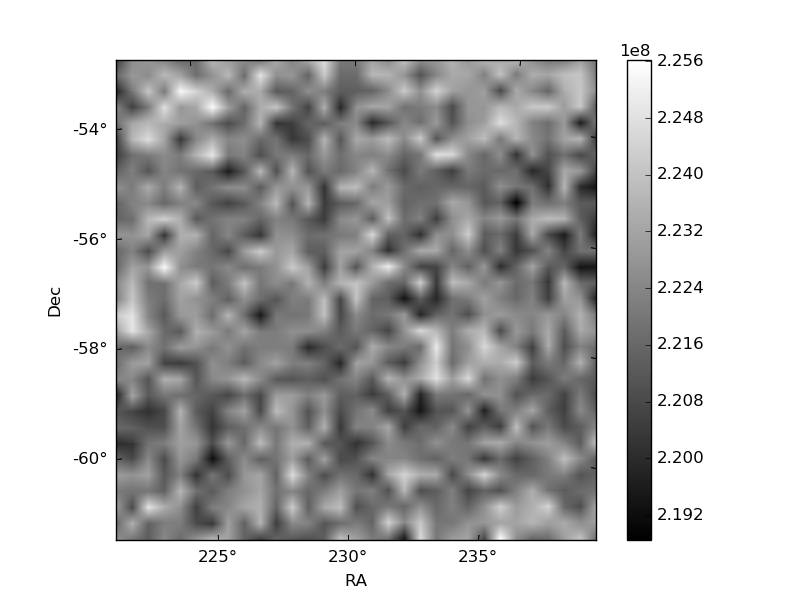
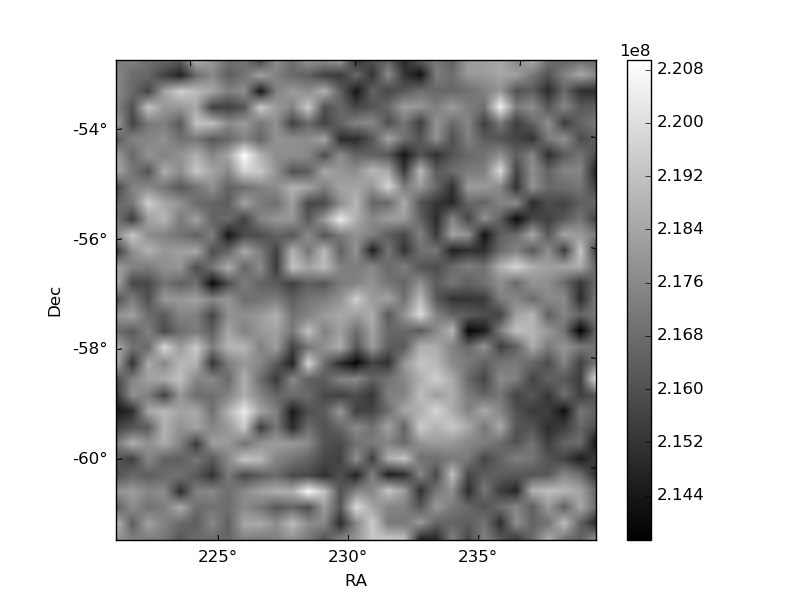
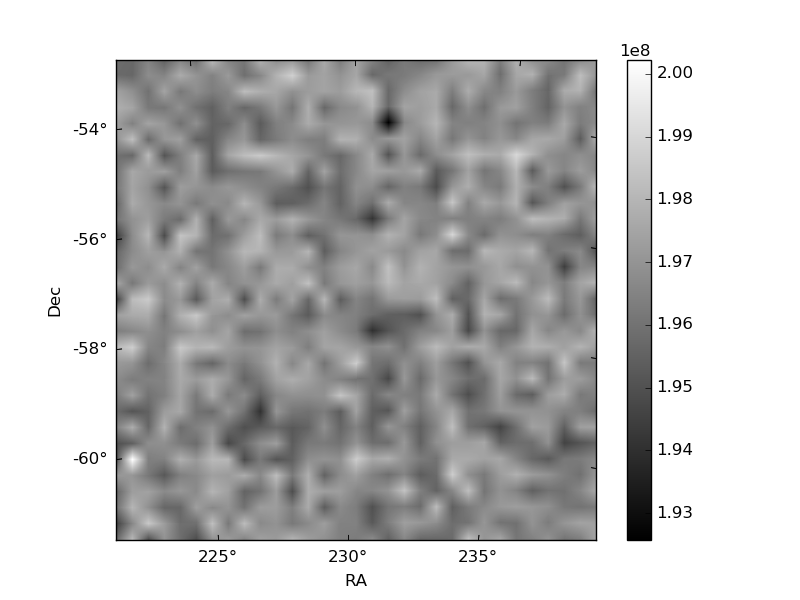
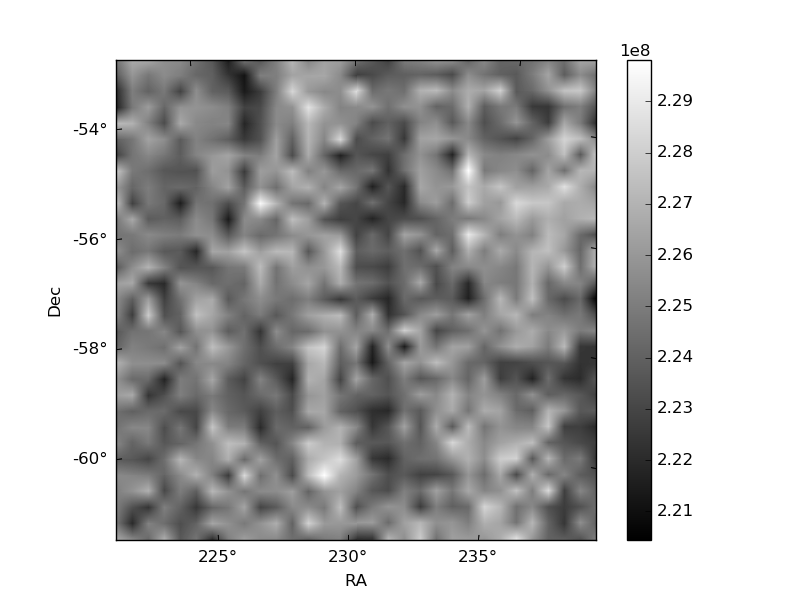
Histogram calculated using DETX and DETY for each event in the final _common_clean file
| Quadrant A | 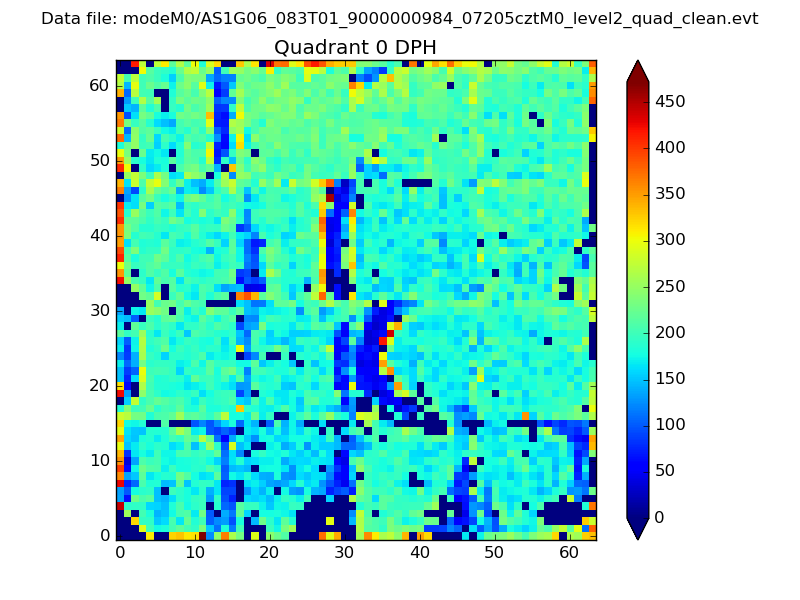 |
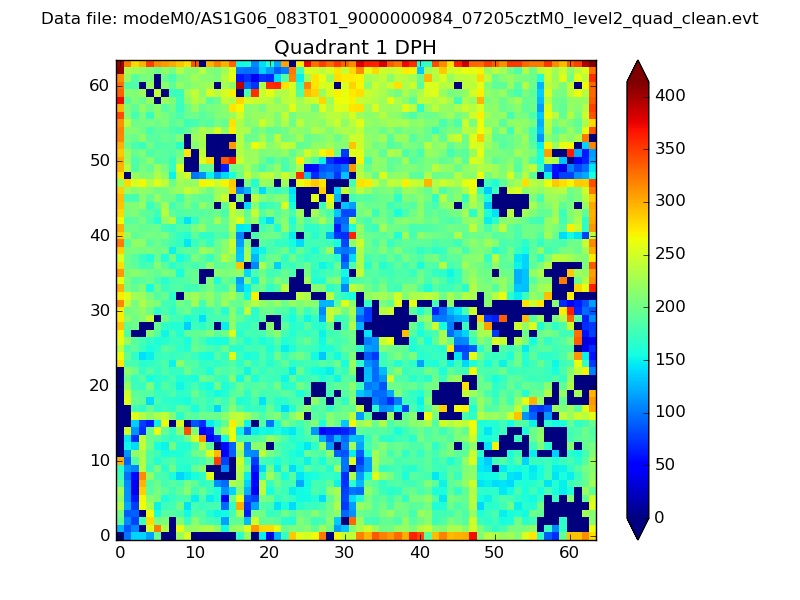 |
Quadrant B |
|---|---|---|---|
| Quadrant D | 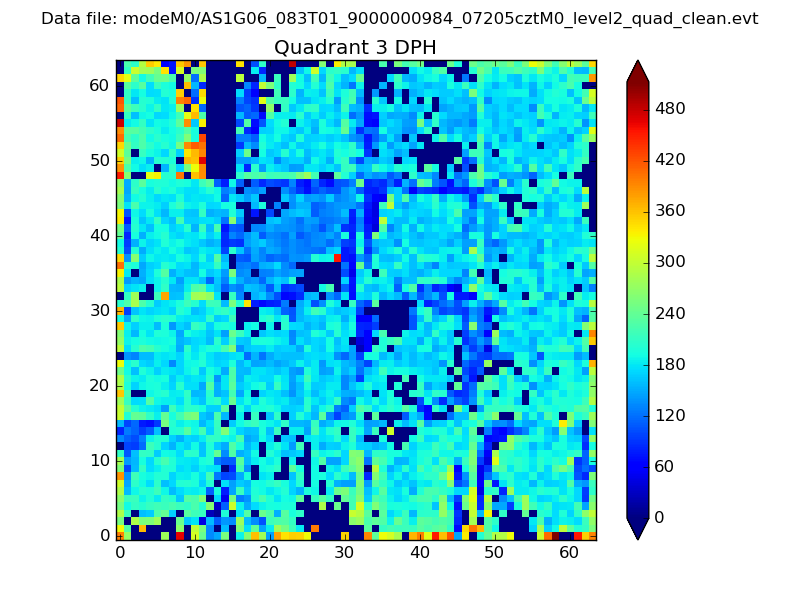 |
 |
Quadrant C |
| Plot type | Count rate plots | Images |
|---|---|---|
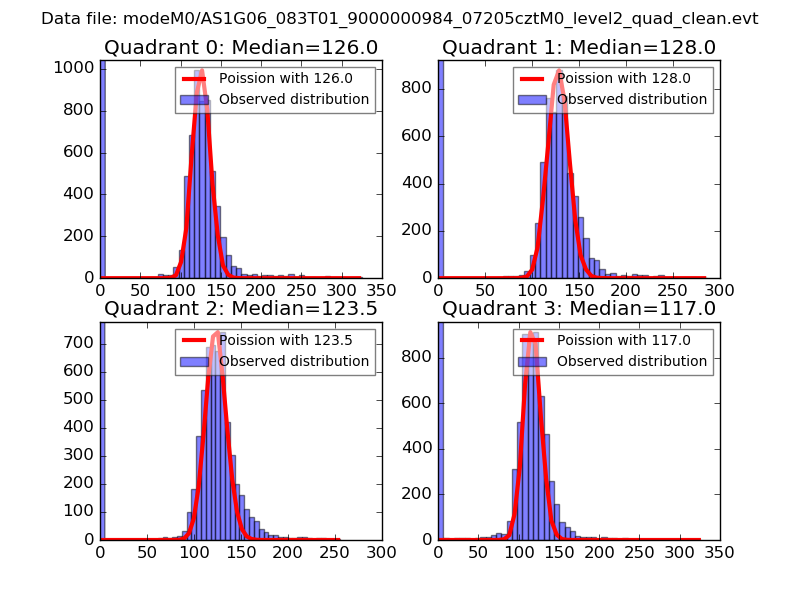
| Comparison with Poisson distribution Blue bars denote a histogram of data divided into 1 sec bins. Red curve is a Poisson curve with rate = median count rate of data. |
 |
 |
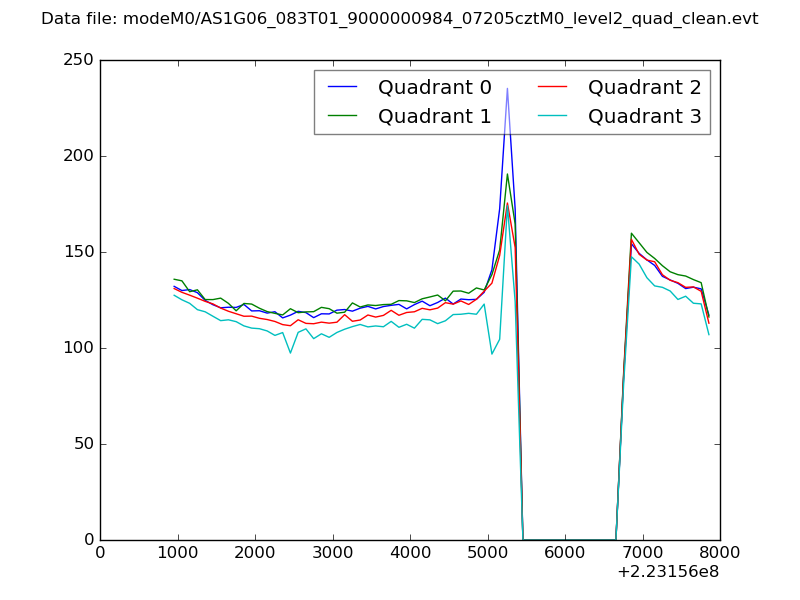
| Quadrant-wise count rates Data is divided into 100 sec bins |
 |
|
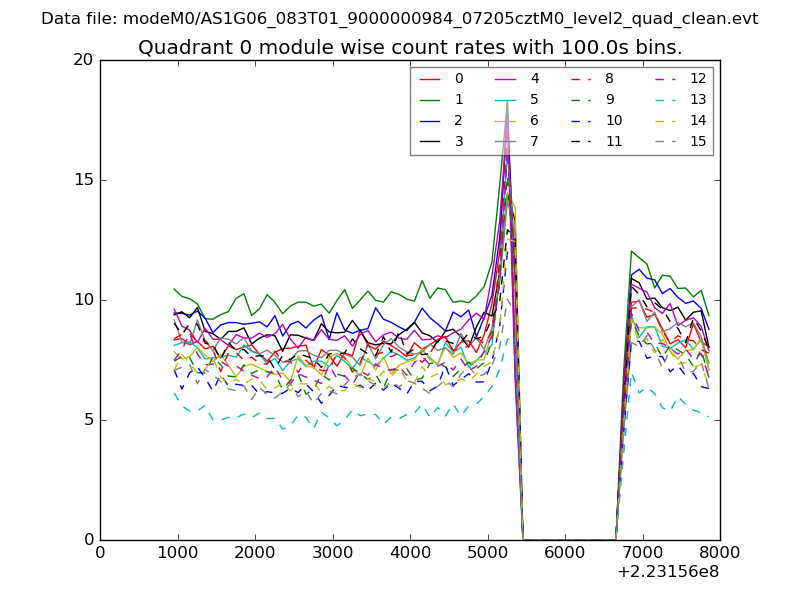
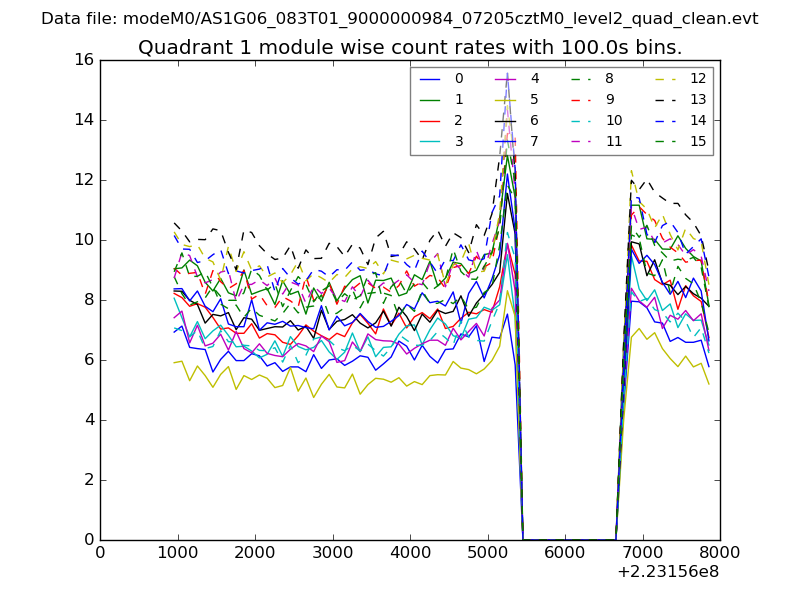
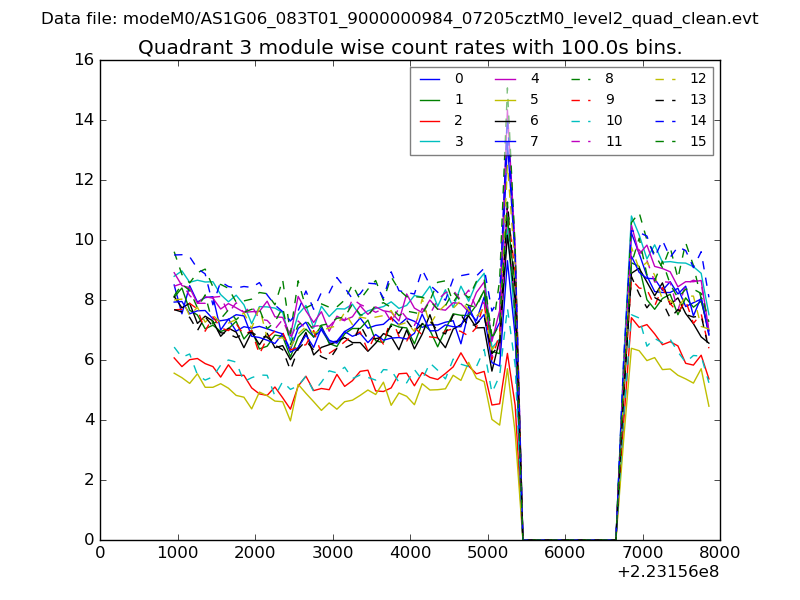
| Module-wise count rates for Quadrant A Data is divided into 100 sec bins |
 |
 |
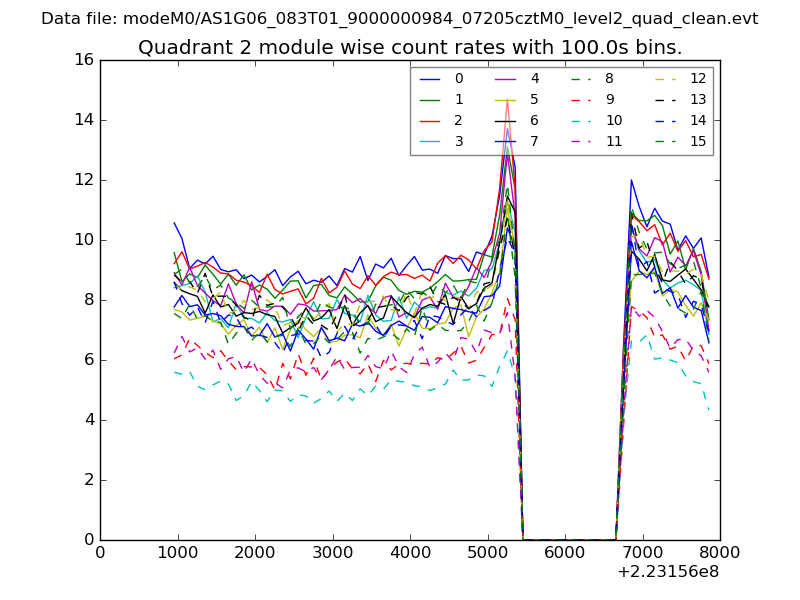
| Module-wise count rates for Quadrant B Data is divided into 100 sec bins |
 |
 |
| Module-wise count rates for Quadrant C Data is divided into 100 sec bins |
 |
 |
| Module-wise count rates for Quadrant D Data is divided into 100 sec bins |
 |
 |
| Parameter | Plot |
|---|---|
| CZT HV Monitor | 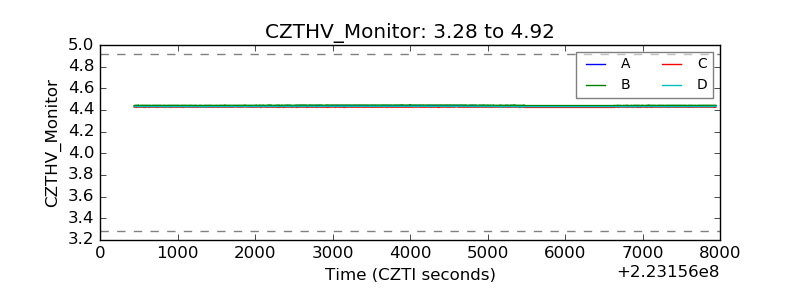 |
| D_VDD | 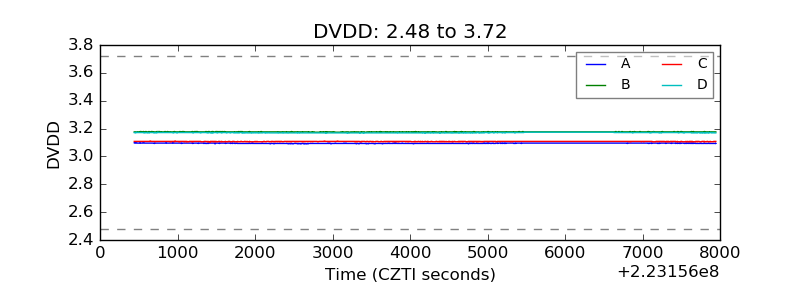 |
| Temperature 1 | 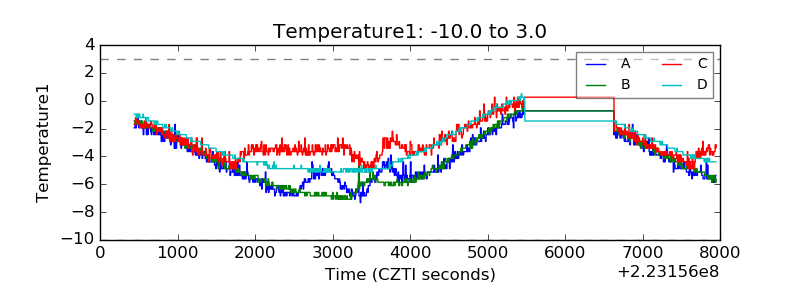 |
| Veto HV Monitor | 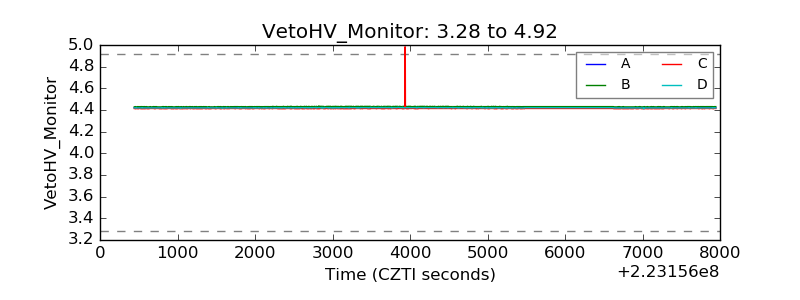 |
| Veto LLD | 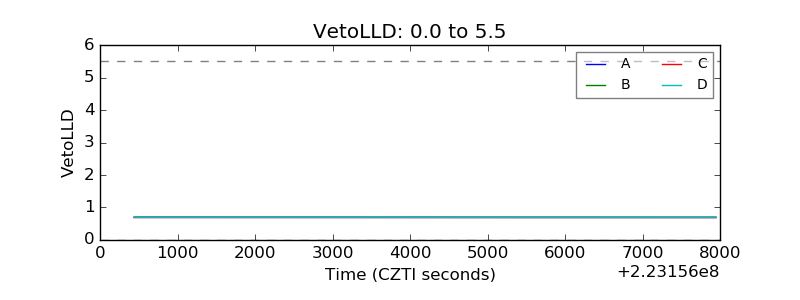 |
| Alpha Counter | 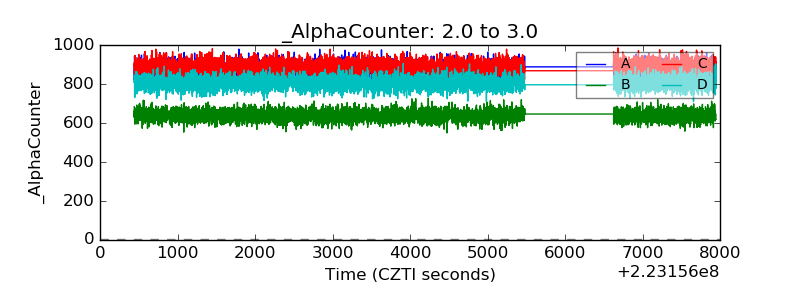 |
| _CPM_Rate | 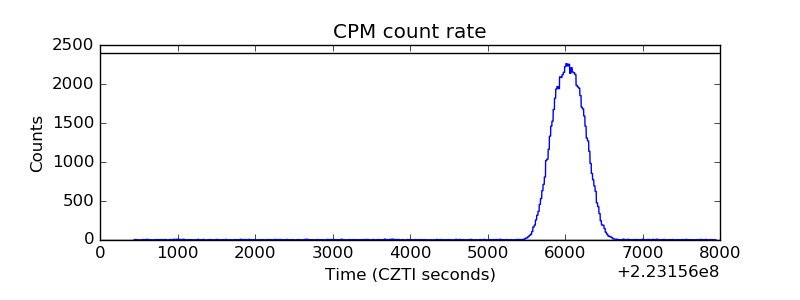 |
| CZT Counter | 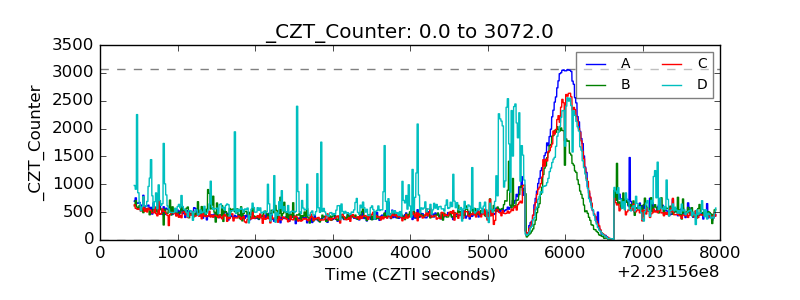 |
| +2.5 Volts monitor |  |
| +5 Volts monitor |  |
| _ROLL_ROT | 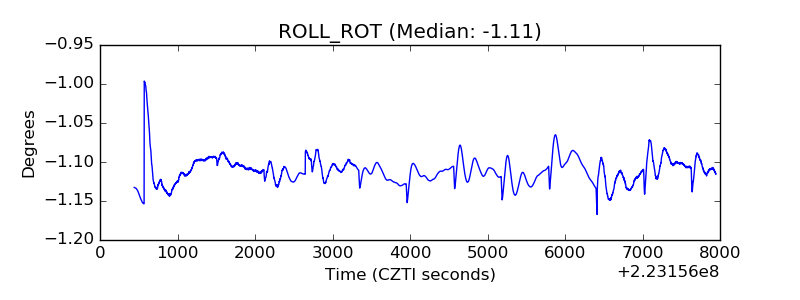 |
| _Roll_DEC | 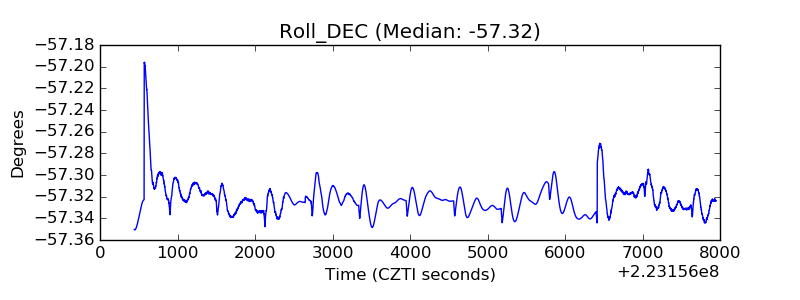 |
| _Roll_RA | 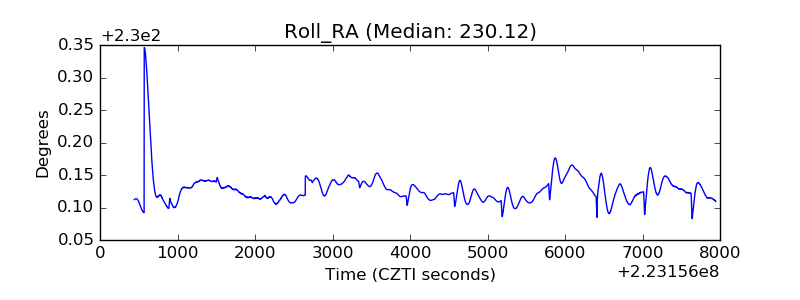 |
| Veto Counter | 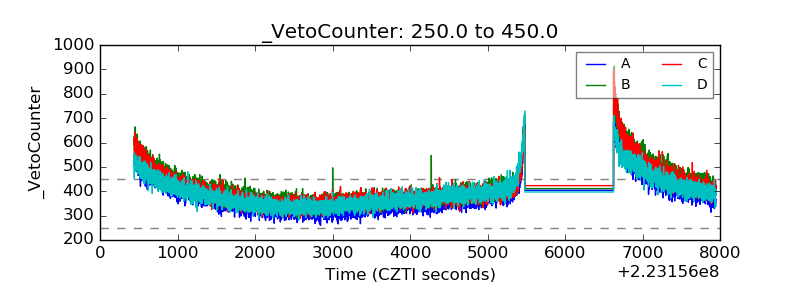 |