| Param | Original file | Final file |
|---|---|---|
| Filename | modeM0/AS1G06_083T01_9000000984_07207cztM0_level2.evt | modeM0/AS1G06_083T01_9000000984_07207cztM0_level2_quad_clean.evt |
| Size (bytes) | 442,794,240 | 114,252,480 |
| Size | 422.3 MB | 109.0 MB |
| Events in quadrant A | 2,989,883 | 761,689 |
| Events in quadrant B | 3,328,602 | 788,758 |
| Events in quadrant C | 3,087,304 | 760,628 |
| Events in quadrant D | 3,579,601 | 713,359 |
| Mode M9 | |||
|---|---|---|---|
| Quadrant | BADHDUFLAG | Total packets | Discarded packets |
| A | 0 | 15 | 0 |
| B | 0 | 15 | 0 |
| C | 0 | 15 | 0 |
| D | 0 | 16 | 0 |
| Mode SS | |||
|---|---|---|---|
| Quadrant | BADHDUFLAG | Total packets | Discarded packets |
| A | 0 | 126 | 0 |
| B | 0 | 126 | 0 |
| C | 0 | 126 | 0 |
| D | 0 | 126 | 0 |
| Mode M0 | |||
|---|---|---|---|
| Quadrant | BADHDUFLAG | Total packets | Discarded packets |
| A | 0 | 13073 | 3 |
| B | 0 | 14021 | 2 |
| C | 0 | 13244 | 2 |
| D | 0 | 14897 | 2 |
| Quadrant | Total seconds | Saturated seconds | Saturation percentage |
|---|---|---|---|
| A | 6252 | 22 | 0.351887% |
| B | 6252 | 56 | 0.895713% |
| C | 6252 | 50 | 0.799744% |
| D | 6252 | 114 | 1.823417% |
Noise dominated data is calculated using 1-second bins in cleaned event files. If a bin has >2000 counts, and if more than 50% of those come from <1% of pixels, then it is considered to be noise-dominated and hence unusable.
| Quadrant | # 1 sec bins | Bins with >0 counts | Bins with >2000 counts | High rate bins dominated by noise | Noise dominated (total time) | Noise dominated (detector-on time) | Marked lightcurve |
|---|---|---|---|---|---|---|---|
| A | 7587 | 6253 | 2 | 2 | 0.03% | 0.03% | 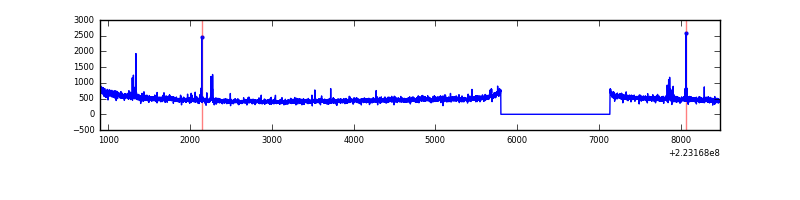 |
| B | 7587 | 6253 | 11 | 11 | 0.14% | 0.18% | 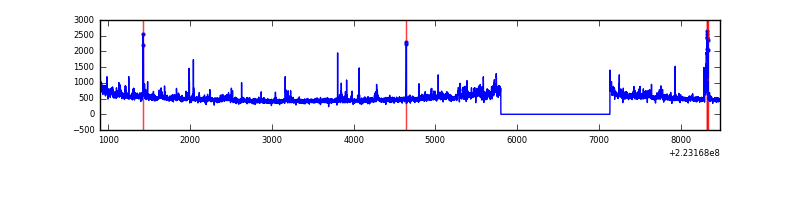 |
| C | 7587 | 6253 | 42 | 42 | 0.55% | 0.67% | 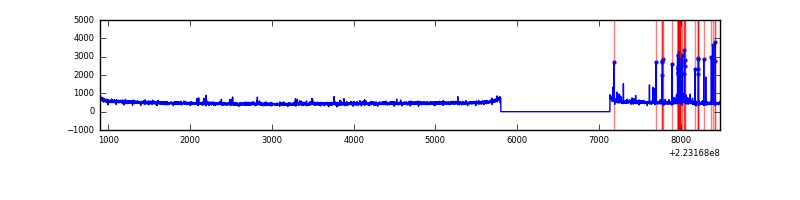 |
| D | 7587 | 6253 | 83 | 83 | 1.09% | 1.33% | 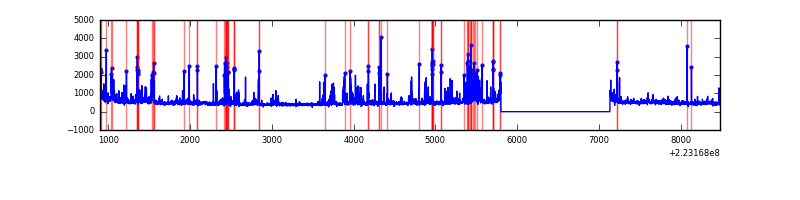 |
Top three noisy pixels from each quadrant. If the there are fewer than three noisy pixels in the level2.evt file, extra rows are filled as -1
| Pixel properties | Quadrant properties | ||||||
|---|---|---|---|---|---|---|---|
| Quadrant | DetID | PixID | Counts | Sigma | Mean | Median | Sigma |
| A | 13 | 248 | 39141 | 250.6 | 757 | 744 | 153.2 |
| A | 14 | 14 | 18474 | 115.71 | 757 | 744 | 153.2 |
| A | 14 | 31 | 8816 | 52.68 | 757 | 744 | 153.2 |
| B | 0 | 214 | 87894 | 609.95 | 775 | 759 | 142.9 |
| B | 0 | 219 | 73883 | 511.88 | 775 | 759 | 142.9 |
| B | 0 | 228 | 73654 | 510.27 | 775 | 759 | 142.9 |
| C | 9 | 68 | 103143 | 600.34 | 747 | 752 | 170.6 |
| C | 9 | 243 | 63929 | 370.42 | 747 | 752 | 170.6 |
| C | 13 | 61 | 5746 | 29.28 | 747 | 752 | 170.6 |
| D | 2 | 216 | 467999 | 2624.05 | 732 | 710 | 178.1 |
| D | 14 | 34 | 157749 | 881.85 | 732 | 710 | 178.1 |
| D | 8 | 195 | 96004 | 535.12 | 732 | 710 | 178.1 |
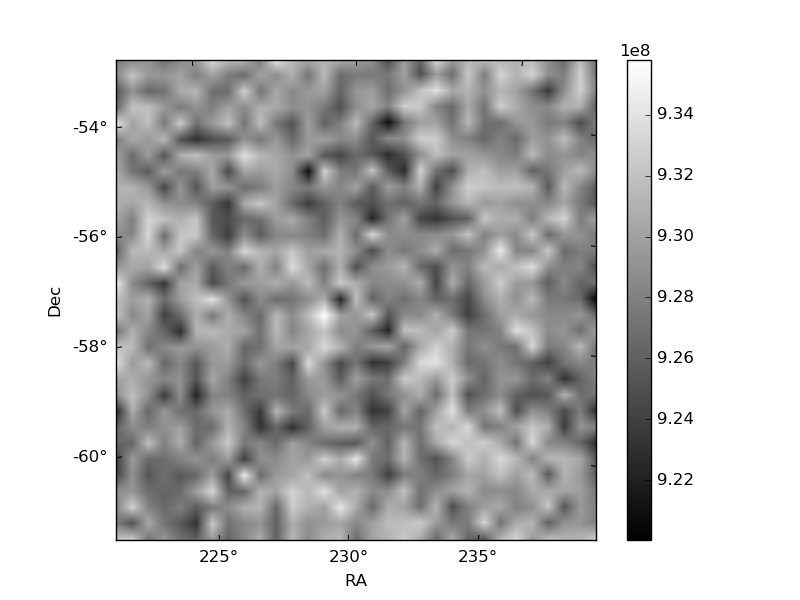
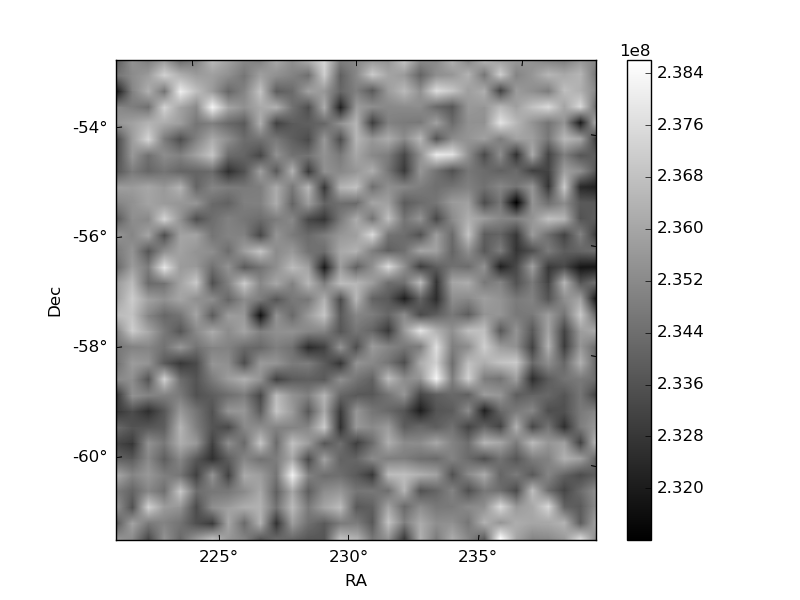
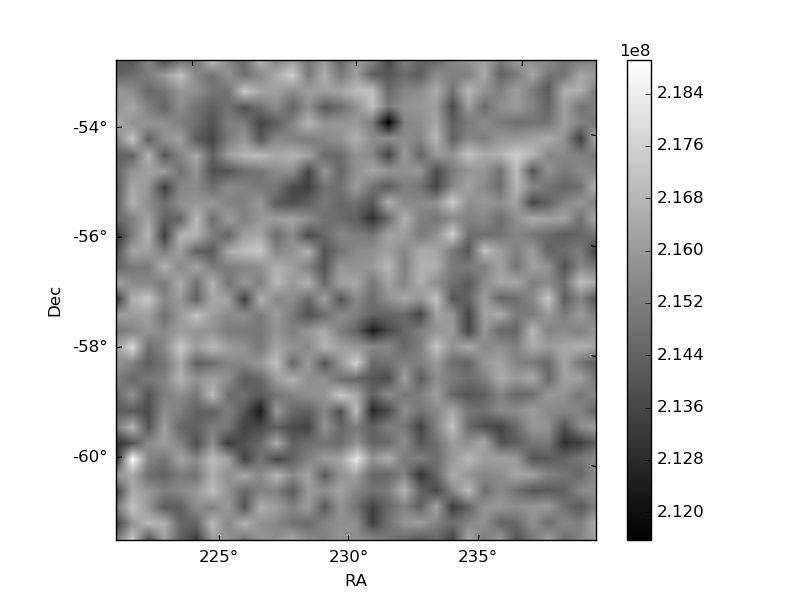
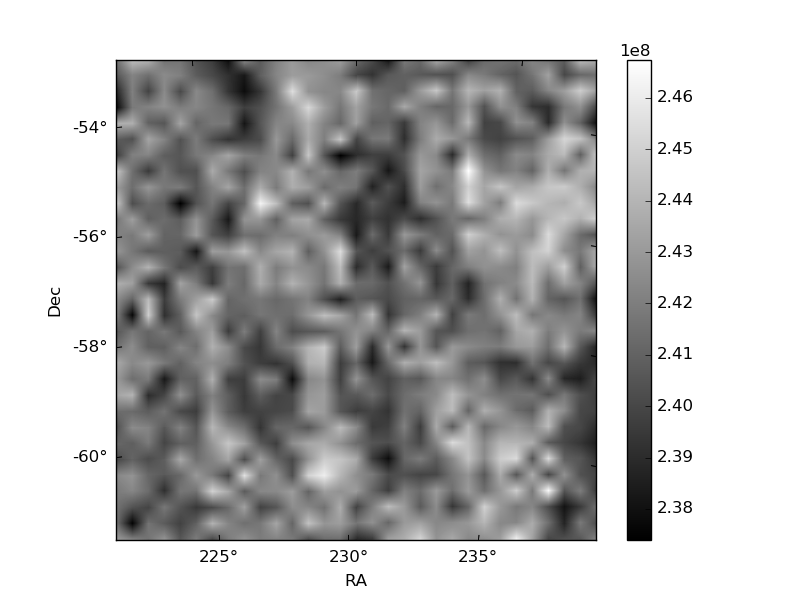
Histogram calculated using DETX and DETY for each event in the final _common_clean file
| Quadrant A | 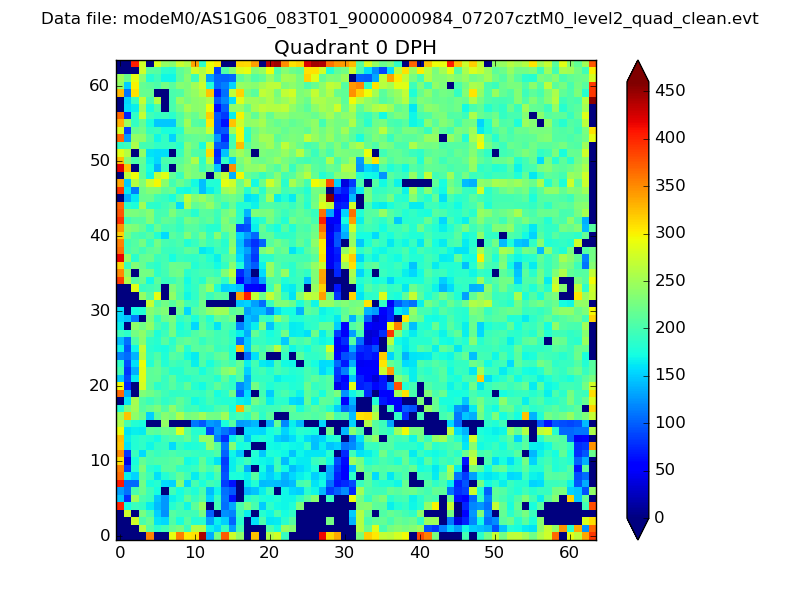 |
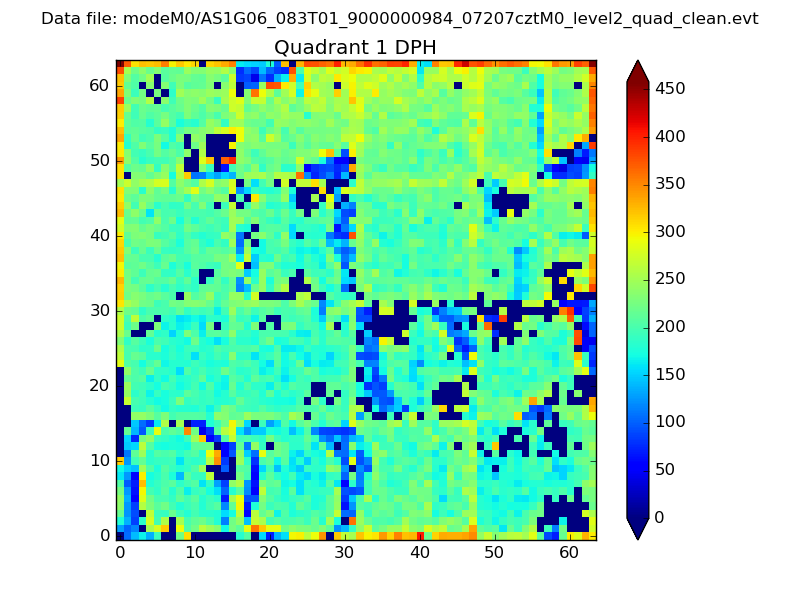 |
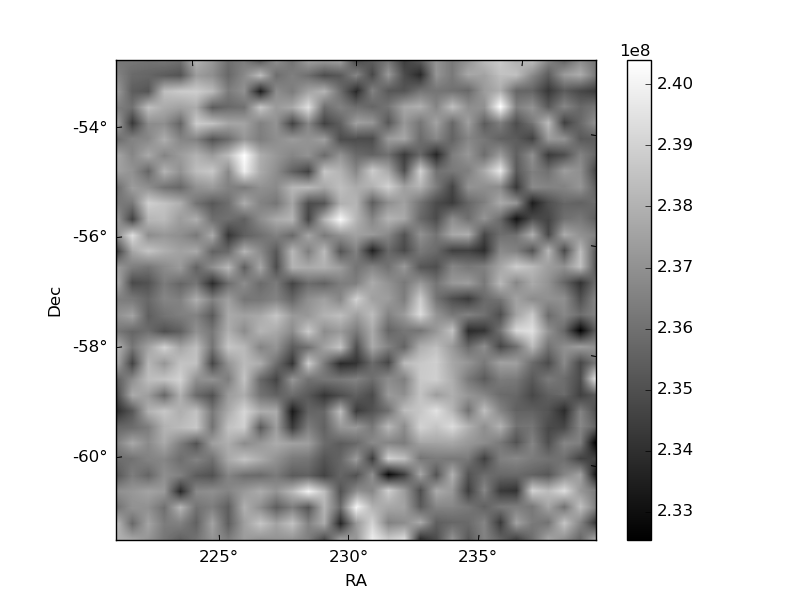
Quadrant B |
|---|---|---|---|
| Quadrant D | 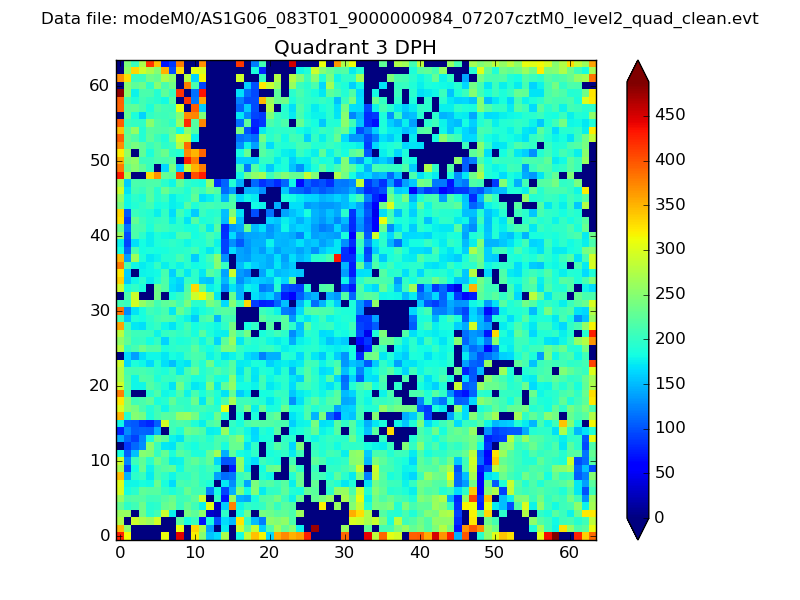 |
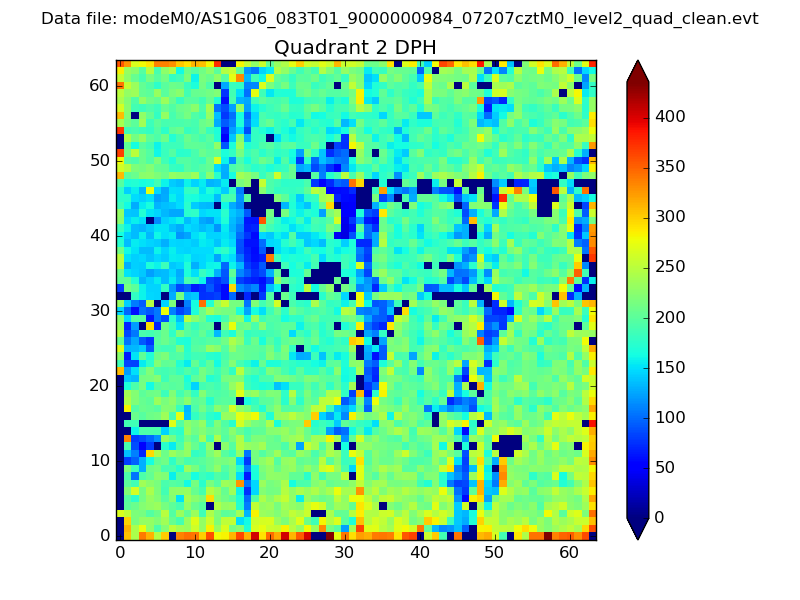 |
Quadrant C |
| Plot type | Count rate plots | Images |
|---|---|---|
| Comparison with Poisson distribution Blue bars denote a histogram of data divided into 1 sec bins. Red curve is a Poisson curve with rate = median count rate of data. |
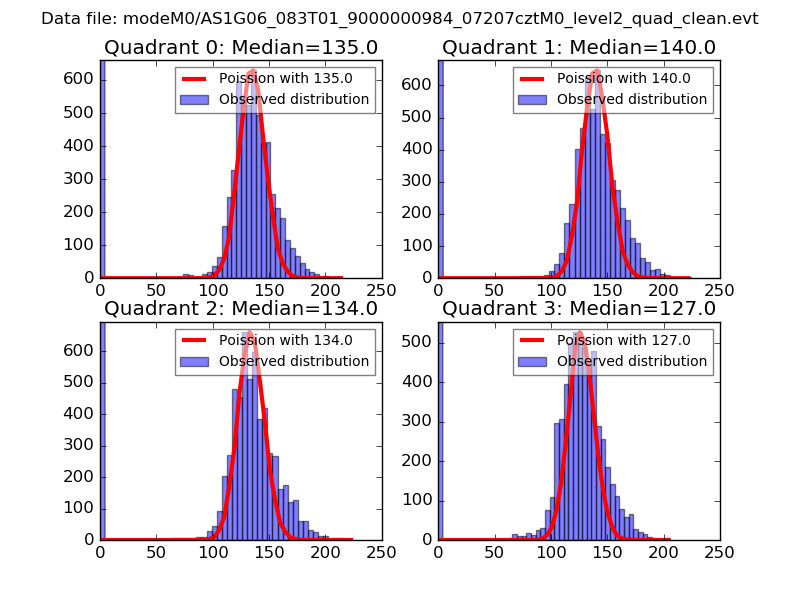 |
 |
| Quadrant-wise count rates Data is divided into 100 sec bins |
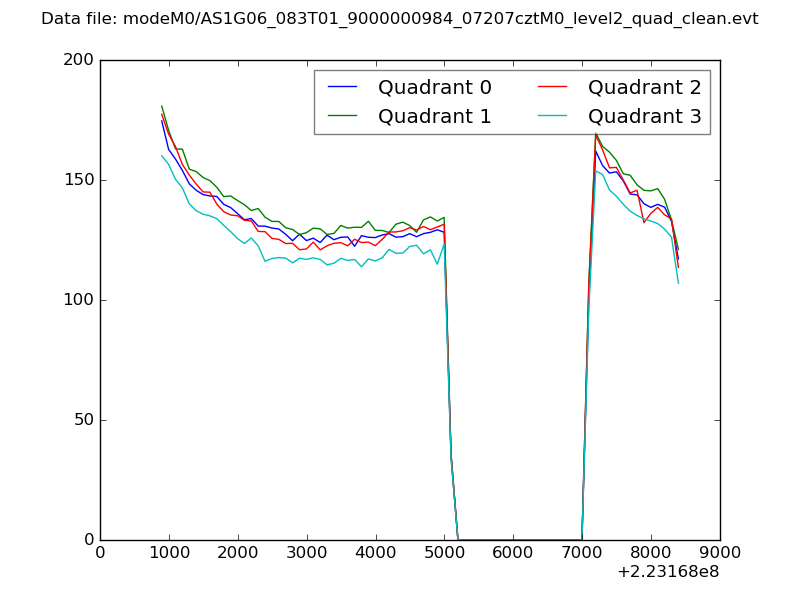 |
|
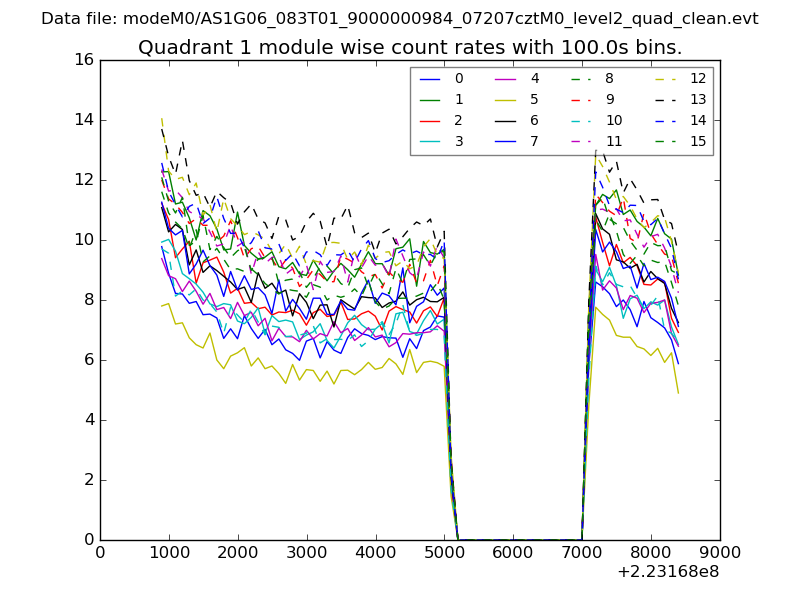
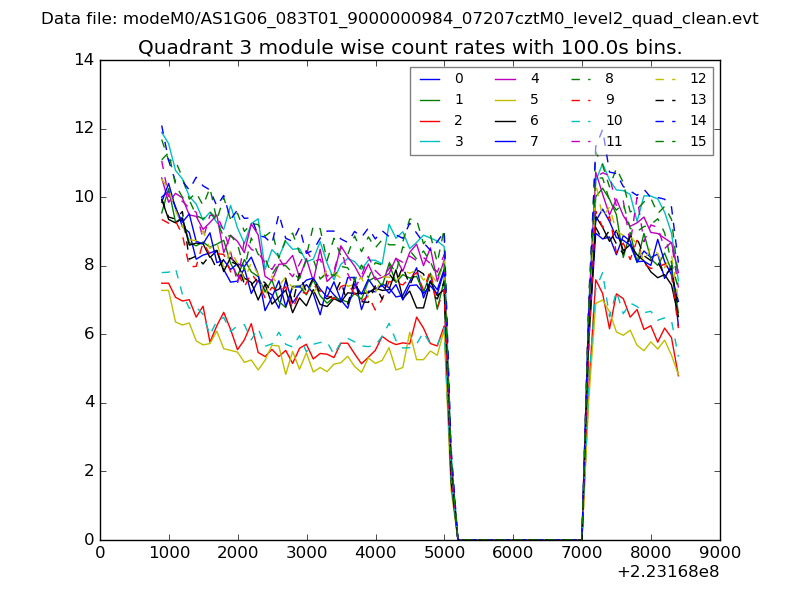
| Module-wise count rates for Quadrant A Data is divided into 100 sec bins |
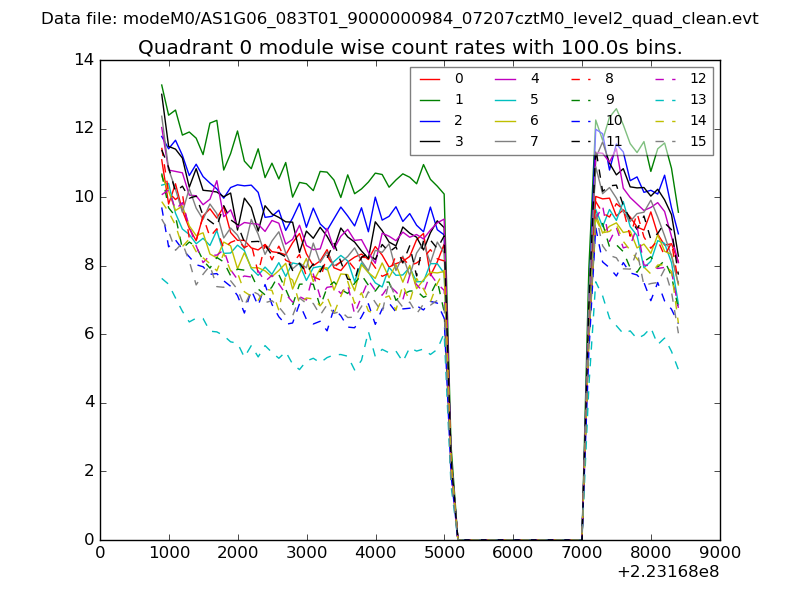 |
 |
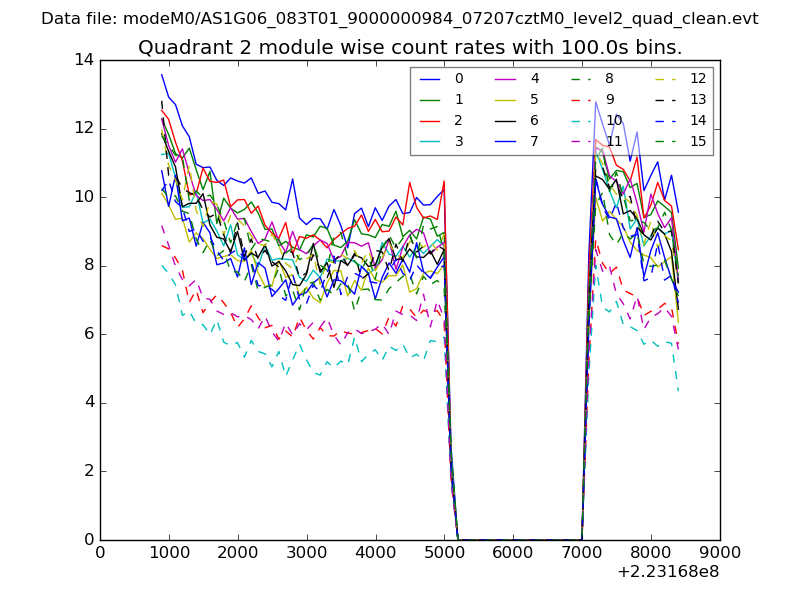
| Module-wise count rates for Quadrant B Data is divided into 100 sec bins |
 |
 |
| Module-wise count rates for Quadrant C Data is divided into 100 sec bins |
 |
 |
| Module-wise count rates for Quadrant D Data is divided into 100 sec bins |
 |
 |
| Parameter | Plot |
|---|---|
| CZT HV Monitor | 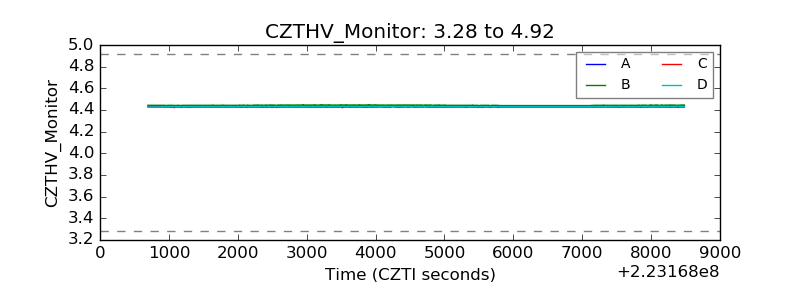 |
| D_VDD | 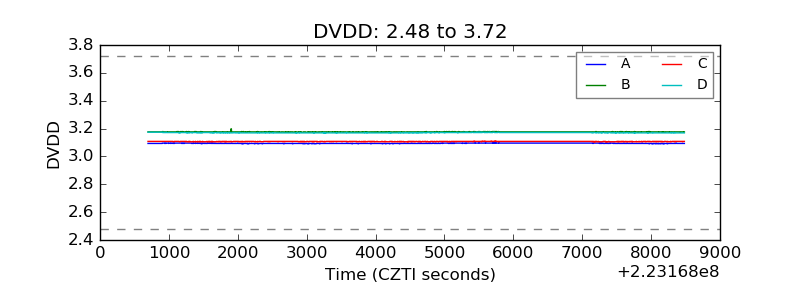 |
| Temperature 1 | 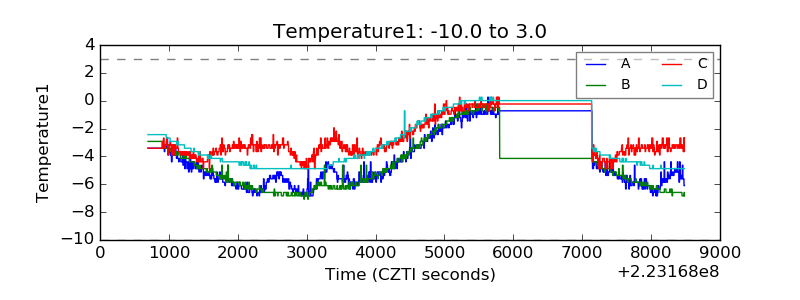 |
| Veto HV Monitor | 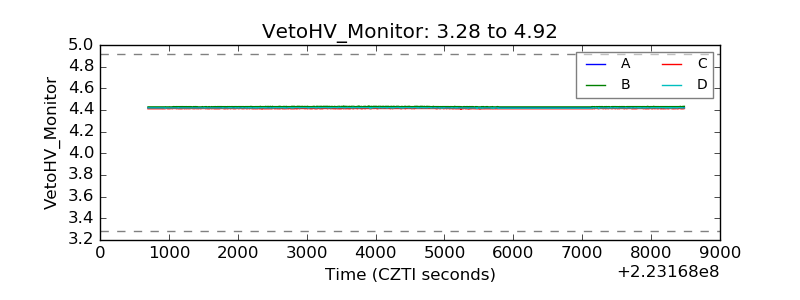 |
| Veto LLD | 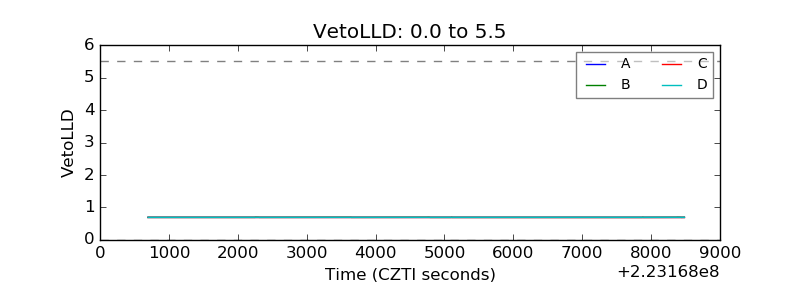 |
| Alpha Counter | 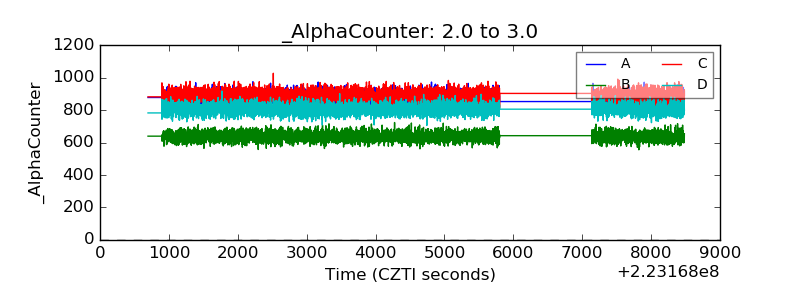 |
| _CPM_Rate | 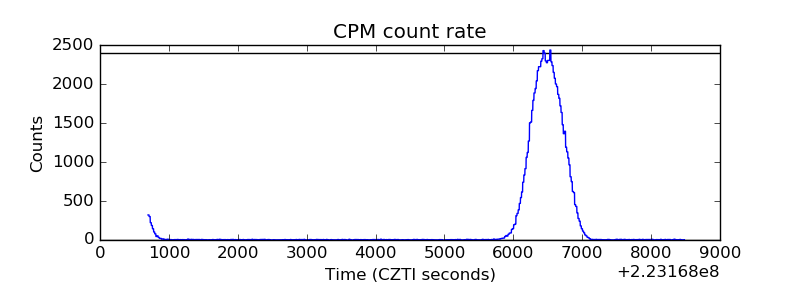 |
| CZT Counter | 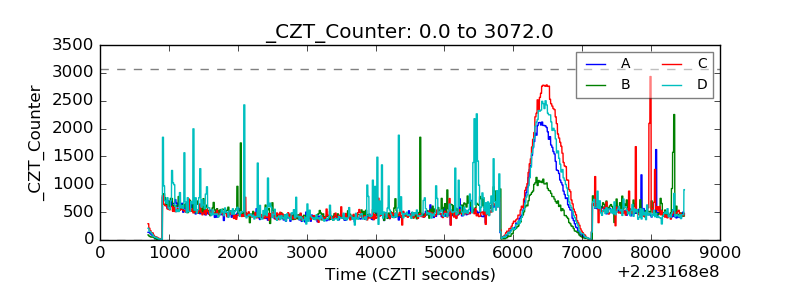 |
| +2.5 Volts monitor |  |
| +5 Volts monitor |  |
| _ROLL_ROT | 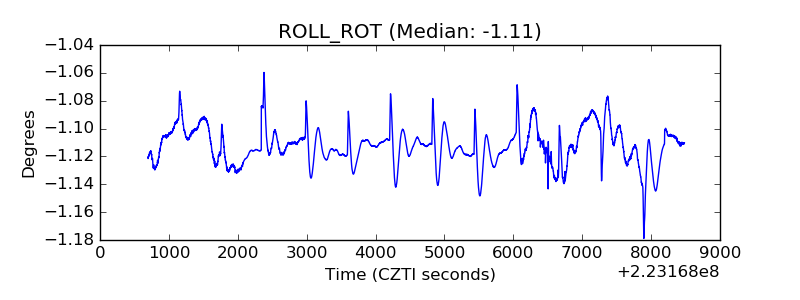 |
| _Roll_DEC | 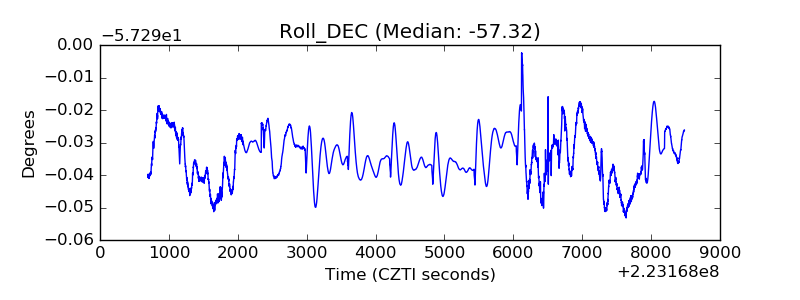 |
| _Roll_RA | 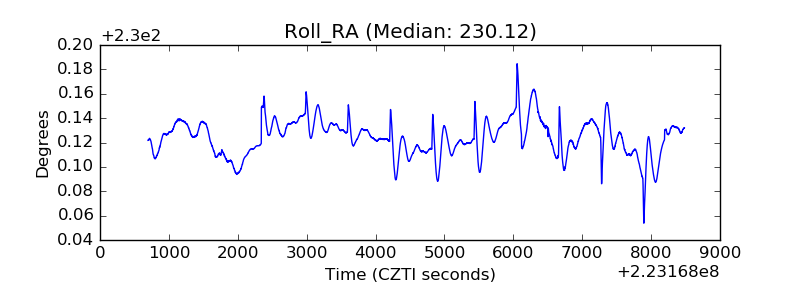 |
| Veto Counter | 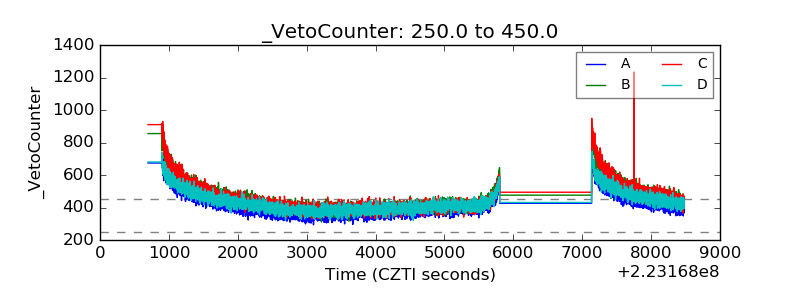 |