| Param | Original file | Final file |
|---|---|---|
| Filename | modeM0/AS1G06_083T01_9000000984_07208cztM0_level2.evt | modeM0/AS1G06_083T01_9000000984_07208cztM0_level2_quad_clean.evt |
| Size (bytes) | 472,176,000 | 111,303,360 |
| Size | 450.3 MB | 106.1 MB |
| Events in quadrant A | 3,045,141 | 732,368 |
| Events in quadrant B | 3,470,624 | 759,965 |
| Events in quadrant C | 3,421,390 | 735,063 |
| Events in quadrant D | 3,922,278 | 691,447 |
| Mode M9 | |||
|---|---|---|---|
| Quadrant | BADHDUFLAG | Total packets | Discarded packets |
| A | 0 | 20 | 0 |
| B | 0 | 20 | 0 |
| C | 0 | 20 | 0 |
| D | 0 | 21 | 0 |
| Mode SS | |||
|---|---|---|---|
| Quadrant | BADHDUFLAG | Total packets | Discarded packets |
| A | 0 | 132 | 0 |
| B | 0 | 132 | 0 |
| C | 0 | 132 | 0 |
| D | 0 | 132 | 0 |
| Mode M0 | |||
|---|---|---|---|
| Quadrant | BADHDUFLAG | Total packets | Discarded packets |
| A | 0 | 13341 | 3 |
| B | 0 | 14620 | 2 |
| C | 0 | 14408 | 2 |
| D | 0 | 16007 | 2 |
| Quadrant | Total seconds | Saturated seconds | Saturation percentage |
|---|---|---|---|
| A | 6484 | 22 | 0.339297% |
| B | 6484 | 70 | 1.079581% |
| C | 6484 | 105 | 1.619371% |
| D | 6484 | 159 | 2.452190% |
Noise dominated data is calculated using 1-second bins in cleaned event files. If a bin has >2000 counts, and if more than 50% of those come from <1% of pixels, then it is considered to be noise-dominated and hence unusable.
| Quadrant | # 1 sec bins | Bins with >0 counts | Bins with >2000 counts | High rate bins dominated by noise | Noise dominated (total time) | Noise dominated (detector-on time) | Marked lightcurve |
|---|---|---|---|---|---|---|---|
| A | 7814 | 6485 | 2 | 2 | 0.03% | 0.03% | 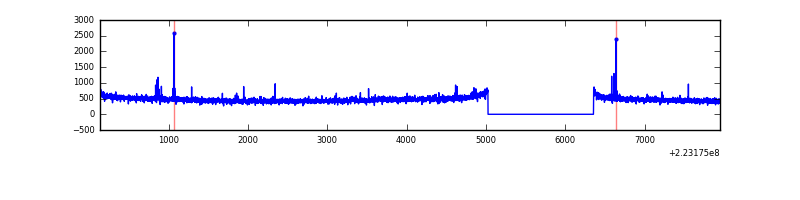 |
| B | 7814 | 6485 | 22 | 22 | 0.28% | 0.34% | 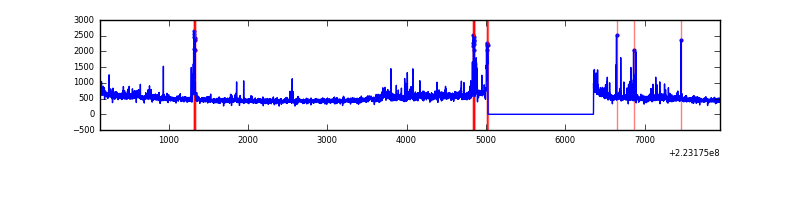 |
| C | 7814 | 6485 | 94 | 94 | 1.20% | 1.45% | 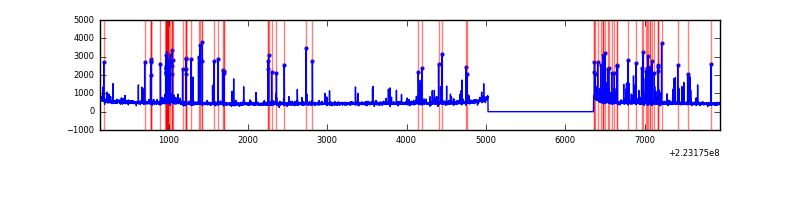 |
| D | 7814 | 6485 | 83 | 83 | 1.06% | 1.28% | 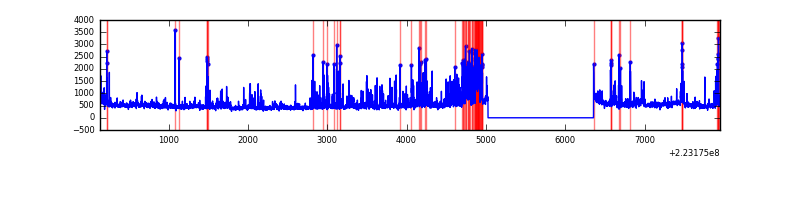 |
Top three noisy pixels from each quadrant. If the there are fewer than three noisy pixels in the level2.evt file, extra rows are filled as -1
| Pixel properties | Quadrant properties | ||||||
|---|---|---|---|---|---|---|---|
| Quadrant | DetID | PixID | Counts | Sigma | Mean | Median | Sigma |
| A | 13 | 248 | 25541 | 158.73 | 776 | 759 | 156.1 |
| A | 3 | 1 | 24194 | 150.1 | 776 | 759 | 156.1 |
| A | 0 | 226 | 7228 | 41.43 | 776 | 759 | 156.1 |
| B | 0 | 214 | 98207 | 667.15 | 792 | 774 | 146.0 |
| B | 4 | 173 | 86135 | 584.49 | 792 | 774 | 146.0 |
| B | 0 | 228 | 55106 | 372.03 | 792 | 774 | 146.0 |
| C | 9 | 243 | 301932 | 1709.63 | 772 | 776 | 176.2 |
| C | 9 | 68 | 97280 | 547.84 | 772 | 776 | 176.2 |
| C | 13 | 61 | 6021 | 29.78 | 772 | 776 | 176.2 |
| D | 2 | 216 | 668436 | 3640.24 | 757 | 736 | 183.4 |
| D | 8 | 195 | 221900 | 1205.77 | 757 | 736 | 183.4 |
| D | 14 | 34 | 77469 | 418.34 | 757 | 736 | 183.4 |
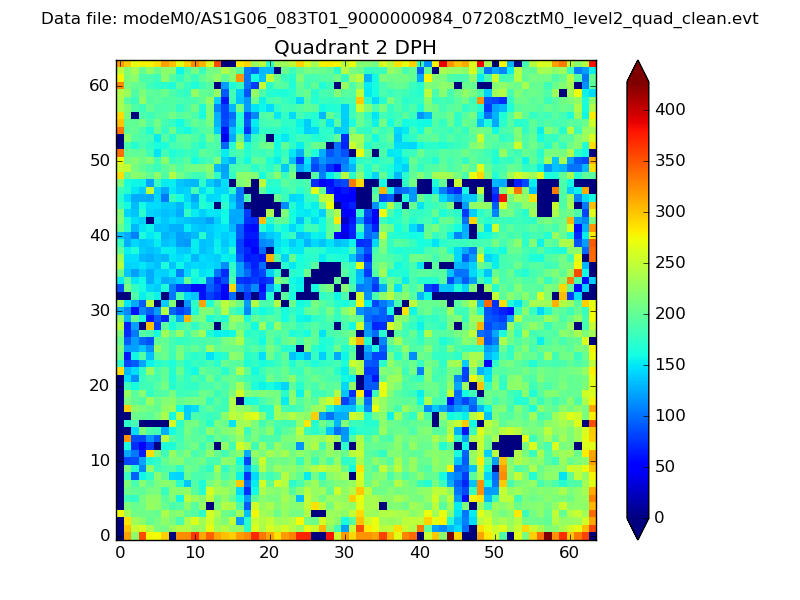
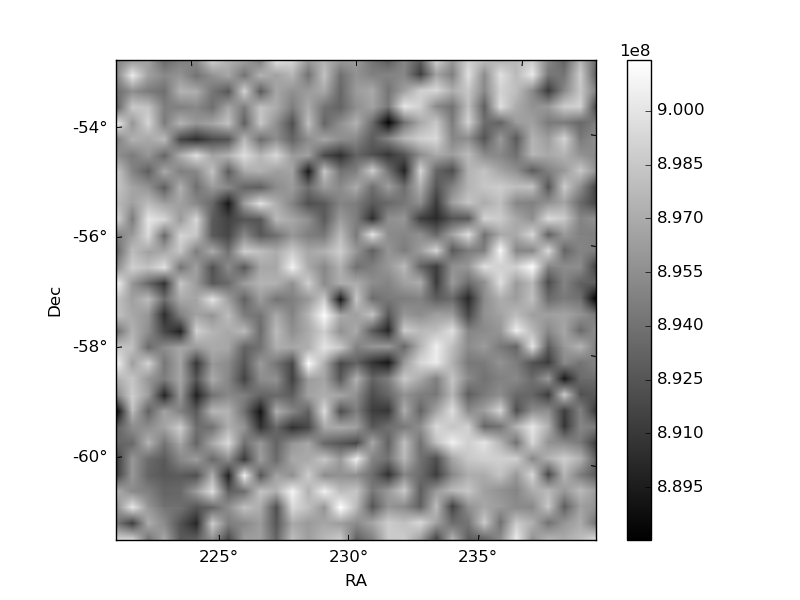
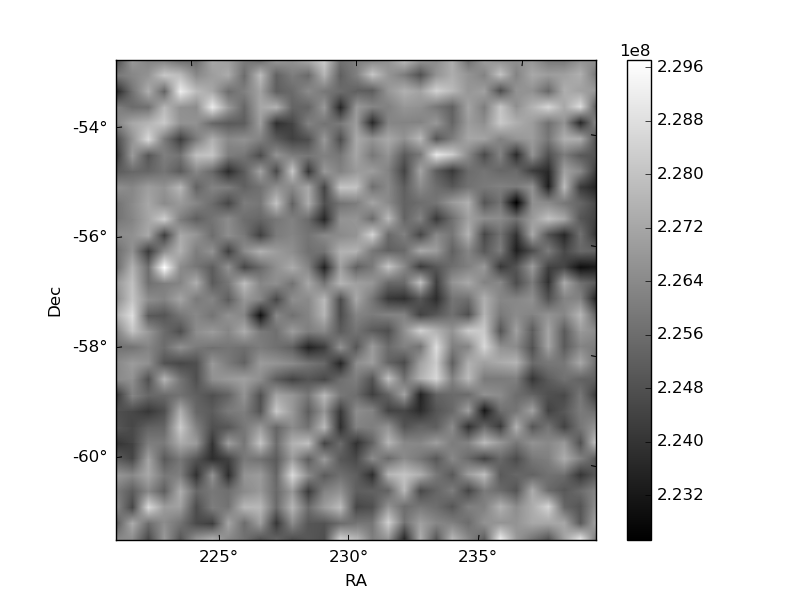
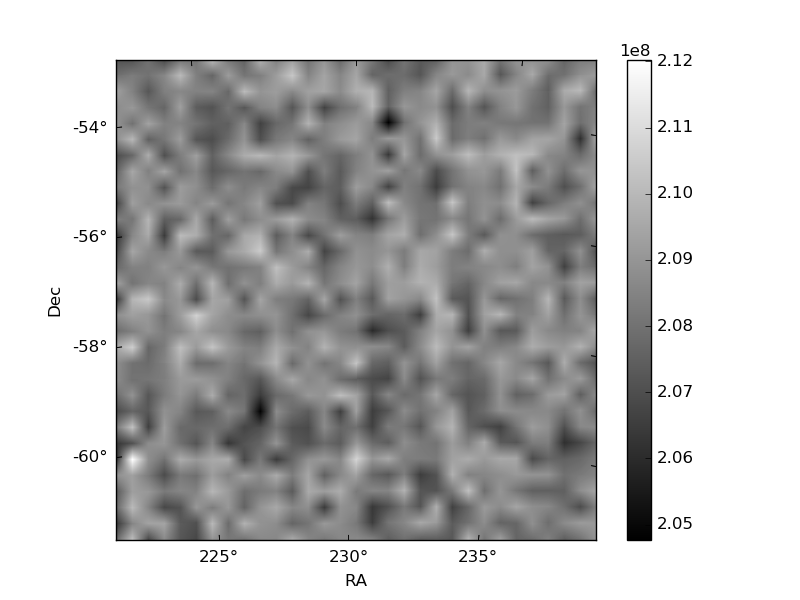
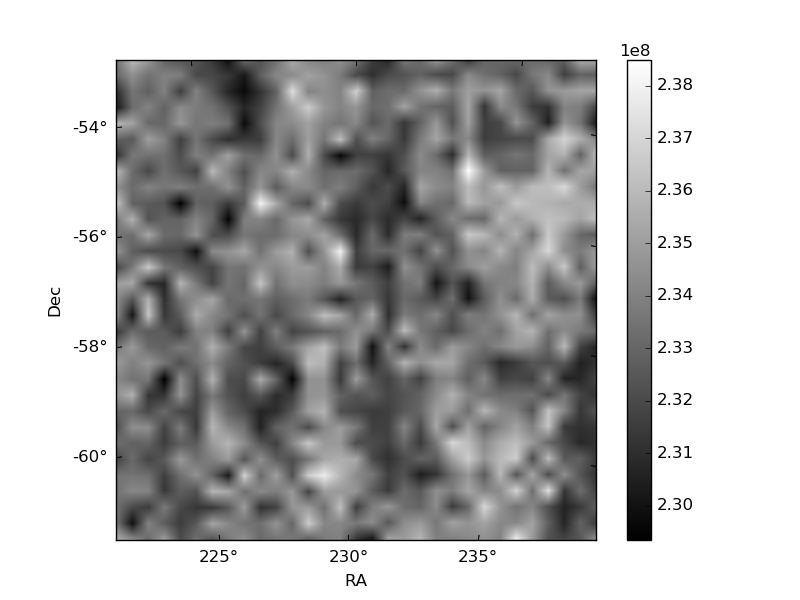
Histogram calculated using DETX and DETY for each event in the final _common_clean file
| Quadrant A | 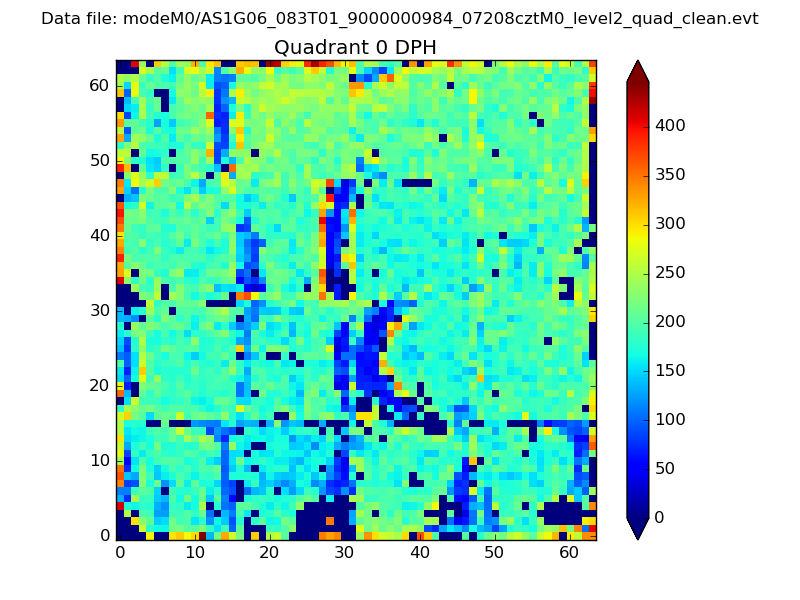 |
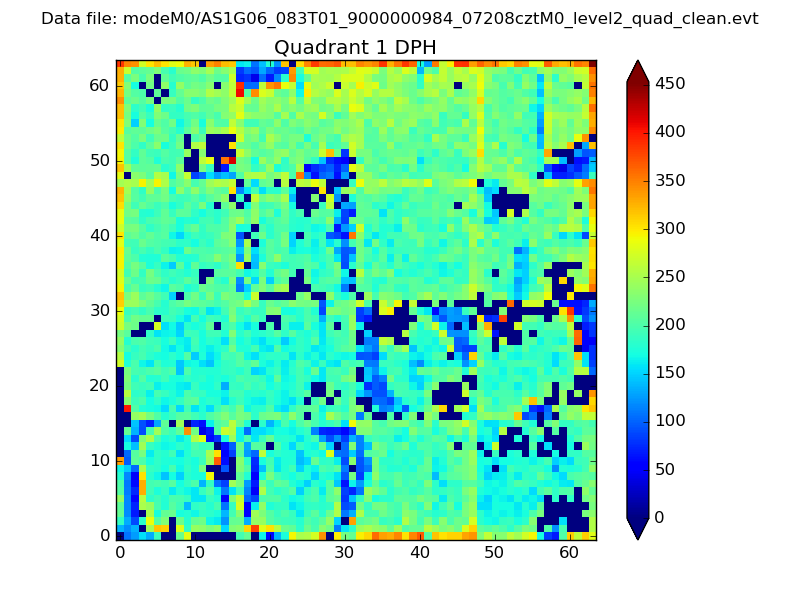 |
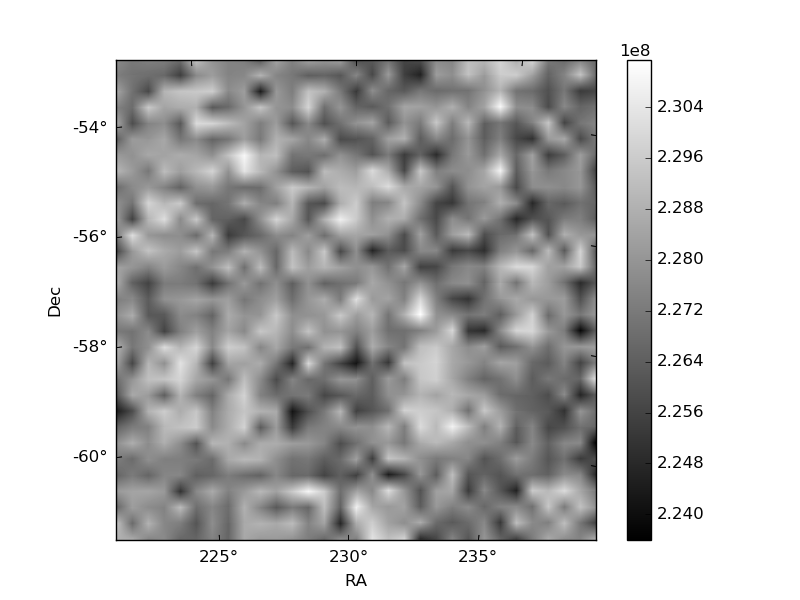
Quadrant B |
|---|---|---|---|
| Quadrant D | 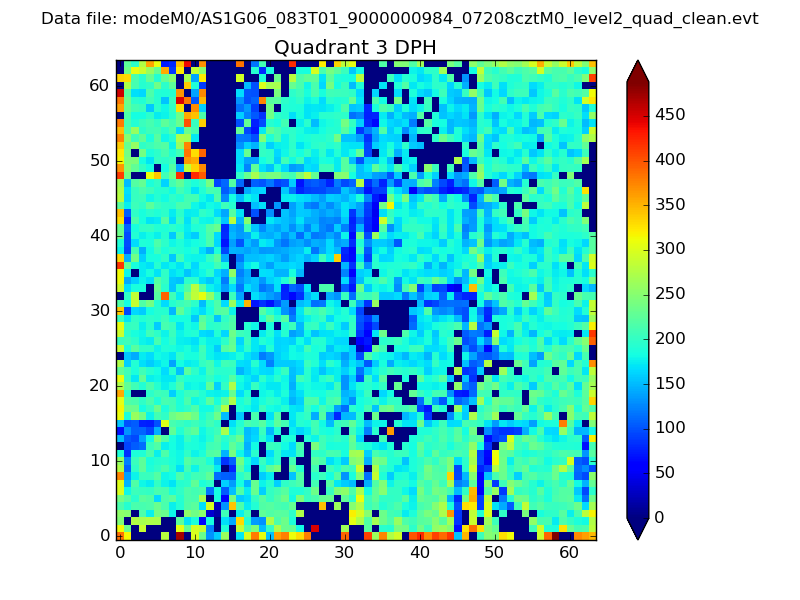 |
 |
Quadrant C |
| Plot type | Count rate plots | Images |
|---|---|---|
| Comparison with Poisson distribution Blue bars denote a histogram of data divided into 1 sec bins. Red curve is a Poisson curve with rate = median count rate of data. |
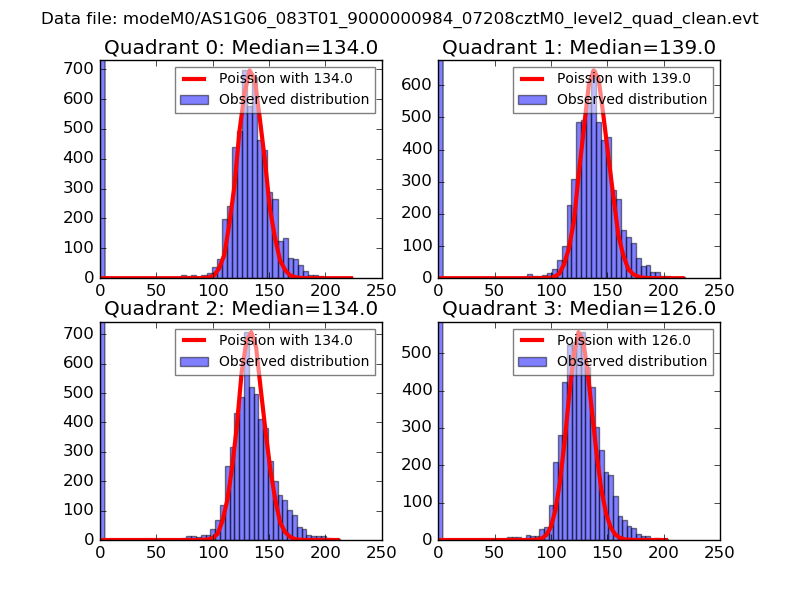 |
 |
| Quadrant-wise count rates Data is divided into 100 sec bins |
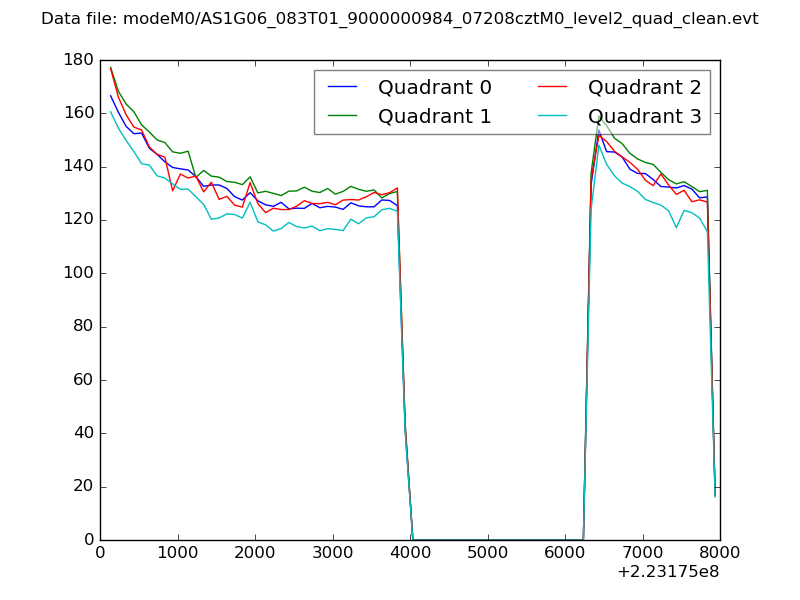 |
|
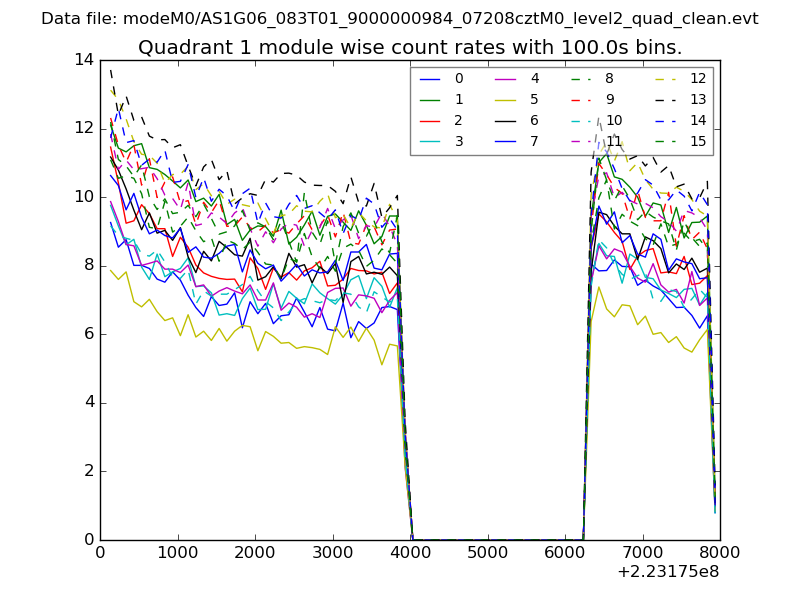
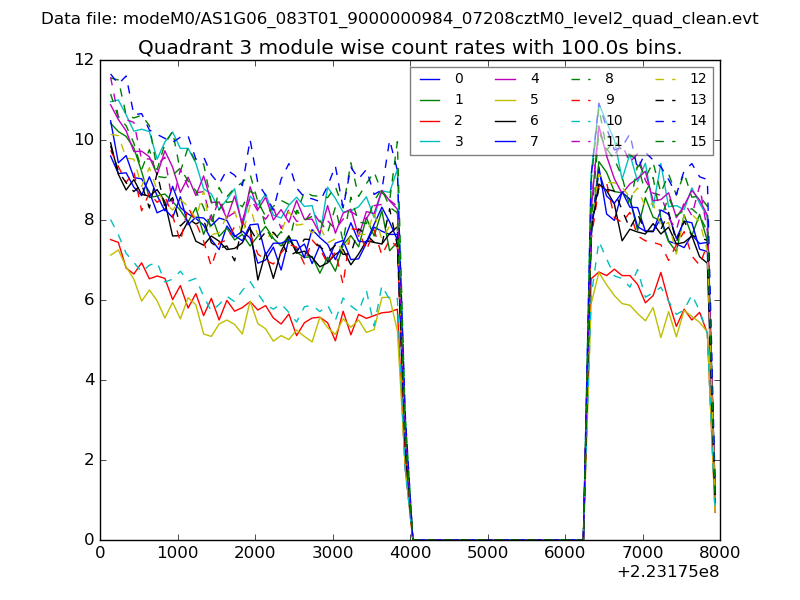
| Module-wise count rates for Quadrant A Data is divided into 100 sec bins |
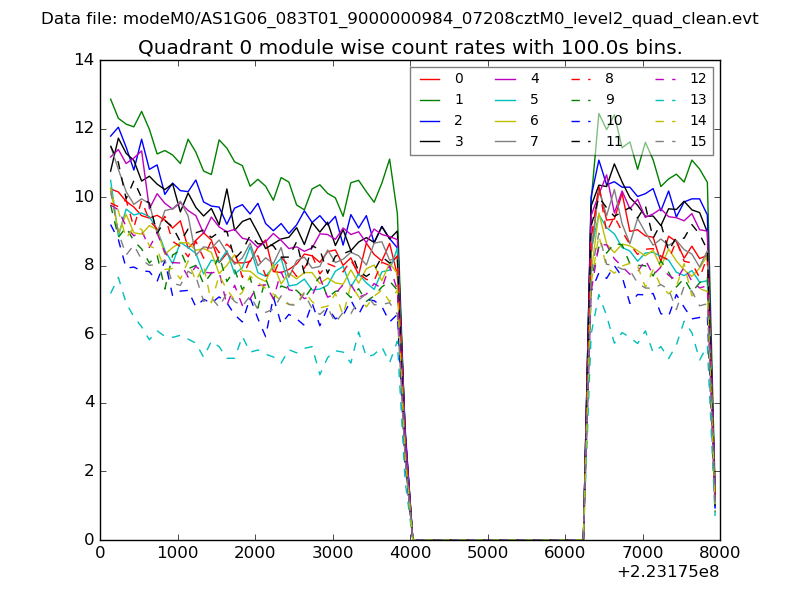 |
 |
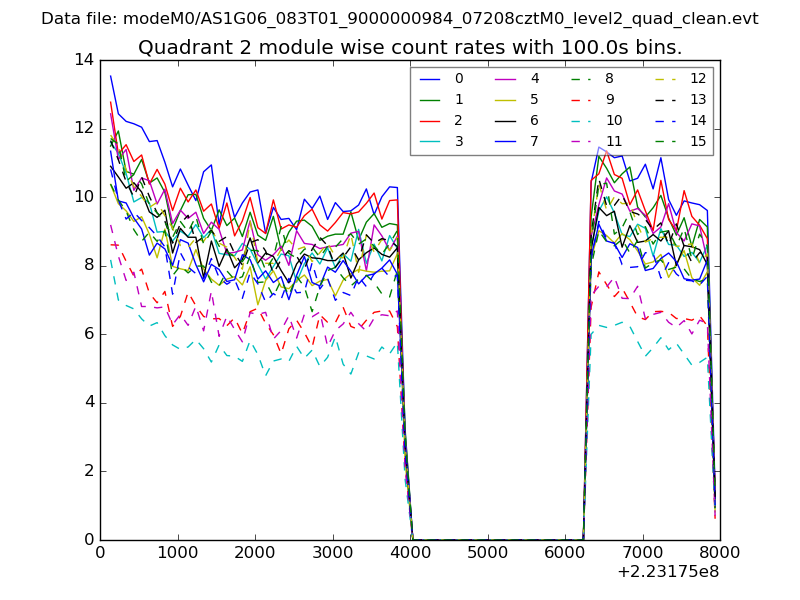
| Module-wise count rates for Quadrant B Data is divided into 100 sec bins |
 |
 |
| Module-wise count rates for Quadrant C Data is divided into 100 sec bins |
 |
 |
| Module-wise count rates for Quadrant D Data is divided into 100 sec bins |
 |
 |
| Parameter | Plot |
|---|---|
| CZT HV Monitor | 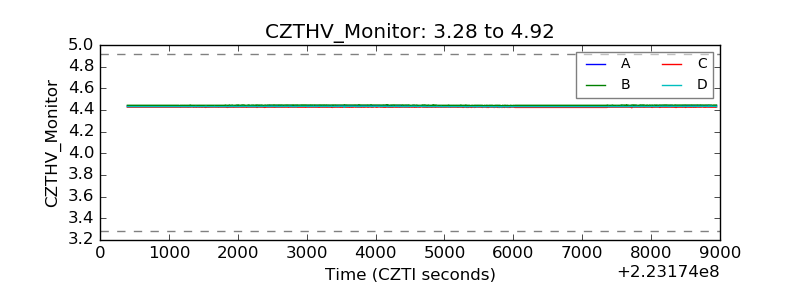 |
| D_VDD | 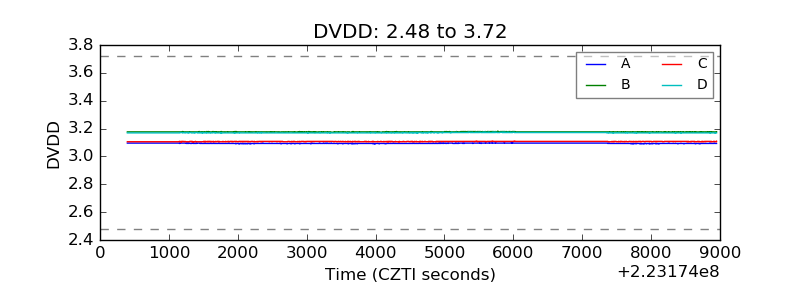 |
| Temperature 1 | 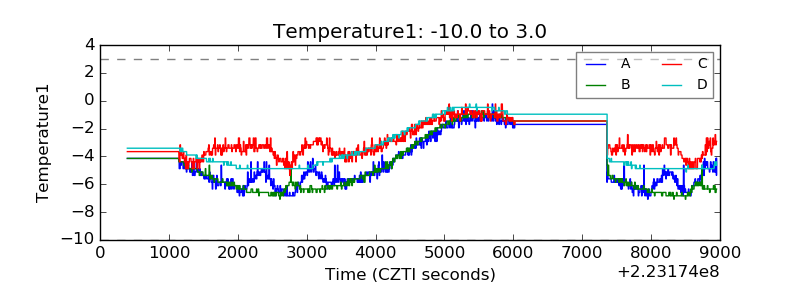 |
| Veto HV Monitor | 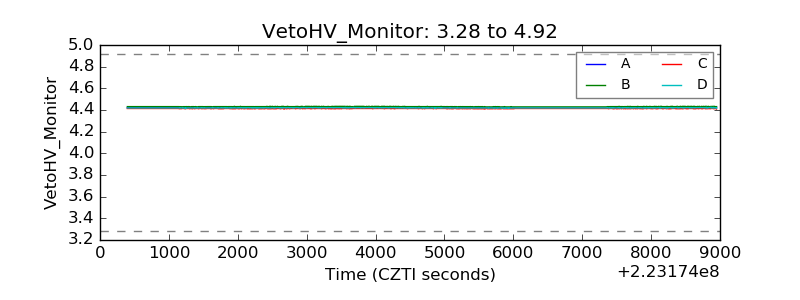 |
| Veto LLD | 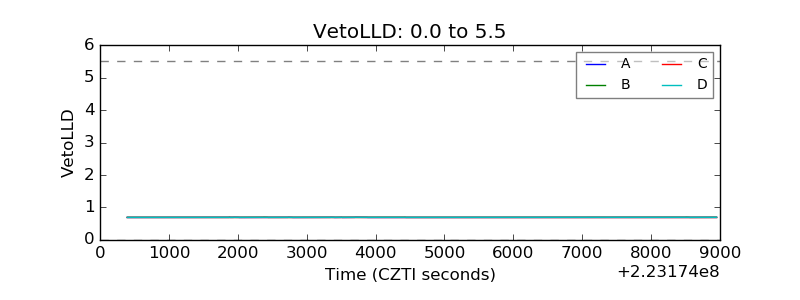 |
| Alpha Counter | 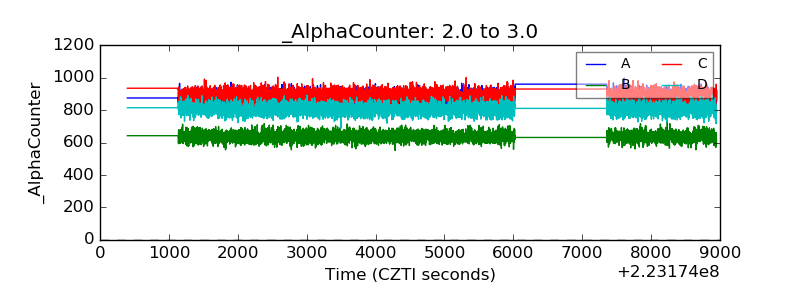 |
| _CPM_Rate | 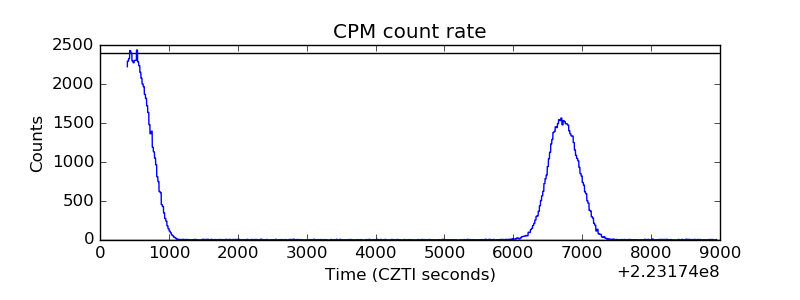 |
| CZT Counter | 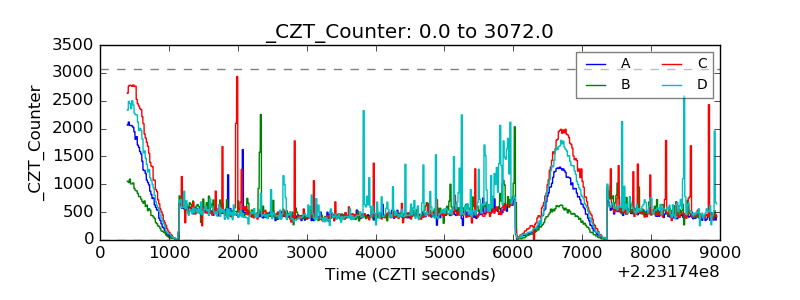 |
| +2.5 Volts monitor |  |
| +5 Volts monitor |  |
| _ROLL_ROT | 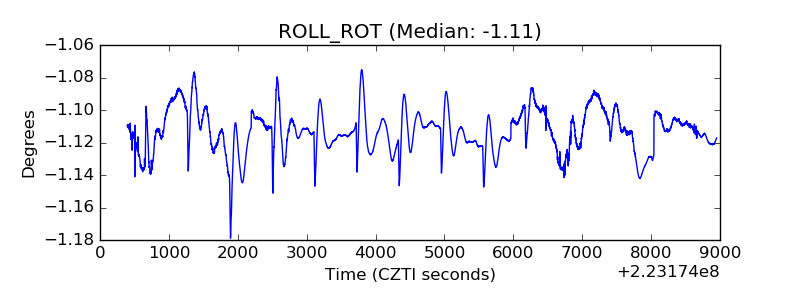 |
| _Roll_DEC | 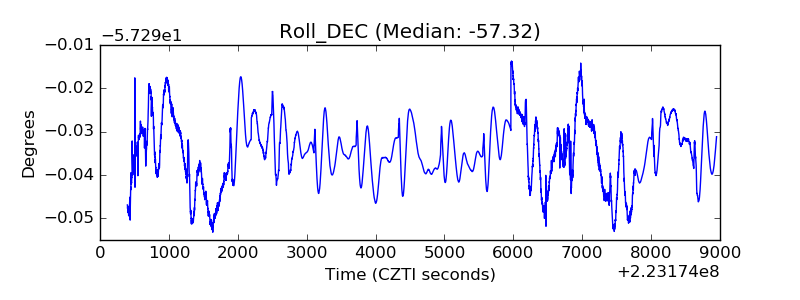 |
| _Roll_RA | 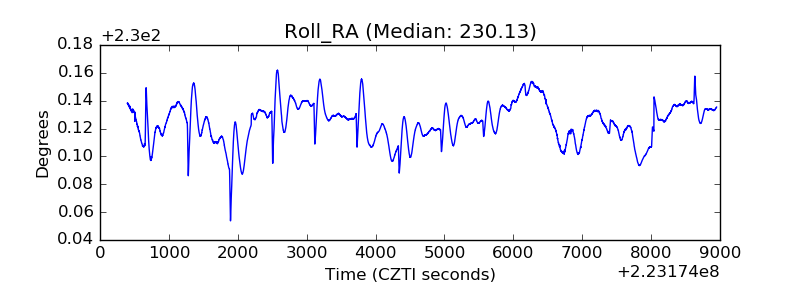 |
| Veto Counter | 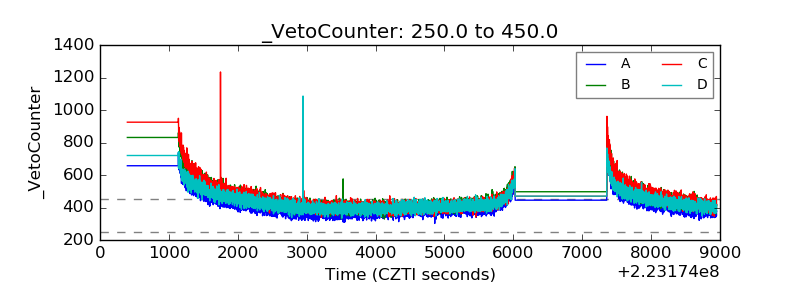 |