| Param | Original file | Final file |
|---|---|---|
| Filename | modeM0/AS1G06_083T01_9000000984_07209cztM0_level2.evt | modeM0/AS1G06_083T01_9000000984_07209cztM0_level2_quad_clean.evt |
| Size (bytes) | 461,580,480 | 95,898,240 |
| Size | 440.2 MB | 91.5 MB |
| Events in quadrant A | 2,814,363 | 622,643 |
| Events in quadrant B | 3,859,905 | 636,962 |
| Events in quadrant C | 2,949,065 | 626,057 |
| Events in quadrant D | 3,936,009 | 587,449 |
| Mode M9 | |||
|---|---|---|---|
| Quadrant | BADHDUFLAG | Total packets | Discarded packets |
| A | 0 | 12 | 0 |
| B | 0 | 12 | 0 |
| C | 0 | 12 | 0 |
| D | 0 | 12 | 0 |
| Mode SS | |||
|---|---|---|---|
| Quadrant | BADHDUFLAG | Total packets | Discarded packets |
| A | 0 | 126 | 0 |
| B | 0 | 126 | 0 |
| C | 0 | 126 | 0 |
| D | 0 | 126 | 0 |
| Mode M0 | |||
|---|---|---|---|
| Quadrant | BADHDUFLAG | Total packets | Discarded packets |
| A | 0 | 12636 | 2 |
| B | 0 | 15549 | 1 |
| C | 0 | 12950 | 1 |
| D | 0 | 15684 | 1 |
| Quadrant | Total seconds | Saturated seconds | Saturation percentage |
|---|---|---|---|
| A | 6175 | 25 | 0.404858% |
| B | 6175 | 460 | 7.449393% |
| C | 6175 | 31 | 0.502024% |
| D | 6175 | 115 | 1.862348% |
Noise dominated data is calculated using 1-second bins in cleaned event files. If a bin has >2000 counts, and if more than 50% of those come from <1% of pixels, then it is considered to be noise-dominated and hence unusable.
| Quadrant | # 1 sec bins | Bins with >0 counts | Bins with >2000 counts | High rate bins dominated by noise | Noise dominated (total time) | Noise dominated (detector-on time) | Marked lightcurve |
|---|---|---|---|---|---|---|---|
| A | 7425 | 6176 | 5 | 5 | 0.07% | 0.08% | 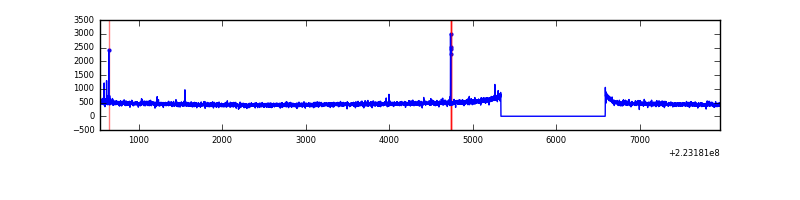 |
| B | 7425 | 6176 | 190 | 190 | 2.56% | 3.08% |  |
| C | 7425 | 6176 | 24 | 24 | 0.32% | 0.39% | 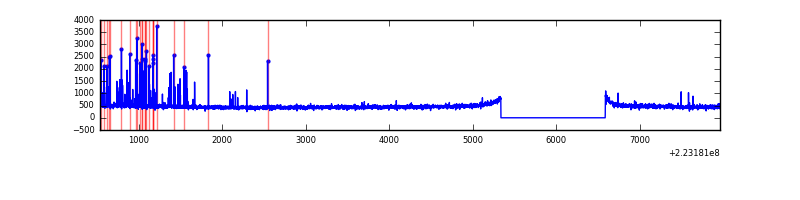 |
| D | 7425 | 6176 | 85 | 85 | 1.14% | 1.38% | 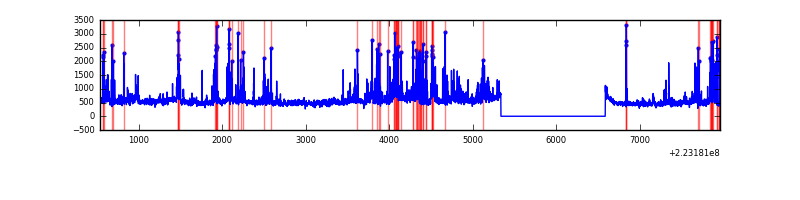 |
Top three noisy pixels from each quadrant. If the there are fewer than three noisy pixels in the level2.evt file, extra rows are filled as -1
| Pixel properties | Quadrant properties | ||||||
|---|---|---|---|---|---|---|---|
| Quadrant | DetID | PixID | Counts | Sigma | Mean | Median | Sigma |
| A | 14 | 111 | 13125 | 86.18 | 721 | 706 | 144.1 |
| A | 3 | 1 | 8819 | 56.3 | 721 | 706 | 144.1 |
| A | 13 | 248 | 7449 | 46.79 | 721 | 706 | 144.1 |
| B | 0 | 228 | 820999 | 6206.15 | 711 | 692 | 132.2 |
| B | 0 | 214 | 85450 | 641.25 | 711 | 692 | 132.2 |
| B | 10 | 16 | 67988 | 509.14 | 711 | 692 | 132.2 |
| C | 9 | 243 | 126669 | 765.2 | 720 | 724 | 164.6 |
| C | 13 | 61 | 5368 | 28.22 | 720 | 724 | 164.6 |
| C | 1 | 16 | 5106 | 26.62 | 720 | 724 | 164.6 |
| D | 2 | 216 | 522573 | 3021.39 | 707 | 685 | 172.7 |
| D | 8 | 195 | 451377 | 2609.21 | 707 | 685 | 172.7 |
| D | 14 | 34 | 90732 | 521.31 | 707 | 685 | 172.7 |
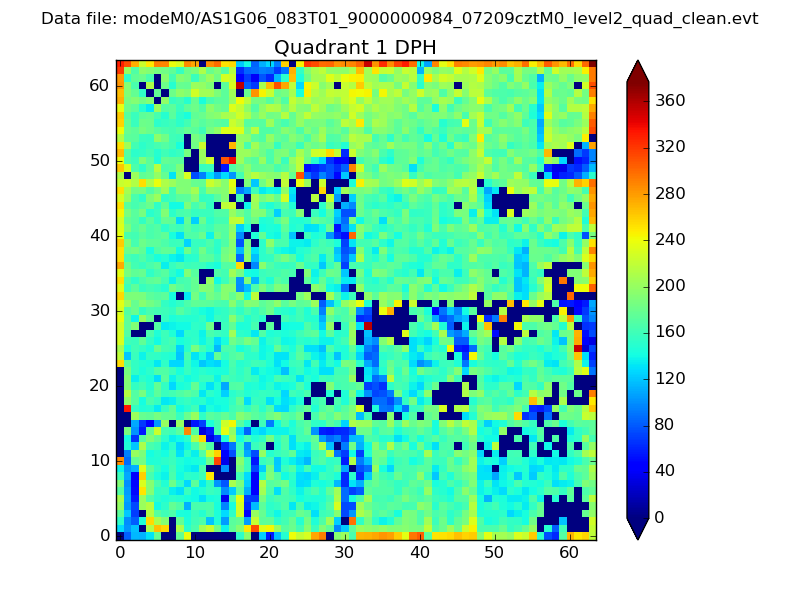
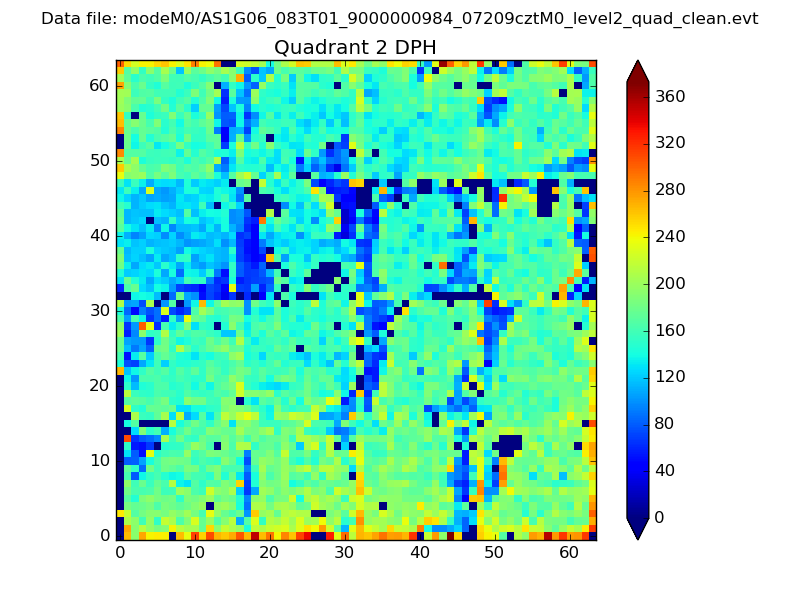
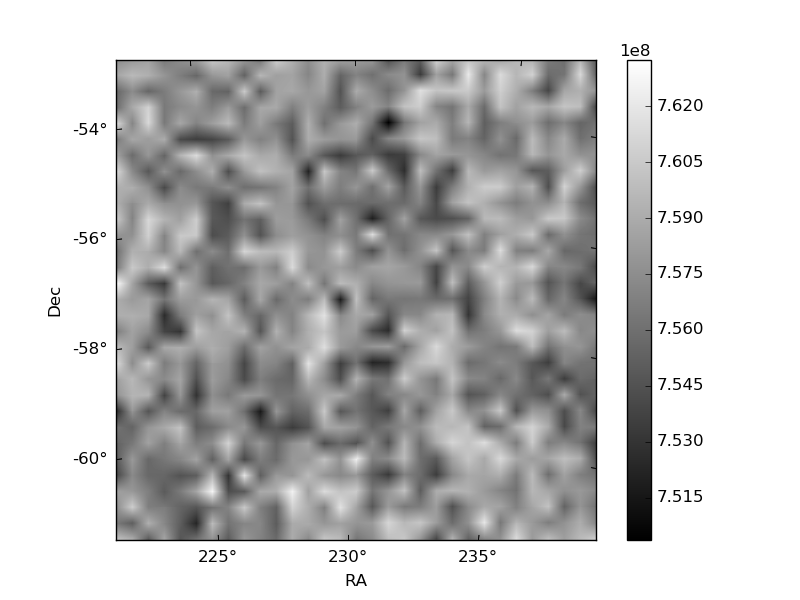
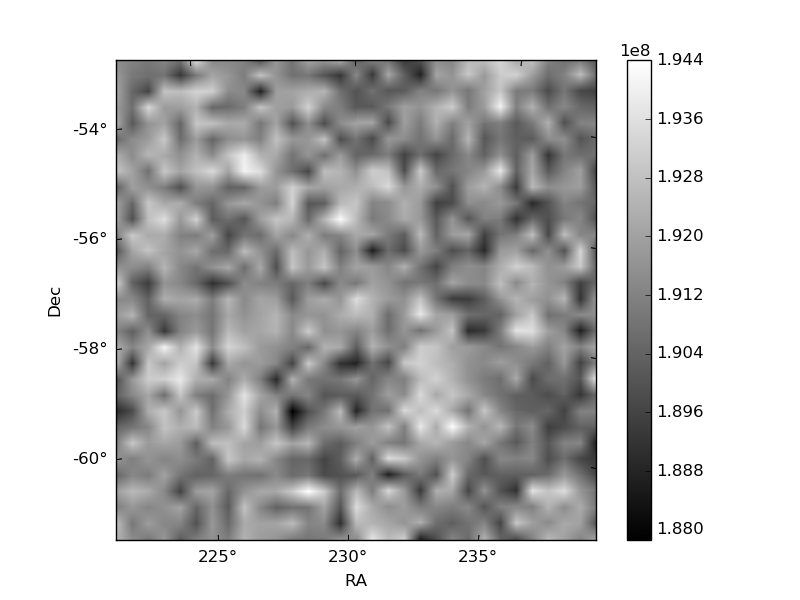
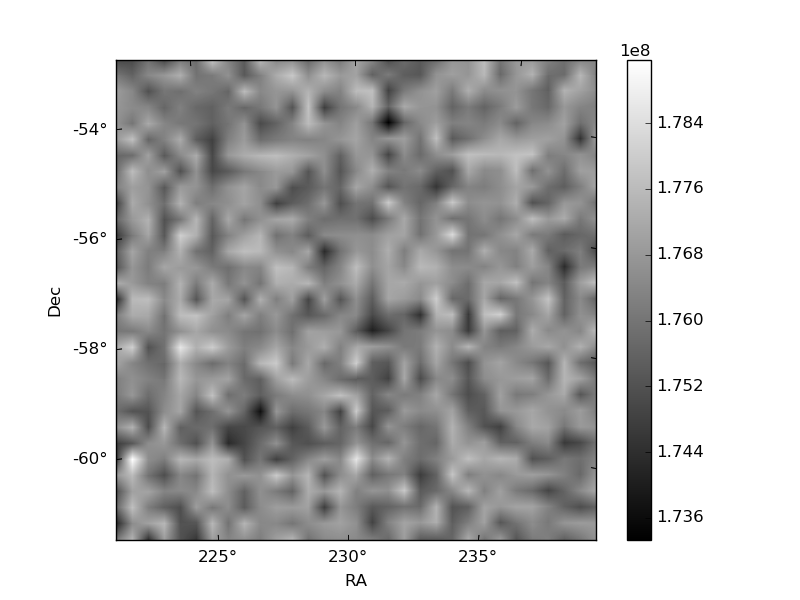
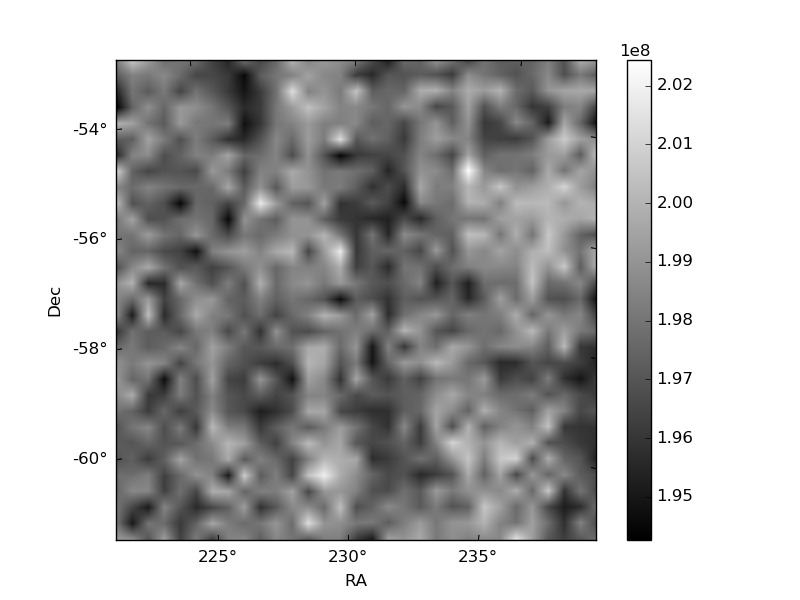
Histogram calculated using DETX and DETY for each event in the final _common_clean file
| Quadrant A | 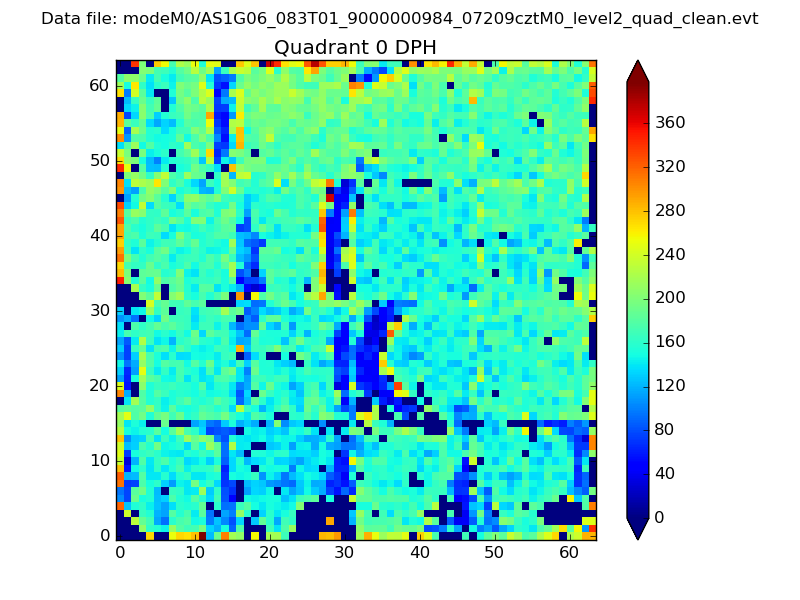 |
 |
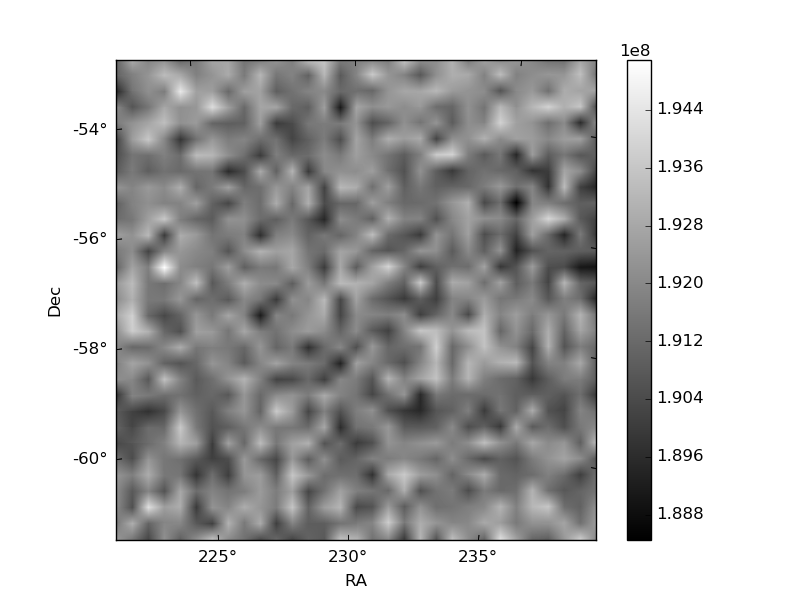
Quadrant B |
|---|---|---|---|
| Quadrant D | 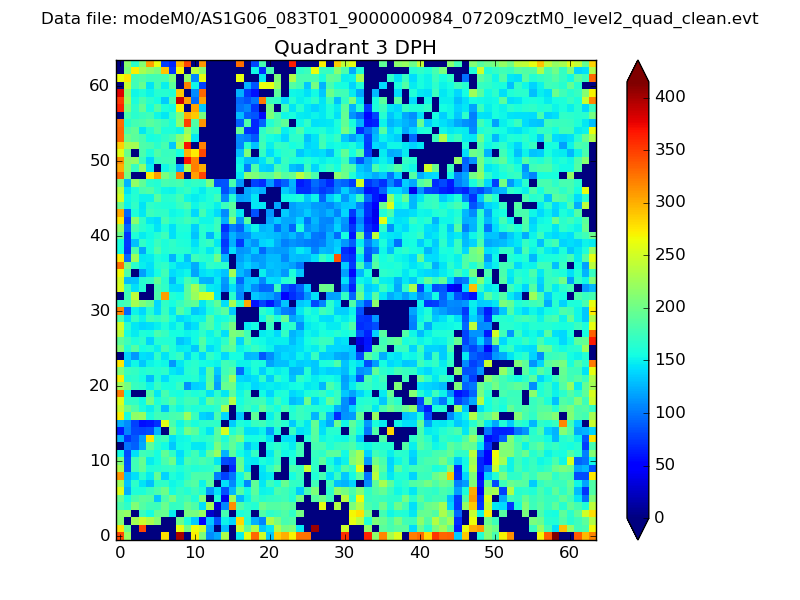 |
 |
Quadrant C |
| Plot type | Count rate plots | Images |
|---|---|---|
| Comparison with Poisson distribution Blue bars denote a histogram of data divided into 1 sec bins. Red curve is a Poisson curve with rate = median count rate of data. |
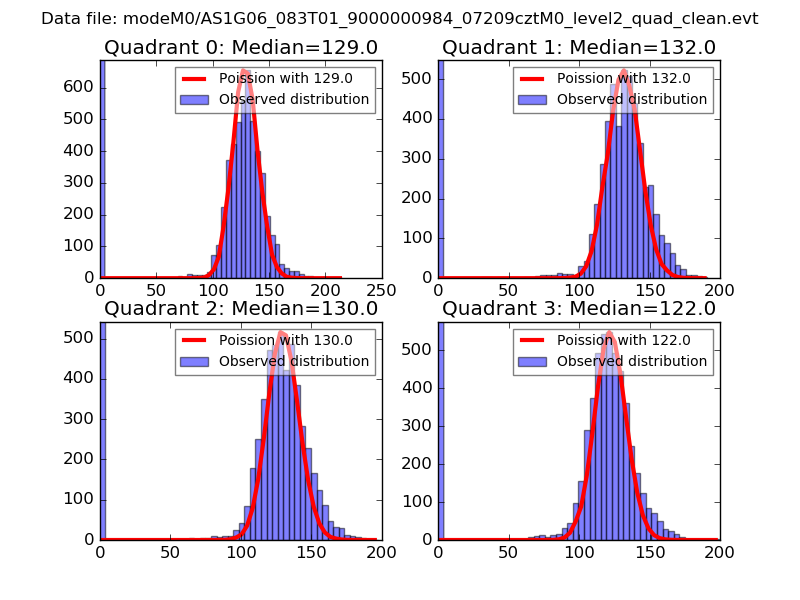 |
 |
| Quadrant-wise count rates Data is divided into 100 sec bins |
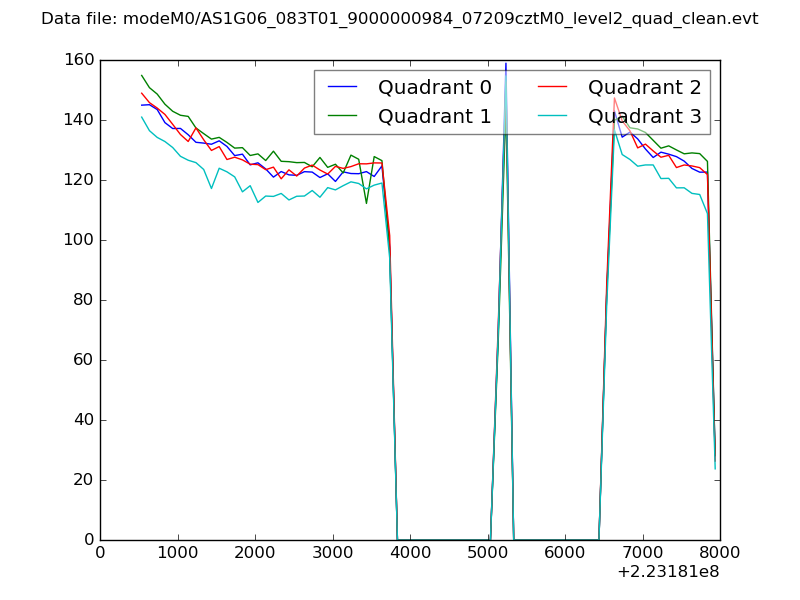 |
|
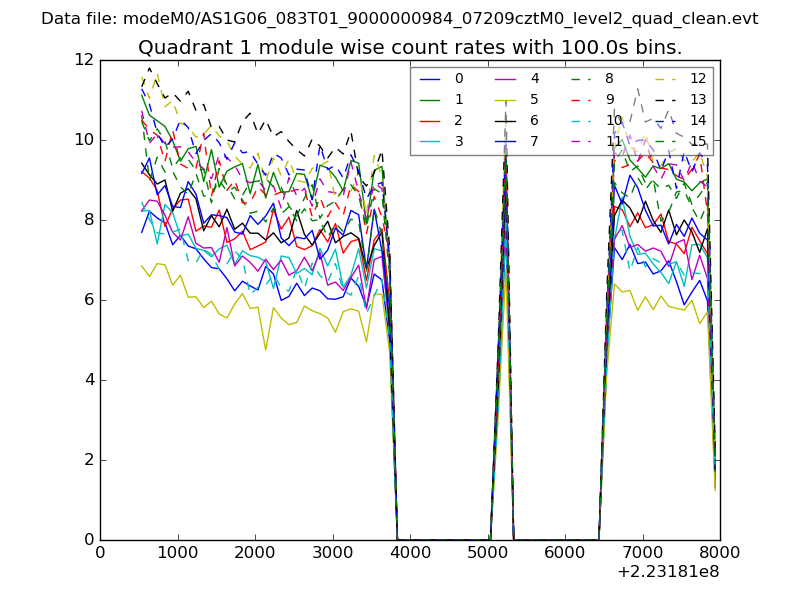
| Module-wise count rates for Quadrant A Data is divided into 100 sec bins |
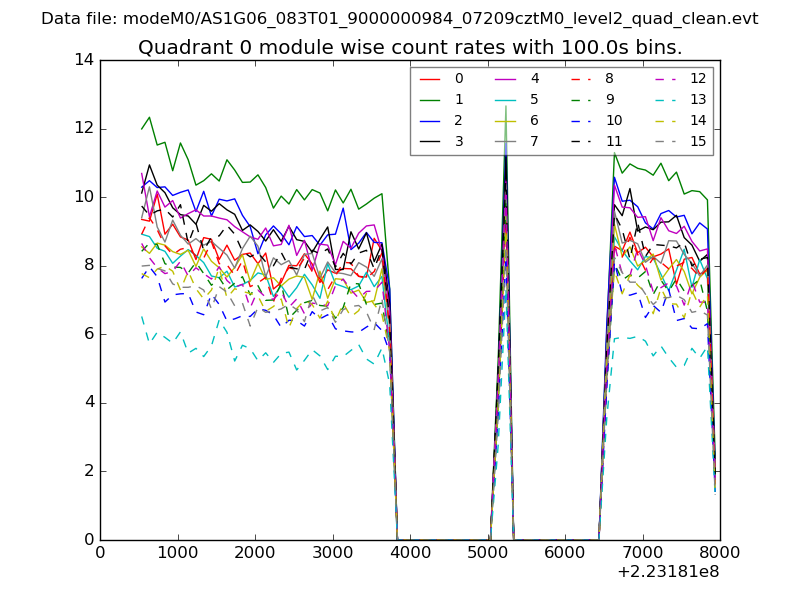 |
 |
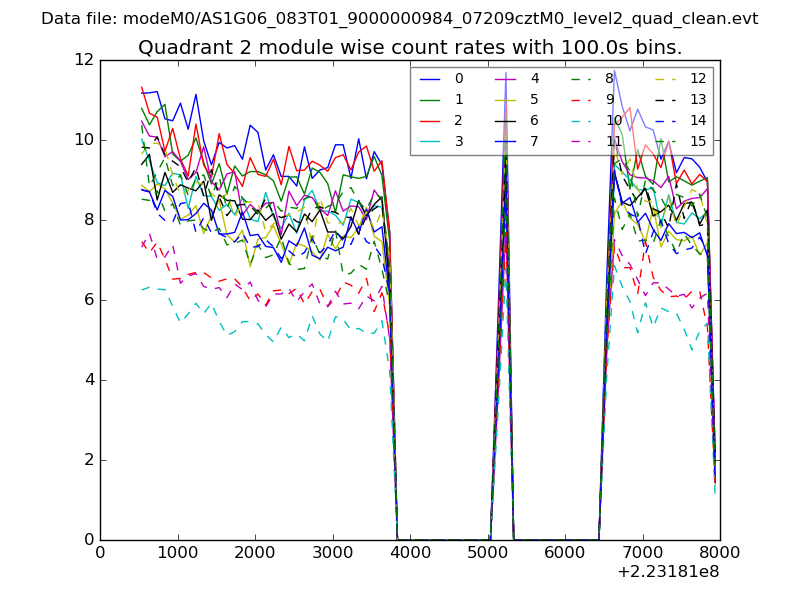
| Module-wise count rates for Quadrant B Data is divided into 100 sec bins |
 |
 |
| Module-wise count rates for Quadrant C Data is divided into 100 sec bins |
 |
 |
| Module-wise count rates for Quadrant D Data is divided into 100 sec bins |
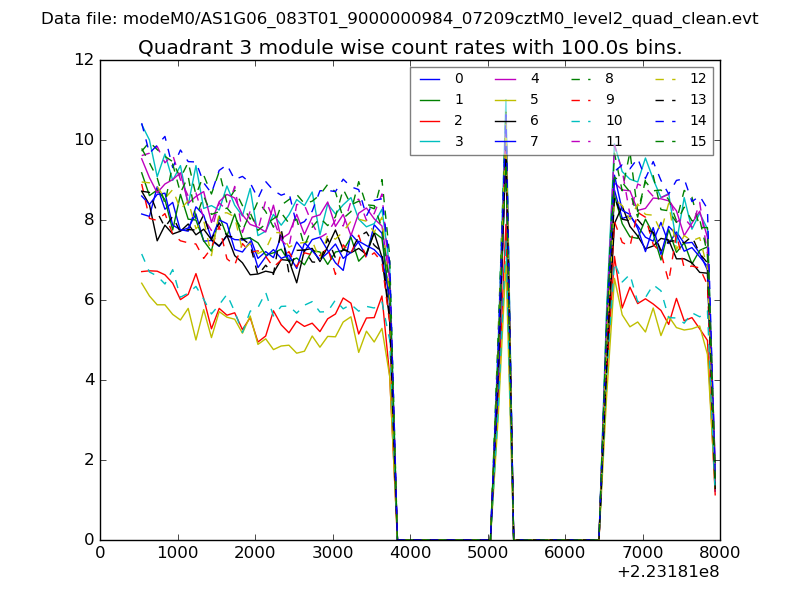 |
 |
| Parameter | Plot |
|---|---|
| CZT HV Monitor | 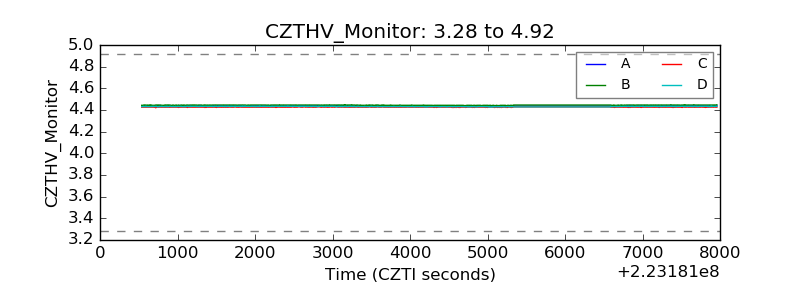 |
| D_VDD | 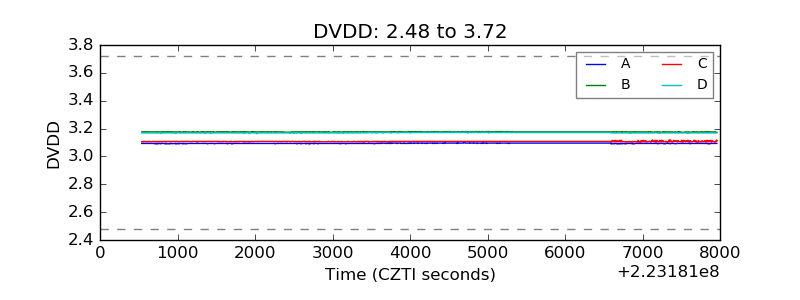 |
| Temperature 1 | 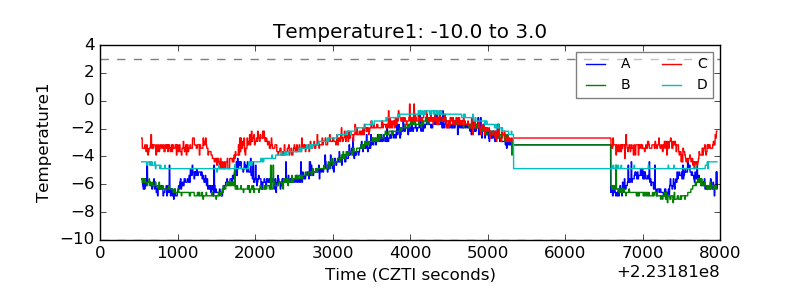 |
| Veto HV Monitor | 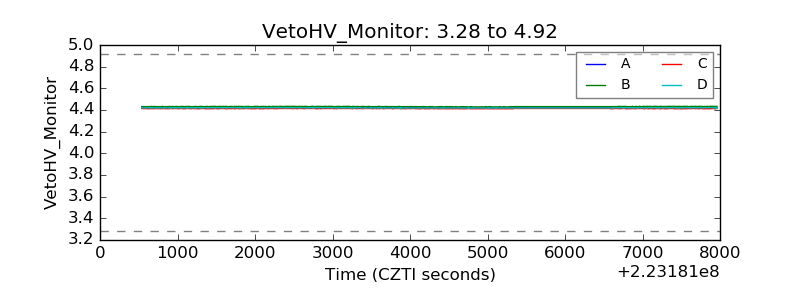 |
| Veto LLD | 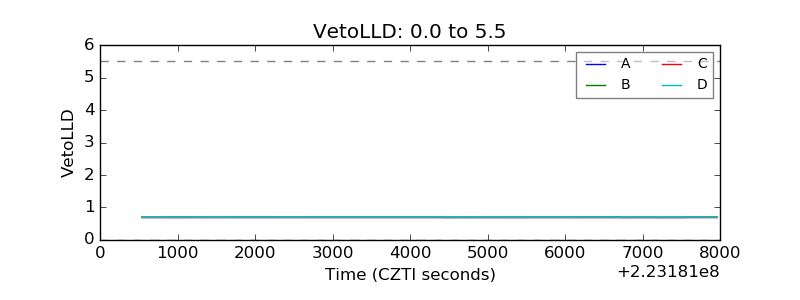 |
| Alpha Counter | 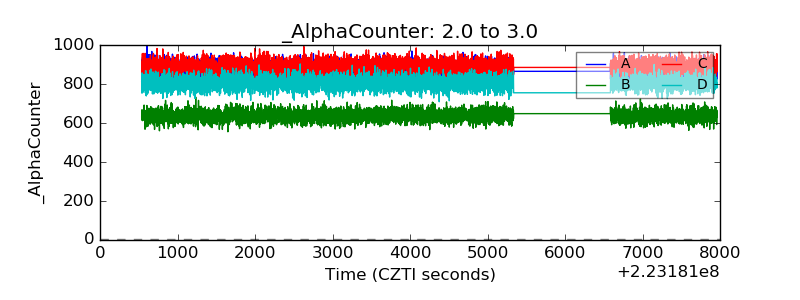 |
| _CPM_Rate | 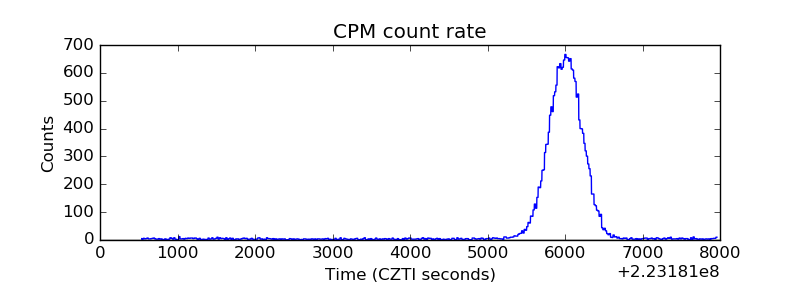 |
| CZT Counter | 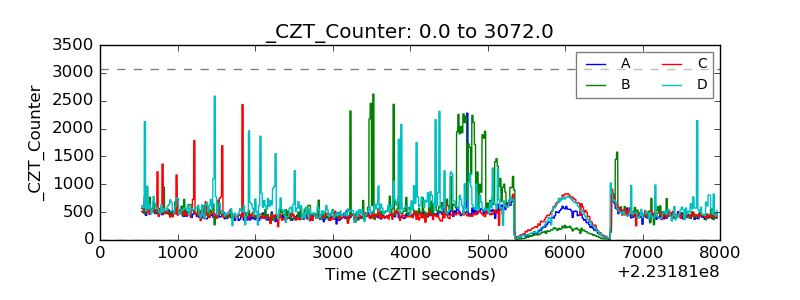 |
| +2.5 Volts monitor |  |
| +5 Volts monitor |  |
| _ROLL_ROT | 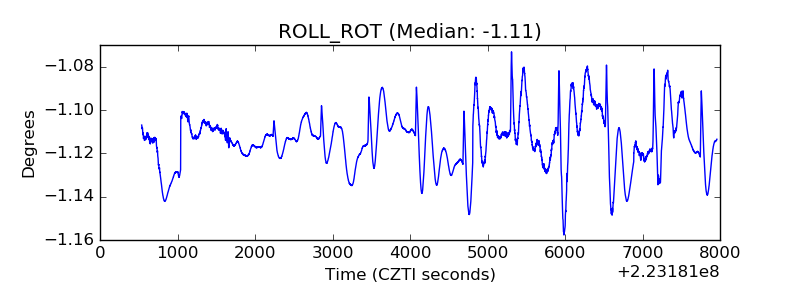 |
| _Roll_DEC | 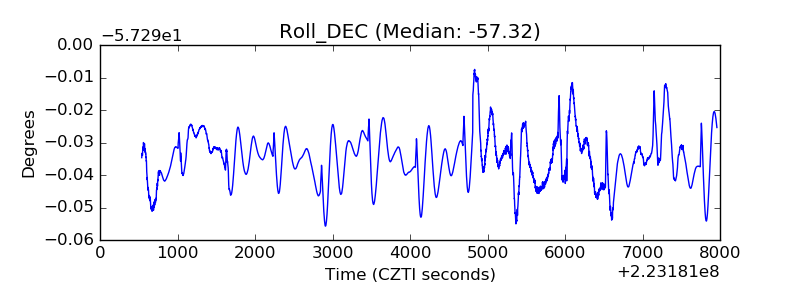 |
| _Roll_RA | 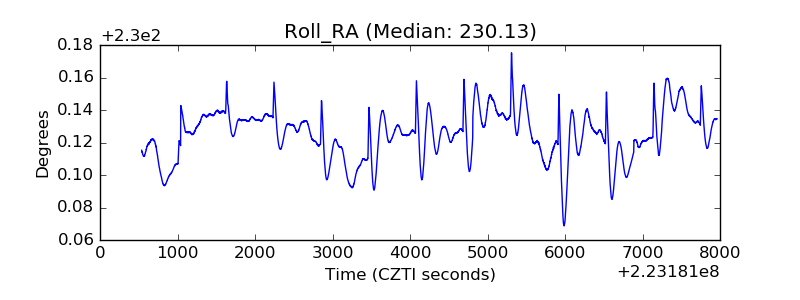 |
| Veto Counter | 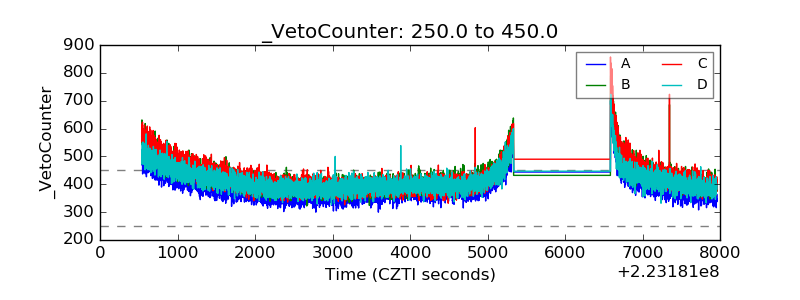 |