| Param | Original file | Final file |
|---|---|---|
| Filename | modeM0/AS1G06_083T01_9000000984_07210cztM0_level2.evt | modeM0/AS1G06_083T01_9000000984_07210cztM0_level2_quad_clean.evt |
| Size (bytes) | 477,590,400 | 105,552,000 |
| Size | 455.5 MB | 100.7 MB |
| Events in quadrant A | 3,310,971 | 667,516 |
| Events in quadrant B | 3,427,842 | 720,107 |
| Events in quadrant C | 3,153,160 | 703,096 |
| Events in quadrant D | 4,115,498 | 637,475 |
| Mode M9 | |||
|---|---|---|---|
| Quadrant | BADHDUFLAG | Total packets | Discarded packets |
| A | 0 | 14 | 0 |
| B | 0 | 14 | 0 |
| C | 0 | 14 | 0 |
| D | 0 | 15 | 0 |
| Mode SS | |||
|---|---|---|---|
| Quadrant | BADHDUFLAG | Total packets | Discarded packets |
| A | 0 | 136 | 0 |
| B | 0 | 136 | 0 |
| C | 0 | 136 | 0 |
| D | 0 | 136 | 0 |
| Mode M0 | |||
|---|---|---|---|
| Quadrant | BADHDUFLAG | Total packets | Discarded packets |
| A | 0 | 14570 | 3 |
| B | 0 | 14694 | 2 |
| C | 0 | 14086 | 2 |
| D | 0 | 16744 | 2 |
| Quadrant | Total seconds | Saturated seconds | Saturation percentage |
|---|---|---|---|
| A | 6721 | 97 | 1.443238% |
| B | 6721 | 66 | 0.981997% |
| C | 6721 | 30 | 0.446362% |
| D | 6721 | 194 | 2.886475% |
Noise dominated data is calculated using 1-second bins in cleaned event files. If a bin has >2000 counts, and if more than 50% of those come from <1% of pixels, then it is considered to be noise-dominated and hence unusable.
| Quadrant | # 1 sec bins | Bins with >0 counts | Bins with >2000 counts | High rate bins dominated by noise | Noise dominated (total time) | Noise dominated (detector-on time) | Marked lightcurve |
|---|---|---|---|---|---|---|---|
| A | 7686 | 6722 | 12 | 12 | 0.16% | 0.18% | 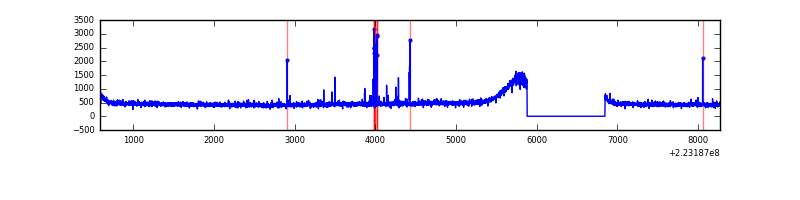 |
| B | 7686 | 6722 | 10 | 10 | 0.13% | 0.15% | 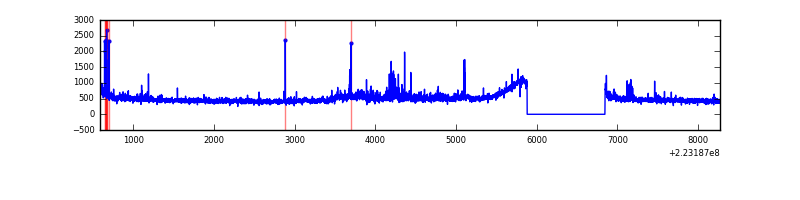 |
| C | 7686 | 6722 | 2 | 2 | 0.03% | 0.03% | 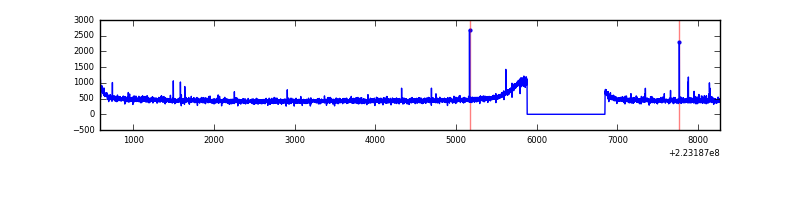 |
| D | 7686 | 6721 | 93 | 93 | 1.21% | 1.38% | 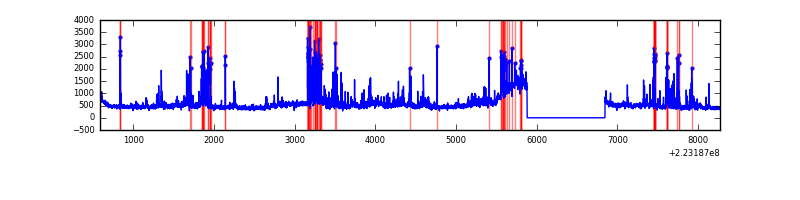 |
Top three noisy pixels from each quadrant. If the there are fewer than three noisy pixels in the level2.evt file, extra rows are filled as -1
| Pixel properties | Quadrant properties | ||||||
|---|---|---|---|---|---|---|---|
| Quadrant | DetID | PixID | Counts | Sigma | Mean | Median | Sigma |
| A | 14 | 111 | 28766 | 162.4 | 837 | 825 | 172.1 |
| A | 3 | 1 | 28506 | 160.88 | 837 | 825 | 172.1 |
| A | 13 | 248 | 21798 | 121.9 | 837 | 825 | 172.1 |
| B | 0 | 214 | 106360 | 679.33 | 816 | 797 | 155.4 |
| B | 0 | 219 | 52125 | 330.31 | 816 | 797 | 155.4 |
| B | 4 | 81 | 41835 | 264.09 | 816 | 797 | 155.4 |
| C | 9 | 243 | 24727 | 127.81 | 795 | 802 | 187.2 |
| C | 8 | 128 | 12104 | 60.38 | 795 | 802 | 187.2 |
| C | 8 | 112 | 6527 | 30.58 | 795 | 802 | 187.2 |
| D | 2 | 216 | 522254 | 2557.27 | 810 | 789 | 203.9 |
| D | 8 | 195 | 372274 | 1821.77 | 810 | 789 | 203.9 |
| D | 2 | 14 | 91673 | 445.7 | 810 | 789 | 203.9 |
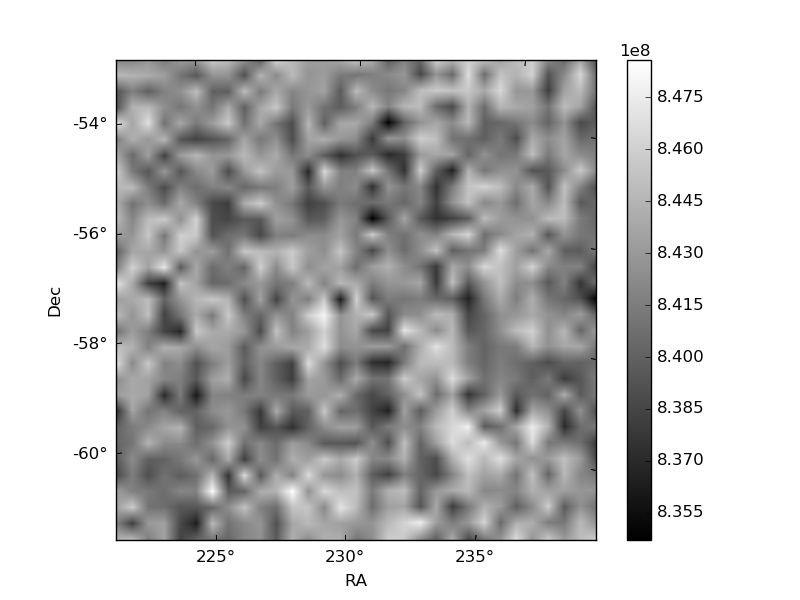
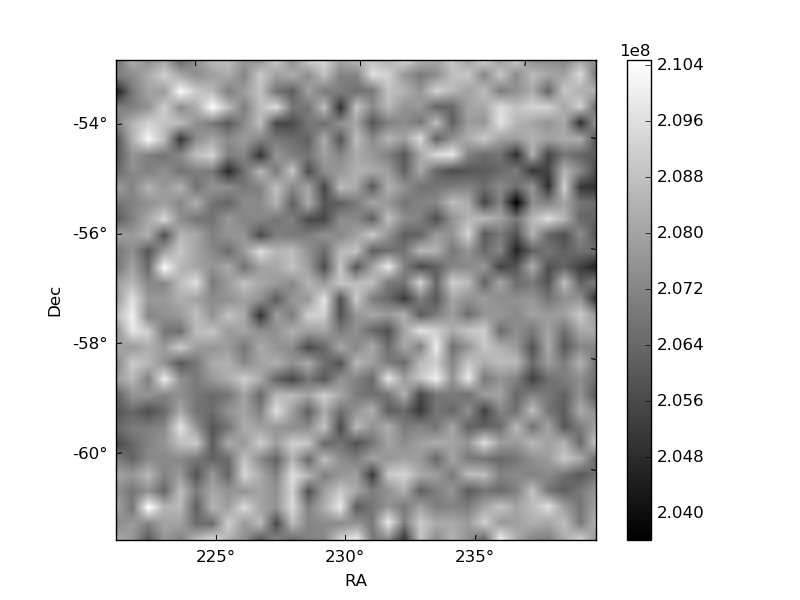
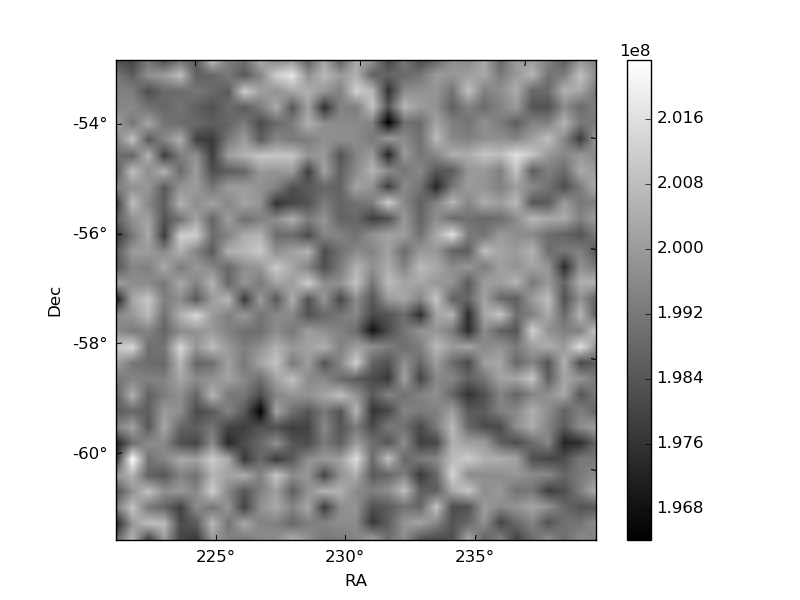
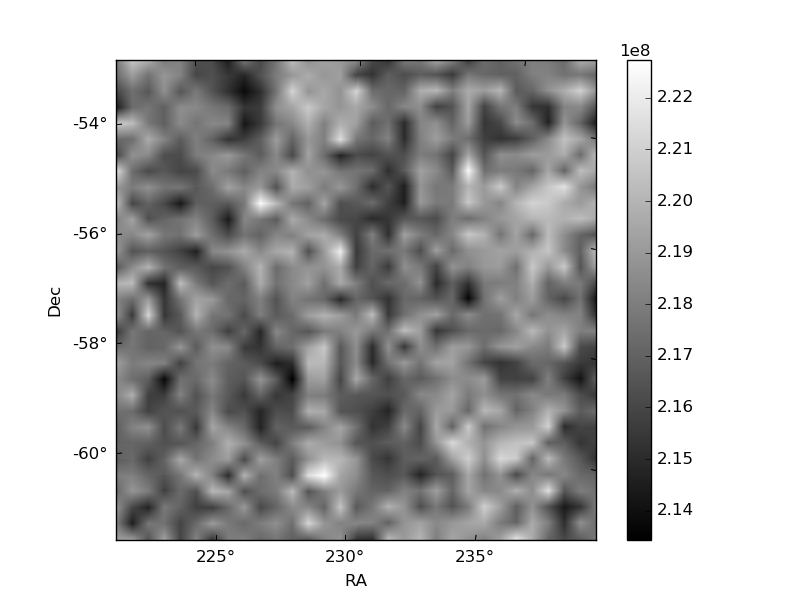
Histogram calculated using DETX and DETY for each event in the final _common_clean file
| Quadrant A | 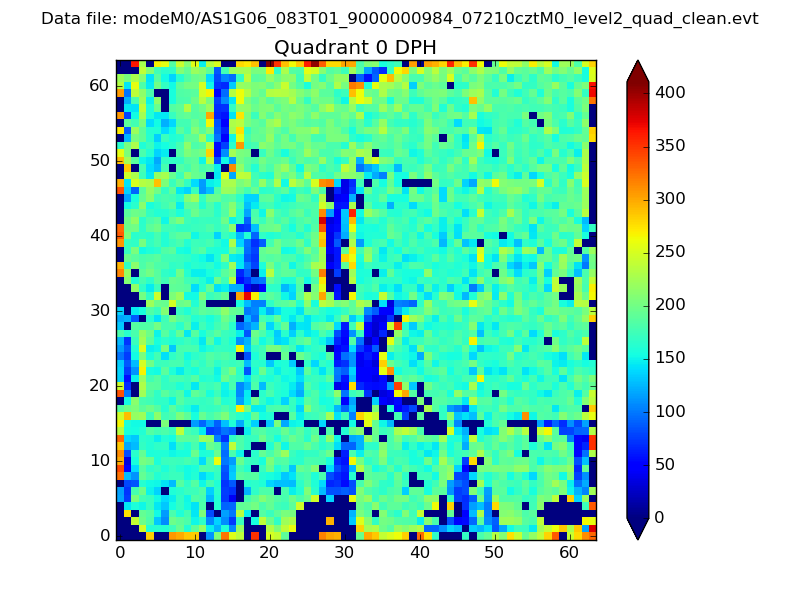 |
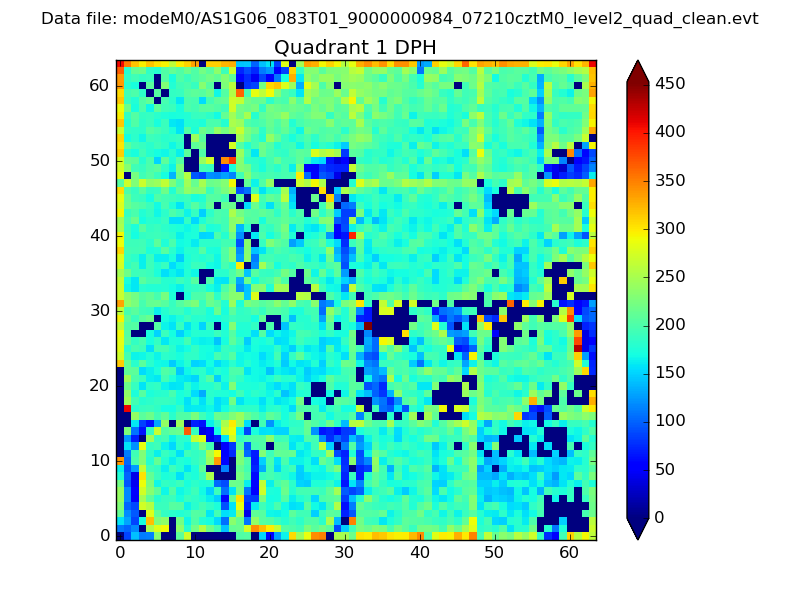 |
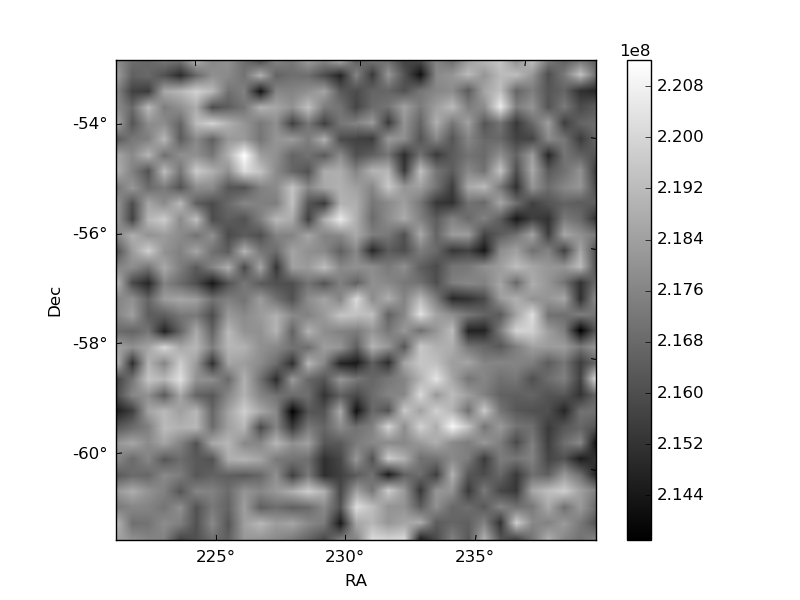
Quadrant B |
|---|---|---|---|
| Quadrant D | 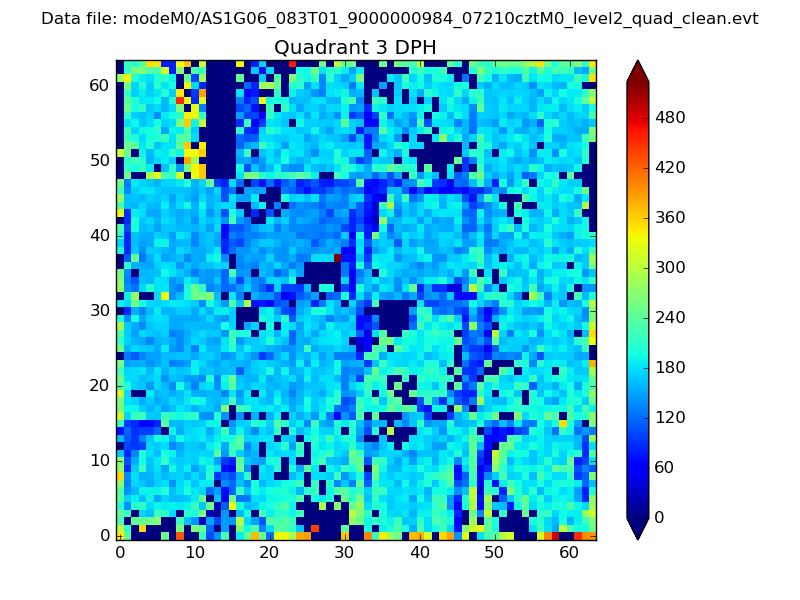 |
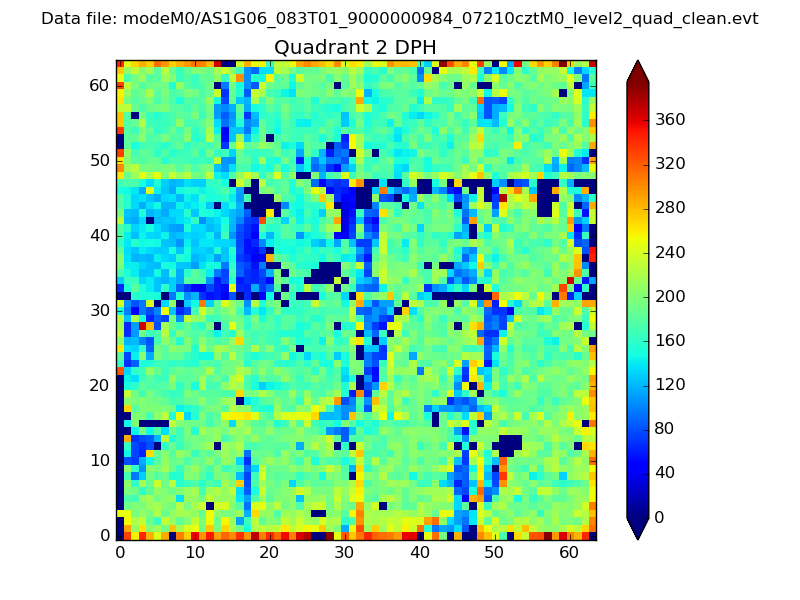 |
Quadrant C |
| Plot type | Count rate plots | Images |
|---|---|---|
| Comparison with Poisson distribution Blue bars denote a histogram of data divided into 1 sec bins. Red curve is a Poisson curve with rate = median count rate of data. |
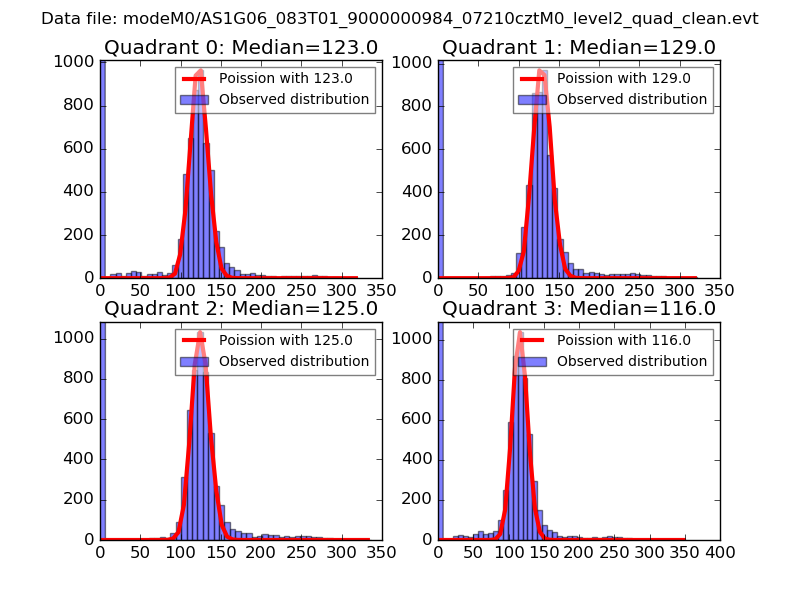 |
 |
| Quadrant-wise count rates Data is divided into 100 sec bins |
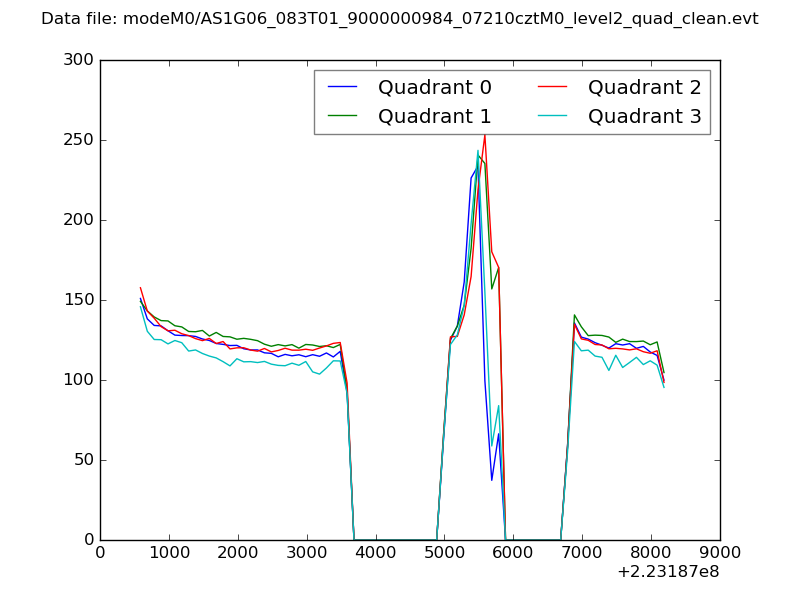 |
|
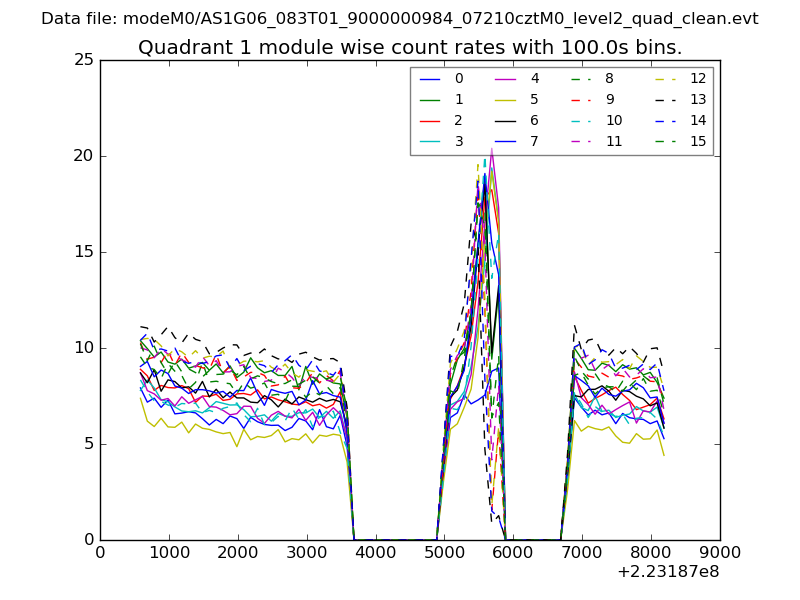
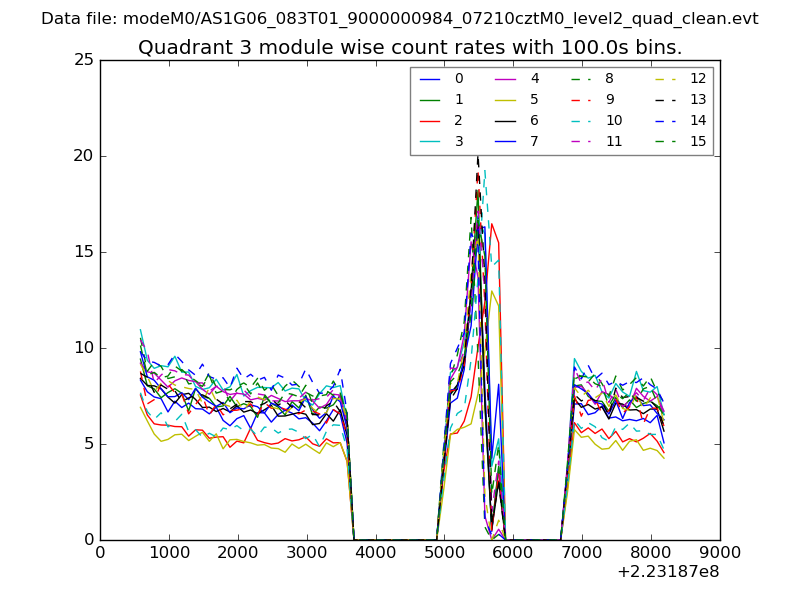
| Module-wise count rates for Quadrant A Data is divided into 100 sec bins |
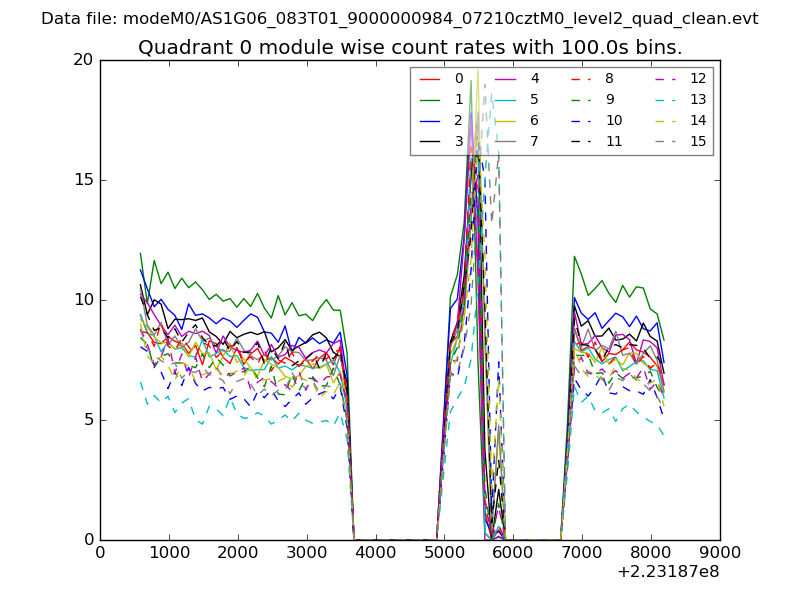 |
 |
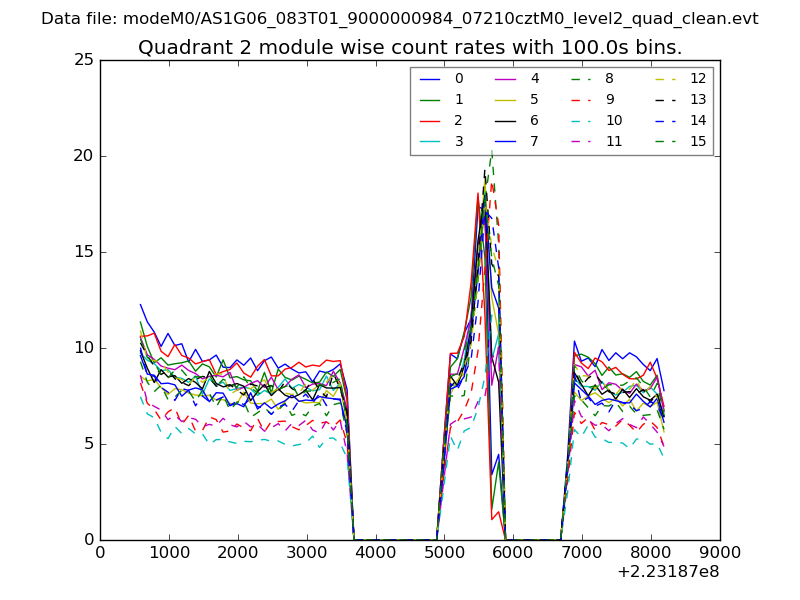
| Module-wise count rates for Quadrant B Data is divided into 100 sec bins |
 |
 |
| Module-wise count rates for Quadrant C Data is divided into 100 sec bins |
 |
 |
| Module-wise count rates for Quadrant D Data is divided into 100 sec bins |
 |
 |
| Parameter | Plot |
|---|---|
| CZT HV Monitor | 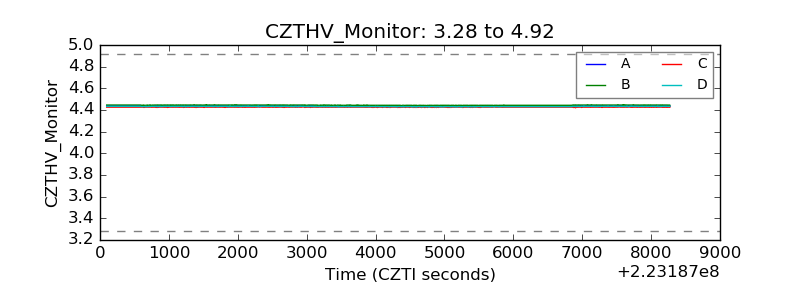 |
| D_VDD | 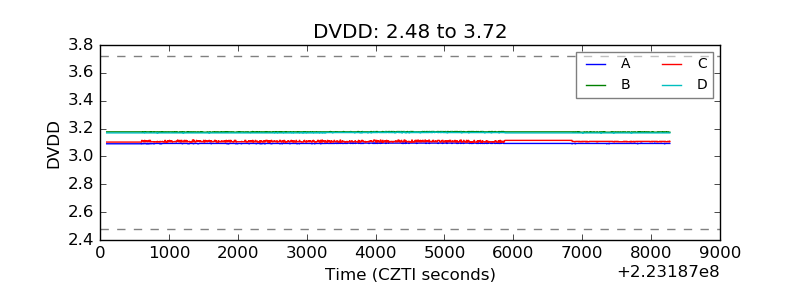 |
| Temperature 1 | 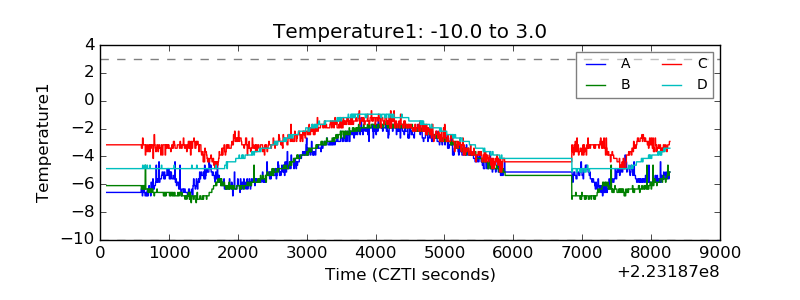 |
| Veto HV Monitor | 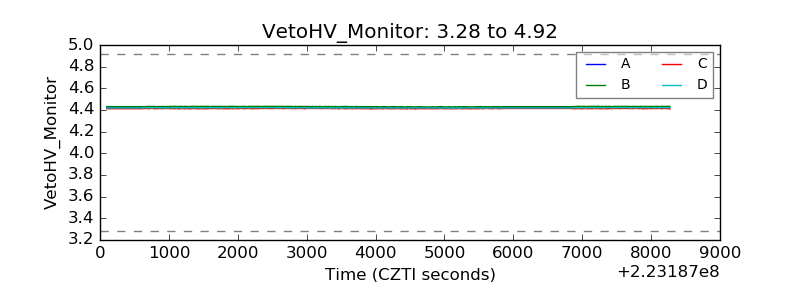 |
| Veto LLD | 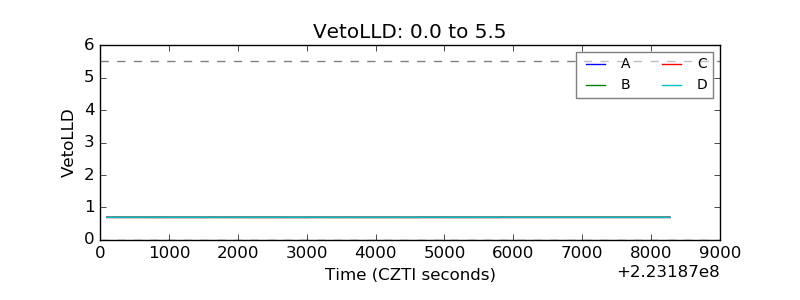 |
| Alpha Counter | 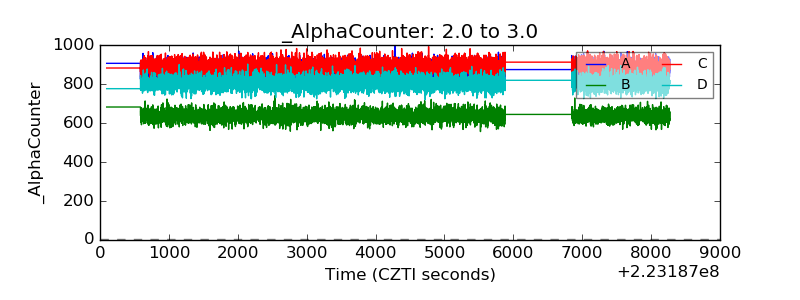 |
| _CPM_Rate | 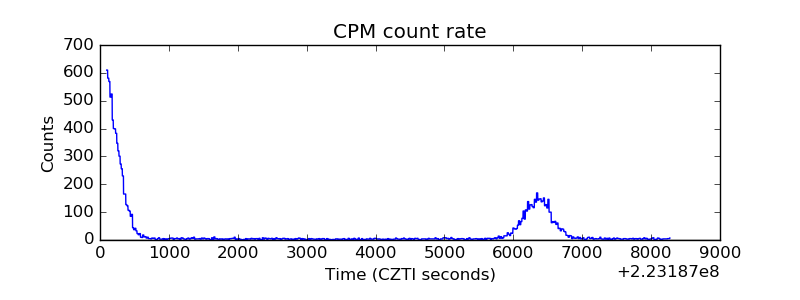 |
| CZT Counter | 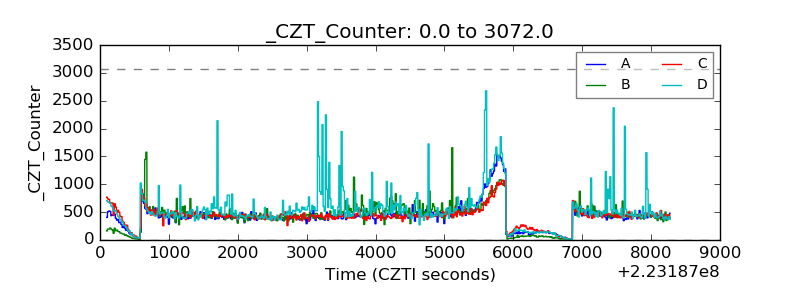 |
| +2.5 Volts monitor | 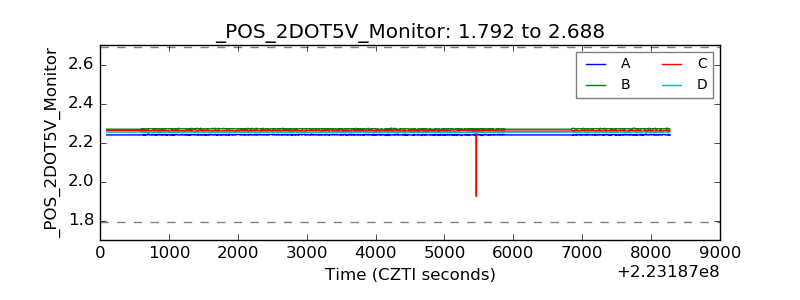 |
| +5 Volts monitor |  |
| _ROLL_ROT | 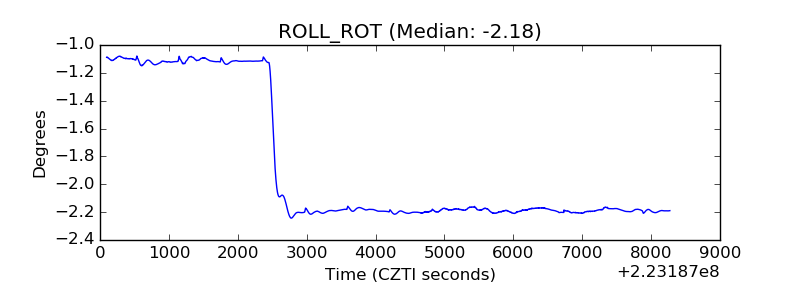 |
| _Roll_DEC | 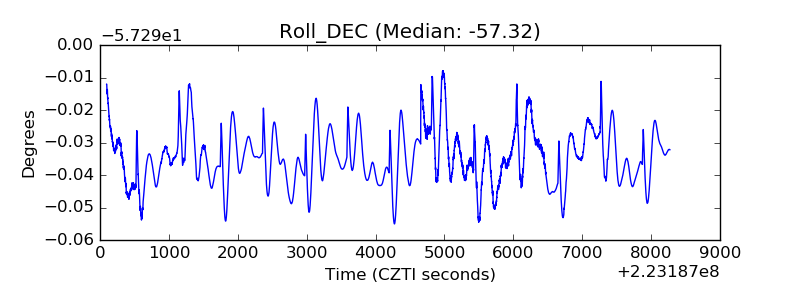 |
| _Roll_RA | 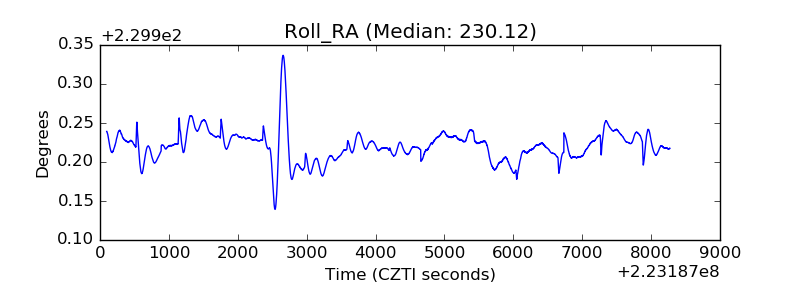 |
| Veto Counter | 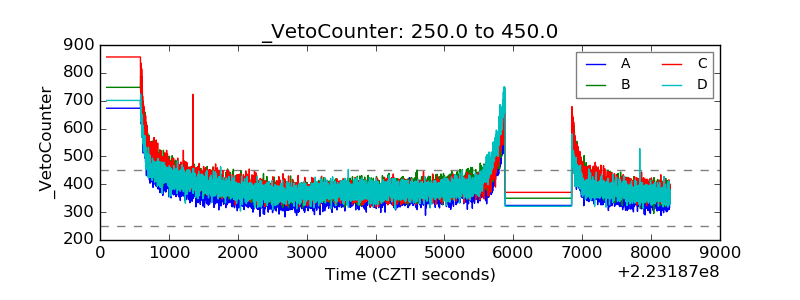 |