| Param | Original file | Final file |
|---|---|---|
| Filename | modeM0/AS1G06_083T01_9000000984_07216cztM0_level2.evt | modeM0/AS1G06_083T01_9000000984_07216cztM0_level2_quad_clean.evt |
| Size (bytes) | 466,289,280 | 93,280,320 |
| Size | 444.7 MB | 89.0 MB |
| Events in quadrant A | 2,869,827 | 603,080 |
| Events in quadrant B | 3,972,551 | 612,210 |
| Events in quadrant C | 3,117,353 | 598,675 |
| Events in quadrant D | 3,728,878 | 566,313 |
| Mode SS | |||
|---|---|---|---|
| Quadrant | BADHDUFLAG | Total packets | Discarded packets |
| A | 0 | 128 | 0 |
| B | 0 | 128 | 0 |
| C | 0 | 128 | 0 |
| D | 0 | 128 | 0 |
| Mode M0 | |||
|---|---|---|---|
| Quadrant | BADHDUFLAG | Total packets | Discarded packets |
| A | 0 | 13160 | 1 |
| B | 0 | 16054 | 0 |
| C | 0 | 13880 | 0 |
| D | 0 | 15304 | 0 |
| Quadrant | Total seconds | Saturated seconds | Saturation percentage |
|---|---|---|---|
| A | 6364 | 231 | 3.629793% |
| B | 6364 | 522 | 8.202388% |
| C | 6364 | 195 | 3.064111% |
| D | 6364 | 242 | 3.802640% |
Noise dominated data is calculated using 1-second bins in cleaned event files. If a bin has >2000 counts, and if more than 50% of those come from <1% of pixels, then it is considered to be noise-dominated and hence unusable.
| Quadrant | # 1 sec bins | Bins with >0 counts | Bins with >2000 counts | High rate bins dominated by noise | Noise dominated (total time) | Noise dominated (detector-on time) | Marked lightcurve |
|---|---|---|---|---|---|---|---|
| A | 6364 | 6364 | 1 | 1 | 0.02% | 0.02% | 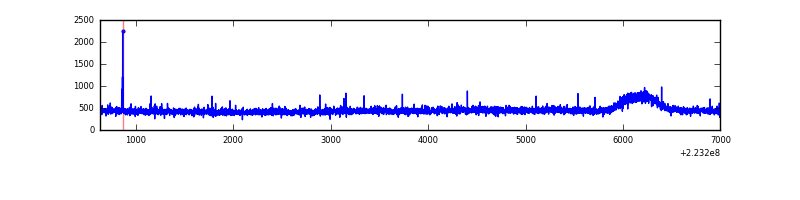 |
| B | 6364 | 6364 | 244 | 244 | 3.83% | 3.83% | 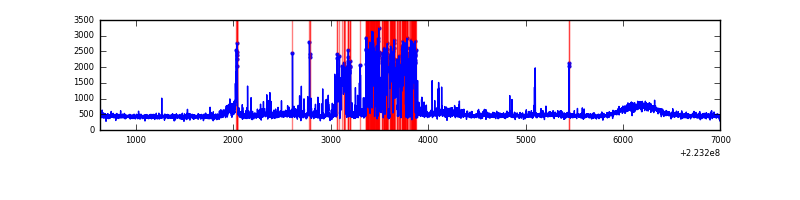 |
| C | 6364 | 6364 | 29 | 29 | 0.46% | 0.46% | 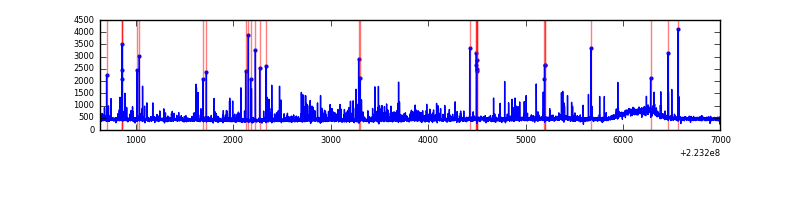 |
| D | 6364 | 6364 | 52 | 52 | 0.82% | 0.82% | 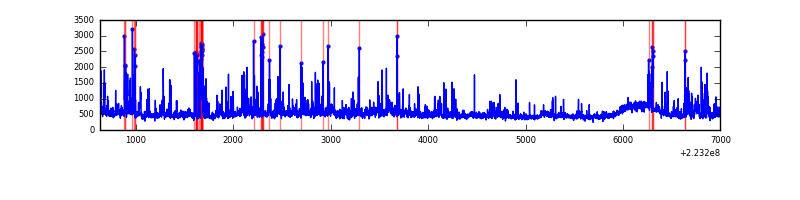 |
Top three noisy pixels from each quadrant. If the there are fewer than three noisy pixels in the level2.evt file, extra rows are filled as -1
| Pixel properties | Quadrant properties | ||||||
|---|---|---|---|---|---|---|---|
| Quadrant | DetID | PixID | Counts | Sigma | Mean | Median | Sigma |
| A | 0 | 226 | 7222 | 42.97 | 738 | 720 | 151.3 |
| A | 12 | 194 | 6679 | 39.38 | 738 | 720 | 151.3 |
| A | 15 | 174 | 6270 | 36.68 | 738 | 720 | 151.3 |
| B | 10 | 16 | 892651 | 6270.65 | 740 | 720 | 142.2 |
| B | 0 | 214 | 106111 | 740.94 | 740 | 720 | 142.2 |
| B | 0 | 228 | 32757 | 225.23 | 740 | 720 | 142.2 |
| C | 9 | 243 | 264766 | 1576.29 | 725 | 724 | 167.5 |
| C | 9 | 68 | 11086 | 61.86 | 725 | 724 | 167.5 |
| C | 13 | 61 | 5573 | 28.95 | 725 | 724 | 167.5 |
| D | 2 | 216 | 365343 | 2068.34 | 719 | 694 | 176.3 |
| D | 8 | 195 | 168148 | 949.82 | 719 | 694 | 176.3 |
| D | 2 | 14 | 153064 | 864.26 | 719 | 694 | 176.3 |
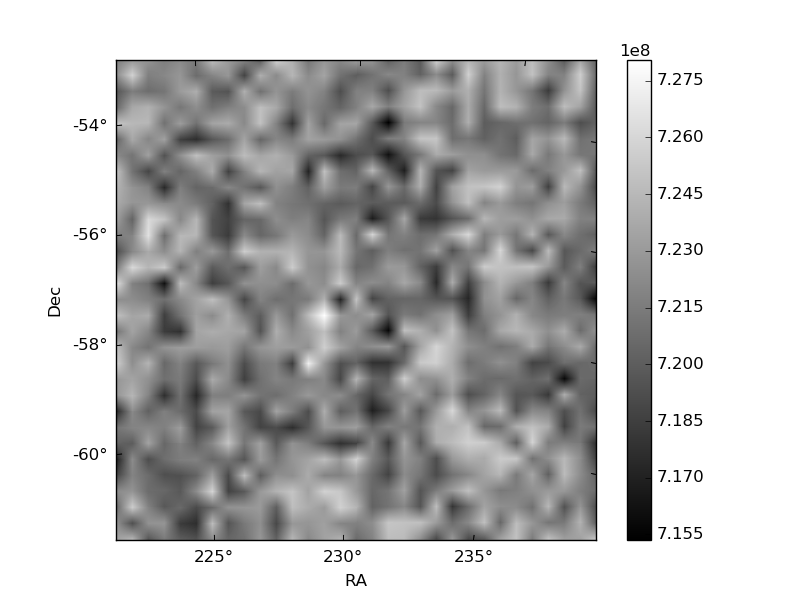
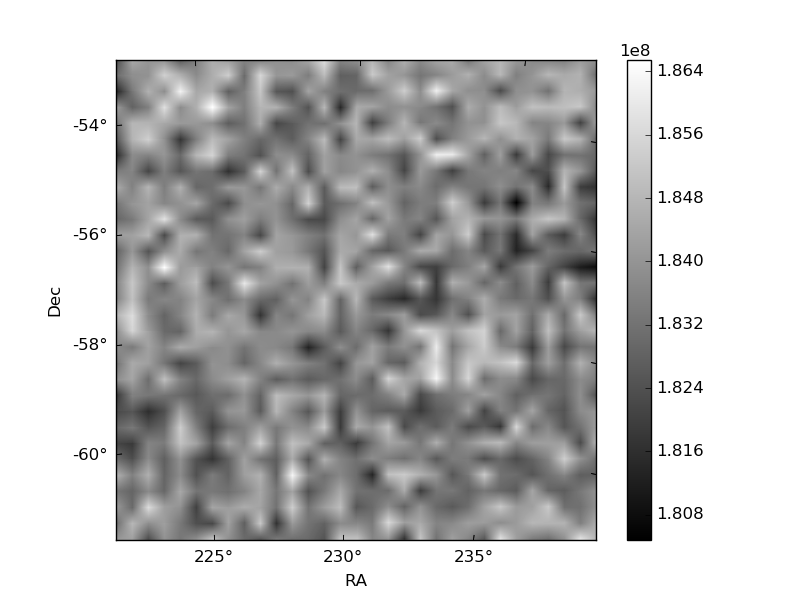
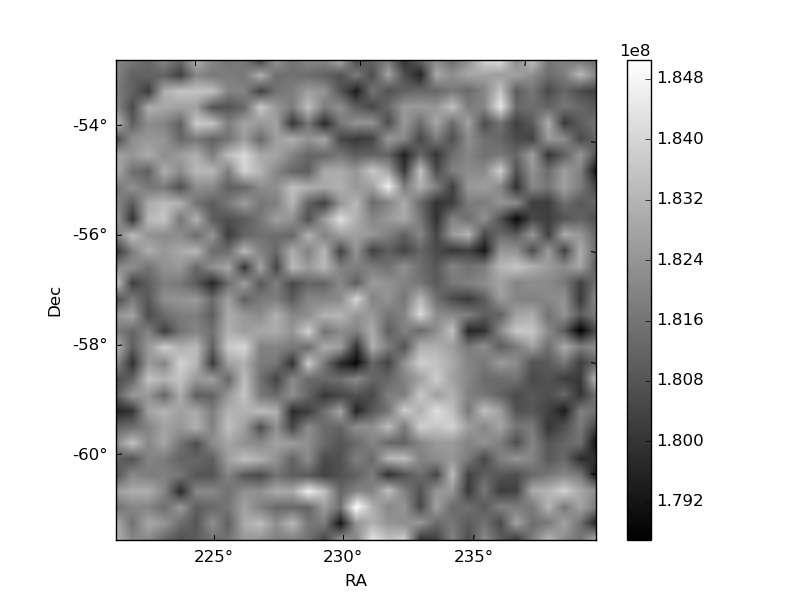
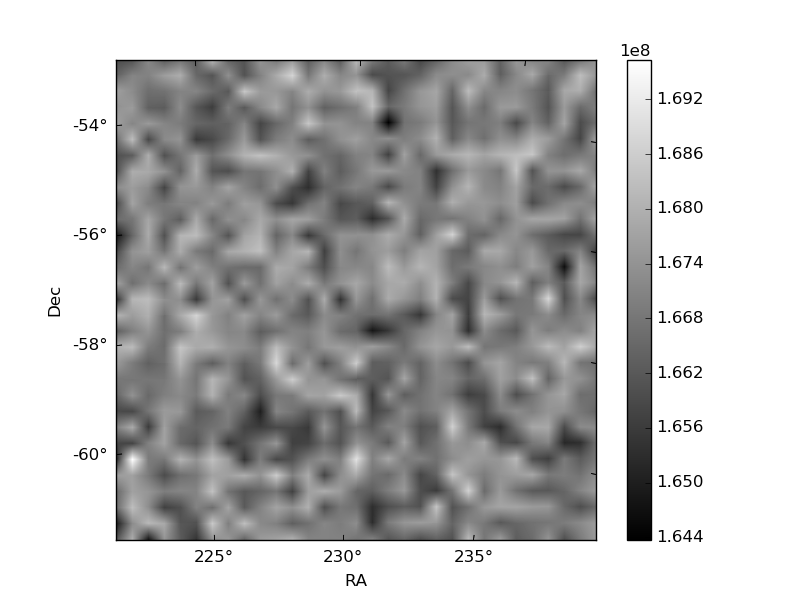
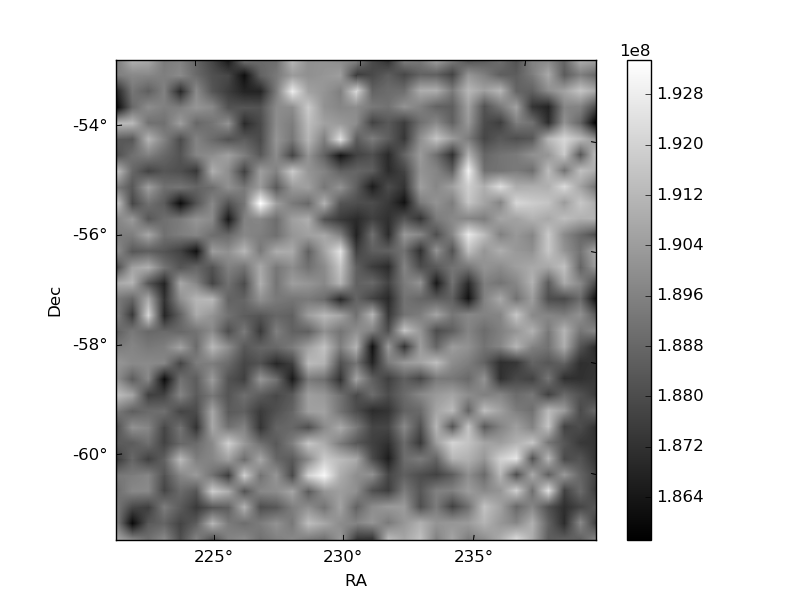
Histogram calculated using DETX and DETY for each event in the final _common_clean file
| Quadrant A | 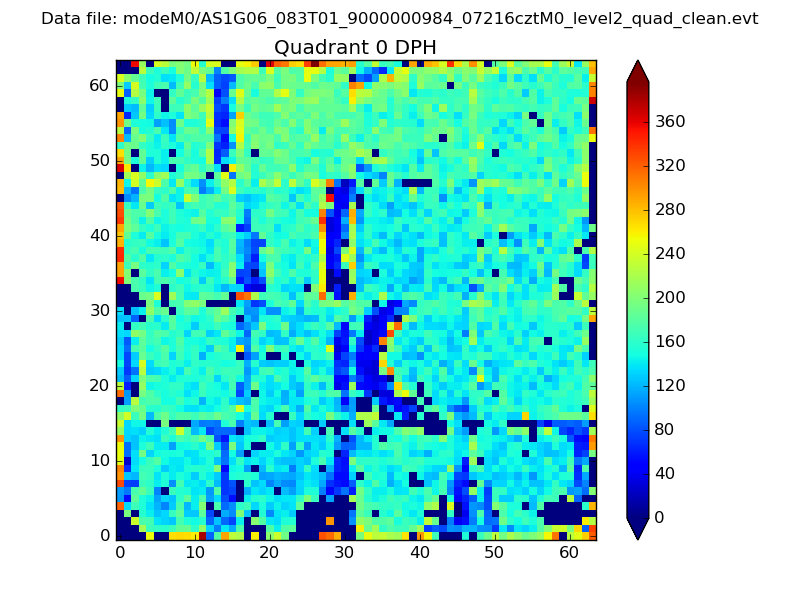 |
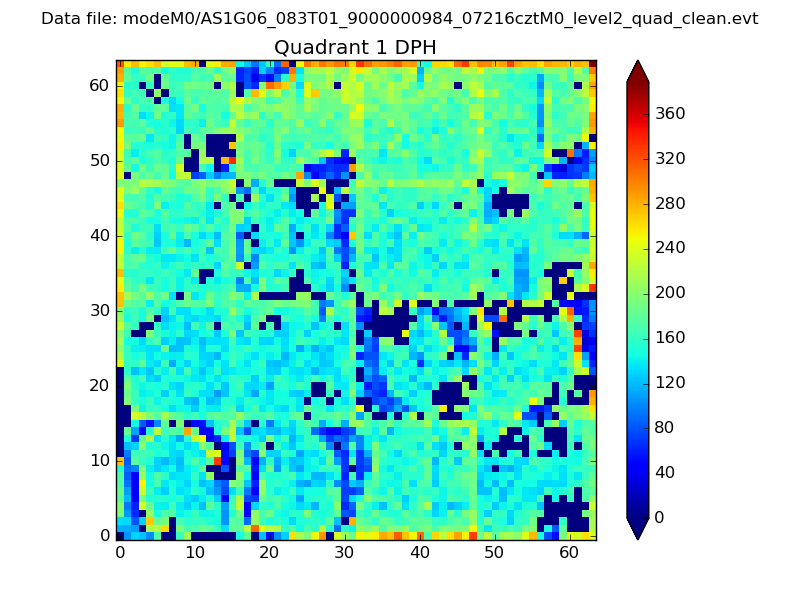 |
Quadrant B |
|---|---|---|---|
| Quadrant D | 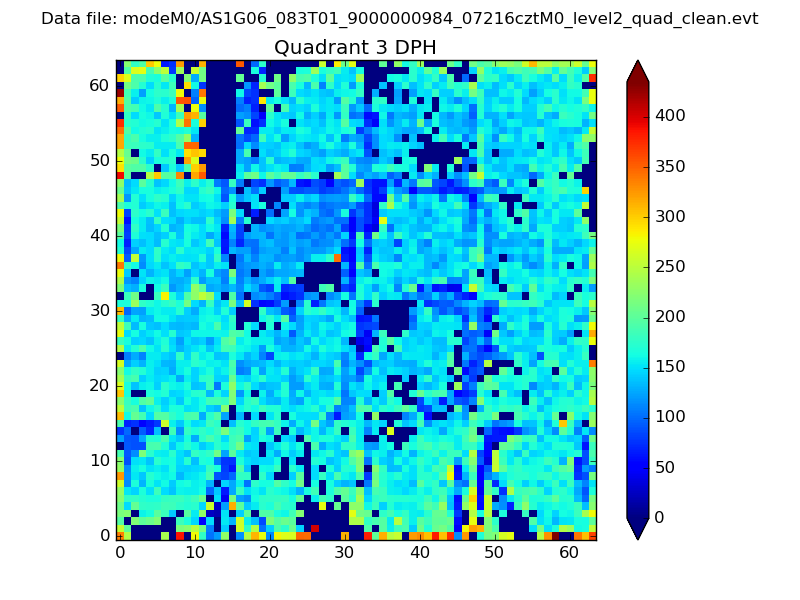 |
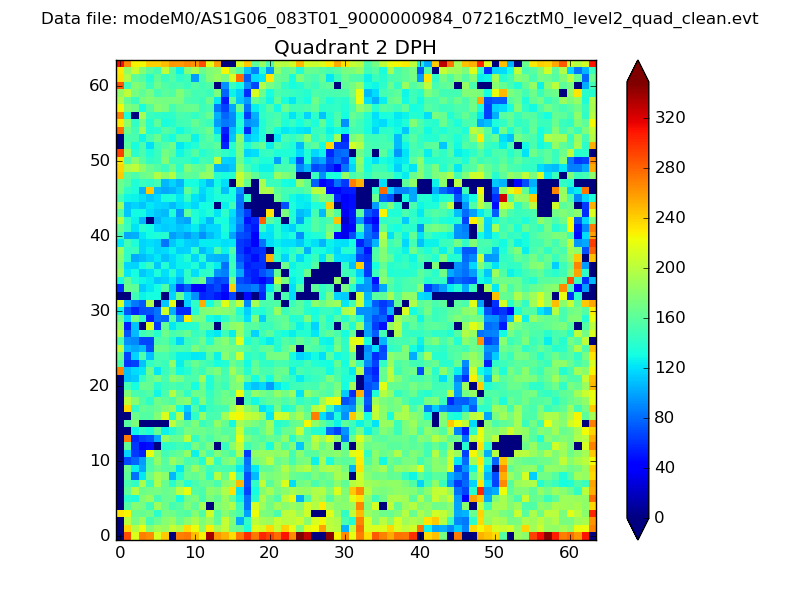 |
Quadrant C |
| Plot type | Count rate plots | Images |
|---|---|---|
| Comparison with Poisson distribution Blue bars denote a histogram of data divided into 1 sec bins. Red curve is a Poisson curve with rate = median count rate of data. |
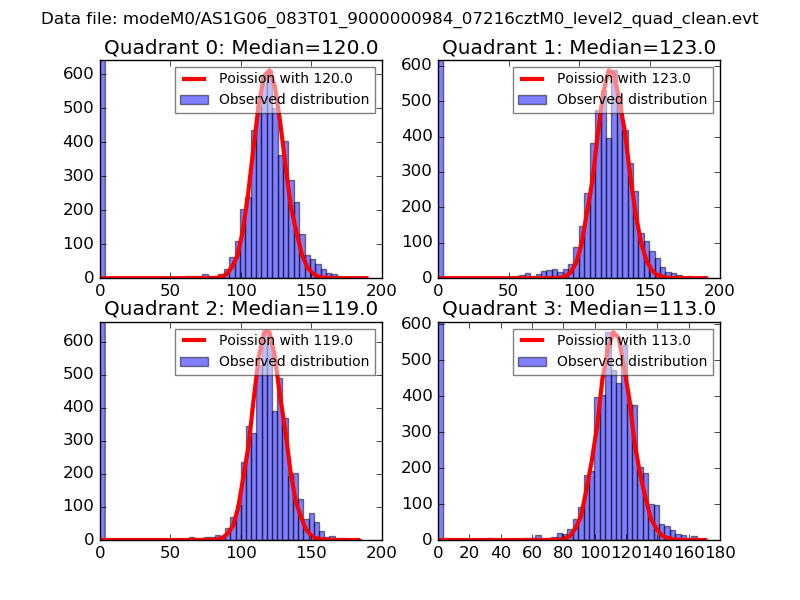 |
 |
| Quadrant-wise count rates Data is divided into 100 sec bins |
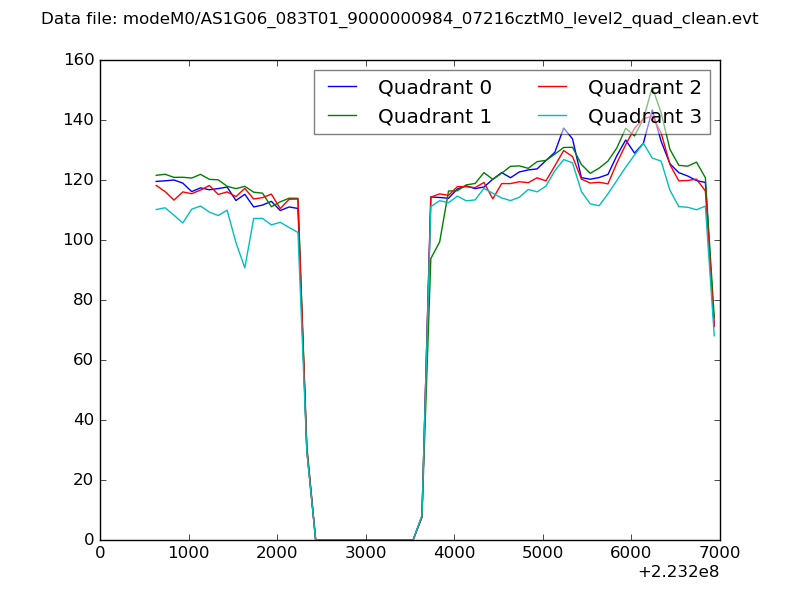 |
|
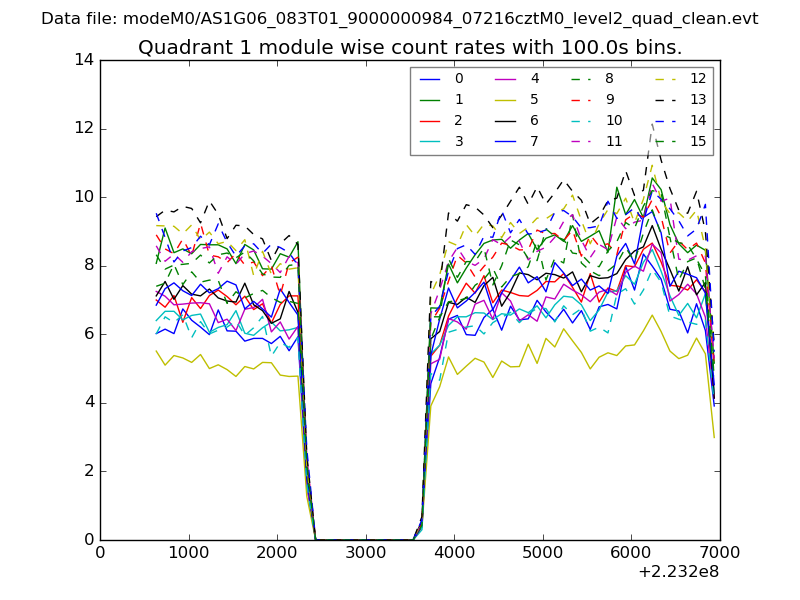
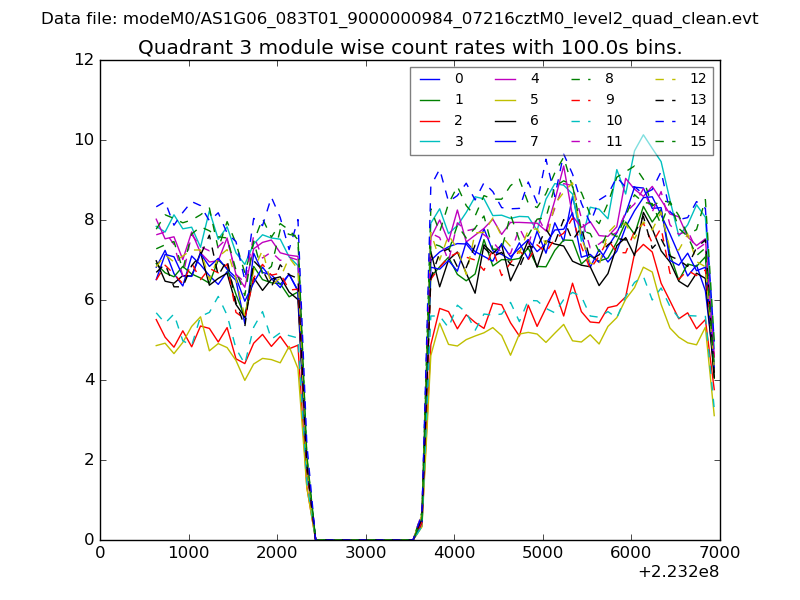
| Module-wise count rates for Quadrant A Data is divided into 100 sec bins |
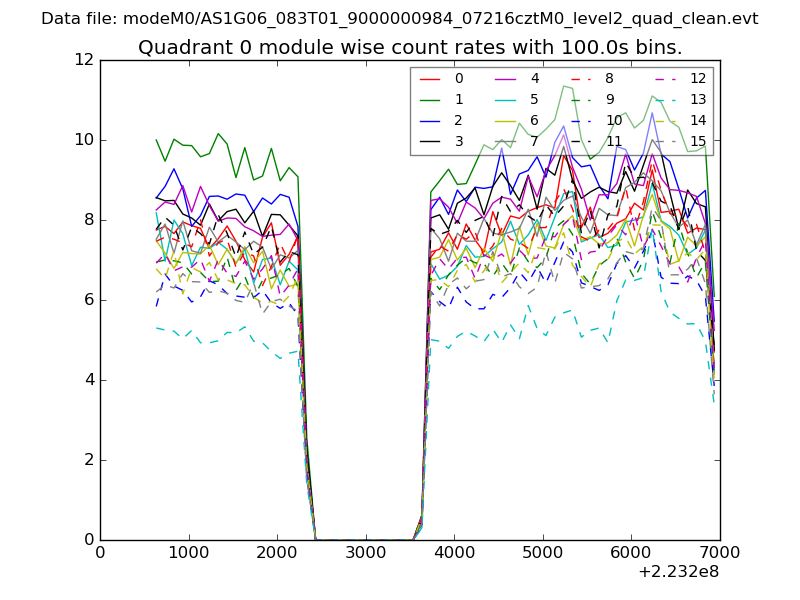 |
 |
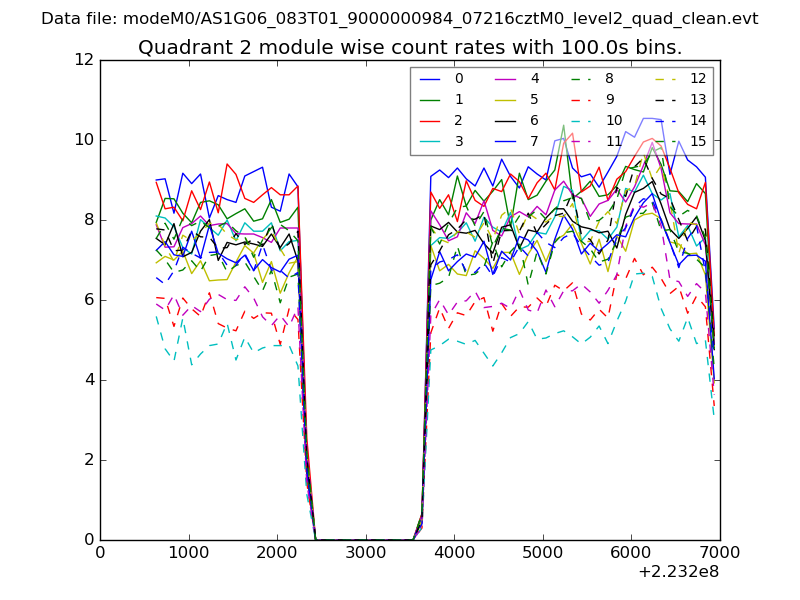
| Module-wise count rates for Quadrant B Data is divided into 100 sec bins |
 |
 |
| Module-wise count rates for Quadrant C Data is divided into 100 sec bins |
 |
 |
| Module-wise count rates for Quadrant D Data is divided into 100 sec bins |
 |
 |
| Parameter | Plot |
|---|---|
| CZT HV Monitor | 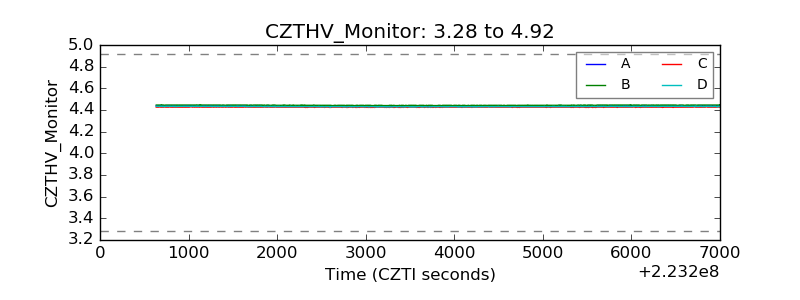 |
| D_VDD | 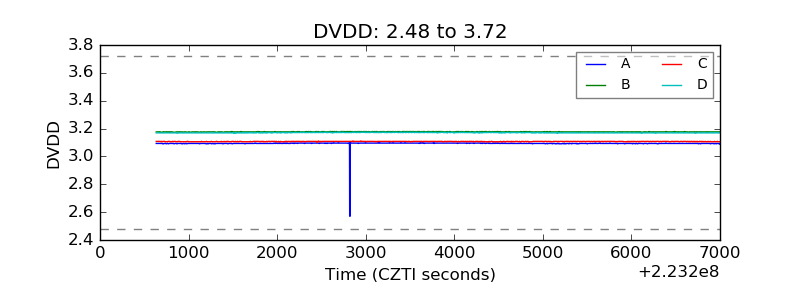 |
| Temperature 1 | 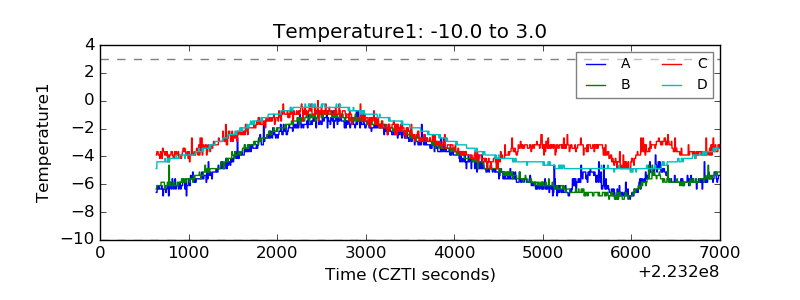 |
| Veto HV Monitor |  |
| Veto LLD | 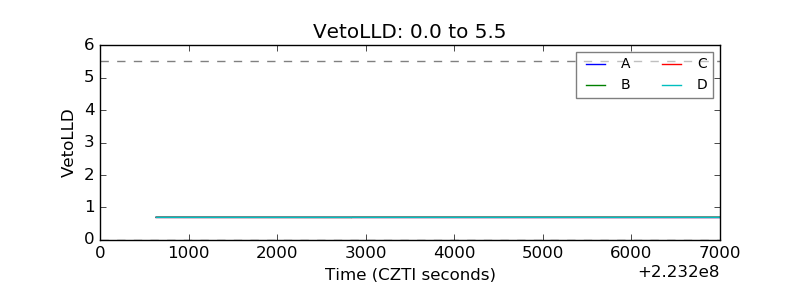 |
| Alpha Counter | 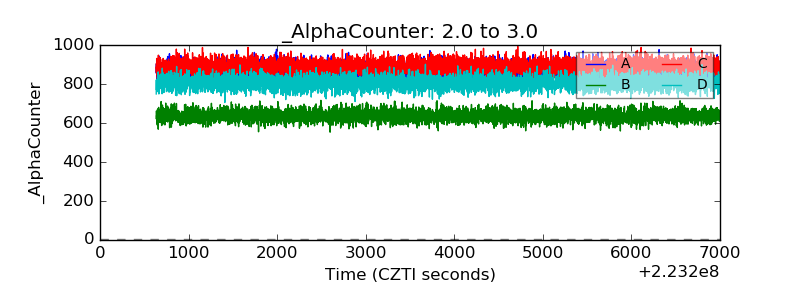 |
| _CPM_Rate | 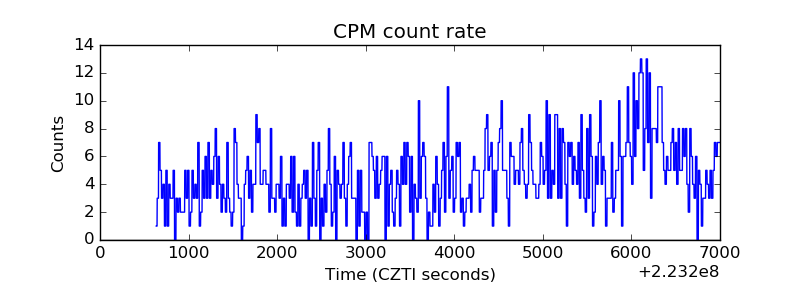 |
| CZT Counter | 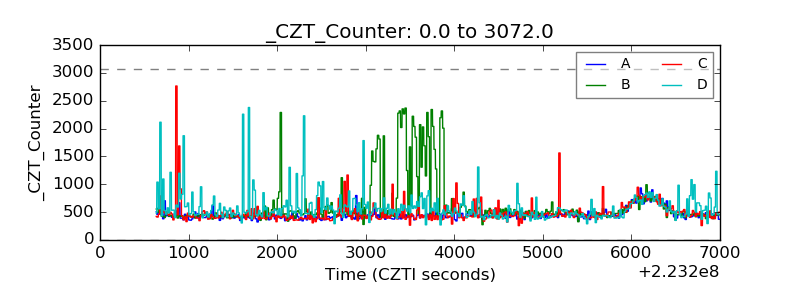 |
| +2.5 Volts monitor |  |
| +5 Volts monitor |  |
| _ROLL_ROT | 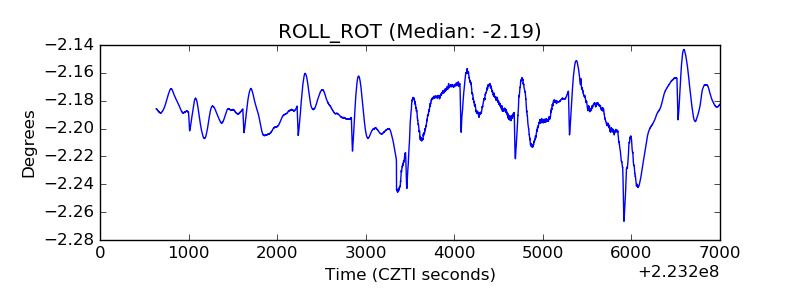 |
| _Roll_DEC | 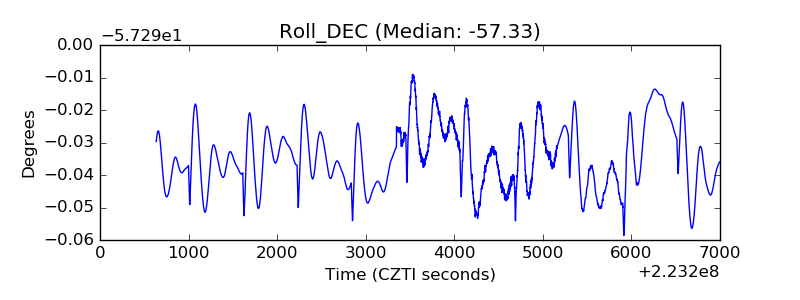 |
| _Roll_RA | 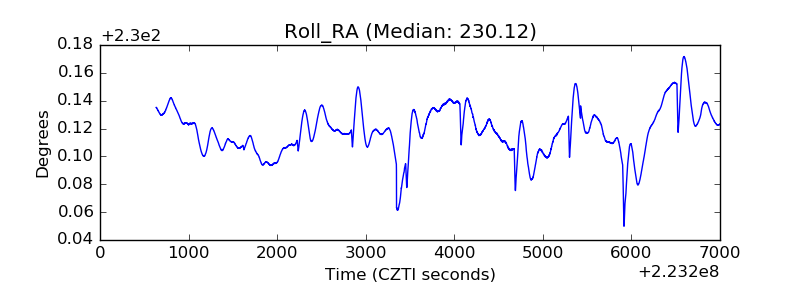 |
| Veto Counter | 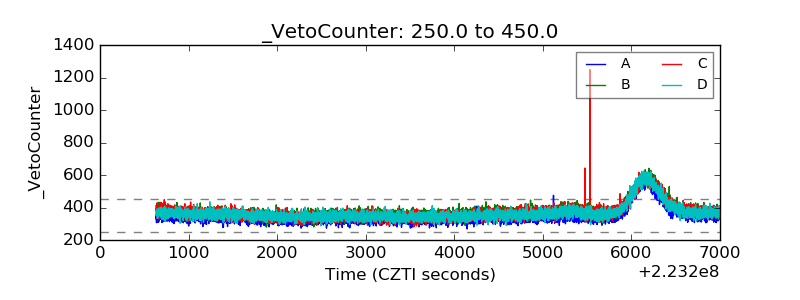 |