| Param | Original file | Final file |
|---|---|---|
| Filename | modeM0/AS1A02_111T01_9000000986cztM0_level2.fits | modeM0/AS1A02_111T01_9000000986cztM0_level2_quad_clean.evt |
| Size (bytes) | 240,145,920 | 238,144,320 |
| Size | 229.0 MB | 227.1 MB |
| Events in quadrant A | 1,443,236 | 1,430,154 |
| Events in quadrant B | 1,412,868 | 1,447,559 |
| Events in quadrant C | 1,433,482 | 1,353,653 |
| Events in quadrant D | 1,212,078 | 1,209,065 |
| Mode SS | |||
|---|---|---|---|
| Quadrant | BADHDUFLAG | Total packets | Discarded packets |
| A | 0 | 526 | 0 |
| B | 0 | 526 | 0 |
| C | 0 | 526 | 0 |
| D | 0 | 526 | 0 |
| Mode M0 | |||
|---|---|---|---|
| Quadrant | BADHDUFLAG | Total packets | Discarded packets |
| A | 0 | 54613 | 0 |
| B | 0 | 56080 | 0 |
| C | 0 | 53135 | 0 |
| D | 0 | 62698 | 0 |
| Mode M9 | |||
|---|---|---|---|
| Quadrant | BADHDUFLAG | Total packets | Discarded packets |
| A | 0 | 68 | 0 |
| B | 0 | 68 | 0 |
| C | 0 | 68 | 0 |
| D | 0 | 68 | 0 |
| Quadrant | Total seconds | Saturated seconds | Saturation percentage |
|---|---|---|---|
| A | 25756 | 181 | 0.702749% |
| B | 25756 | 279 | 1.083243% |
| C | 25756 | 87 | 0.337785% |
| D | 25756 | 749 | 2.908060% |
Noise dominated data is calculated using 1-second bins in cleaned event files. If a bin has >2000 counts, and if more than 50% of those come from <1% of pixels, then it is considered to be noise-dominated and hence unusable.
| Quadrant | # 1 sec bins | Bins with >0 counts | Bins with >2000 counts | High rate bins dominated by noise | Noise dominated (total time) | Noise dominated (detector-on time) | Marked lightcurve |
|---|---|---|---|---|---|---|---|
| A | 32471 | 25753 | 0 | 0 | 0.00% | 0.00% | 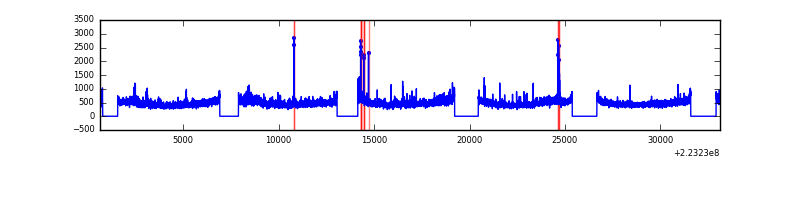 |
| B | 32471 | 25752 | 0 | 0 | 0.00% | 0.00% | 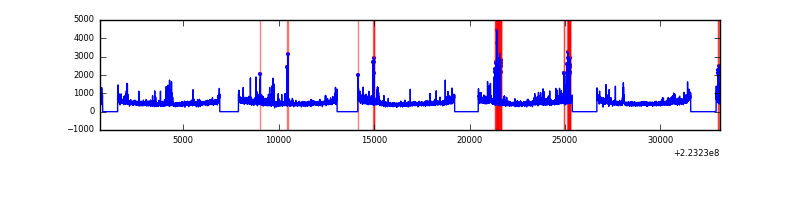 |
| C | 32471 | 25753 | 0 | 0 | 0.00% | 0.00% | 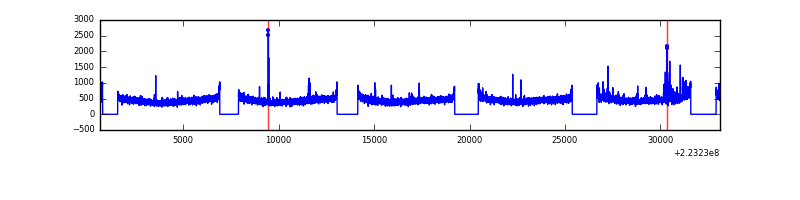 |
| D | 32471 | 25743 | 0 | 0 | 0.00% | 0.00% |  |
Top three noisy pixels from each quadrant. If the there are fewer than three noisy pixels in the level2.evt file, extra rows are filled as -1
| Pixel properties | Quadrant properties | ||||||
|---|---|---|---|---|---|---|---|
| Quadrant | DetID | PixID | Counts | Sigma | Mean | Median | Sigma |
| A | 0 | 29 | 1436 | 11.1 | 375 | 351 | 97.8 |
| A | 7 | 110 | 1205 | 8.74 | 375 | 351 | 97.8 |
| A | 0 | 30 | 1126 | 7.93 | 375 | 351 | 97.8 |
| B | 2 | 9 | 1211 | 11.24 | 371 | 354 | 76.2 |
| B | 12 | 226 | 1027 | 8.83 | 371 | 354 | 76.2 |
| B | 5 | 128 | 965 | 8.01 | 371 | 354 | 76.2 |
| C | 1 | 80 | 1062 | 7.06 | 378 | 352 | 100.6 |
| C | 12 | 241 | 1061 | 7.05 | 378 | 352 | 100.6 |
| C | 1 | 81 | 1041 | 6.85 | 378 | 352 | 100.6 |
| D | 6 | 231 | 918 | 6.37 | 346 | 314 | 94.8 |
| D | 3 | 14 | 896 | 6.14 | 346 | 314 | 94.8 |
| D | 7 | 5 | 854 | 5.7 | 346 | 314 | 94.8 |
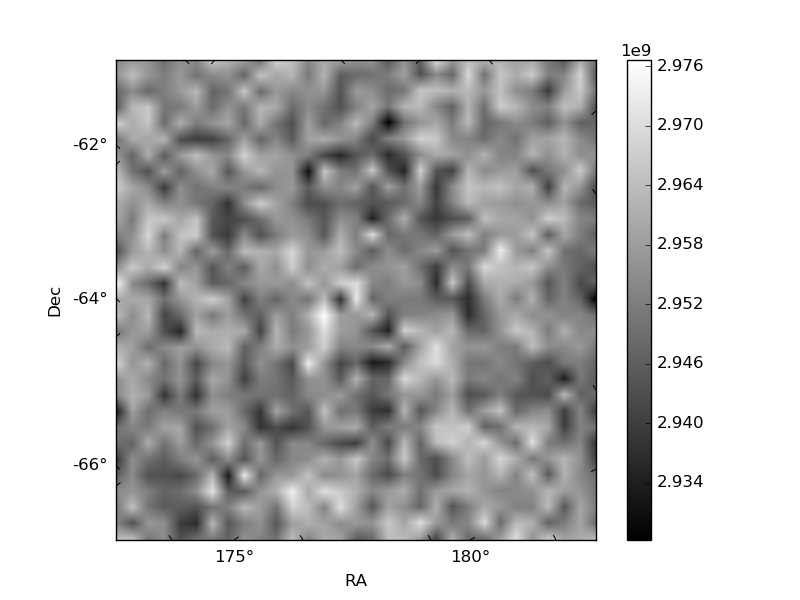
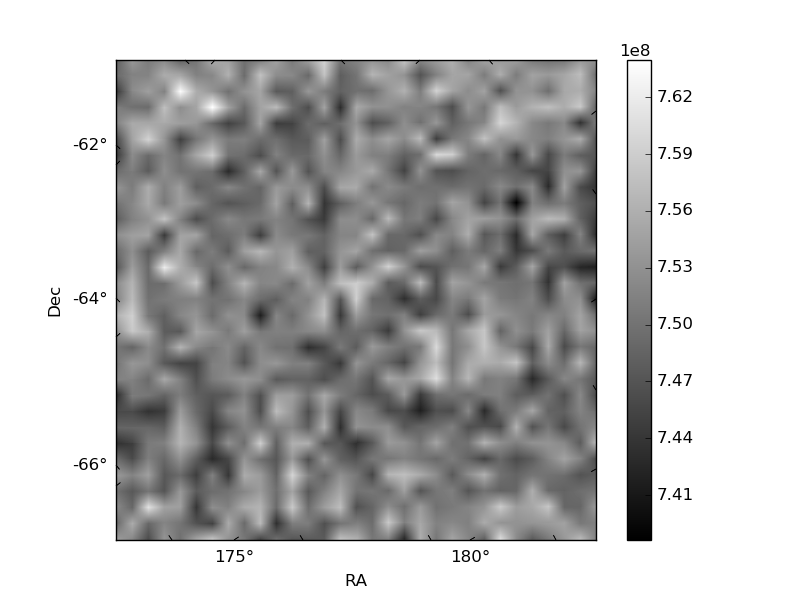
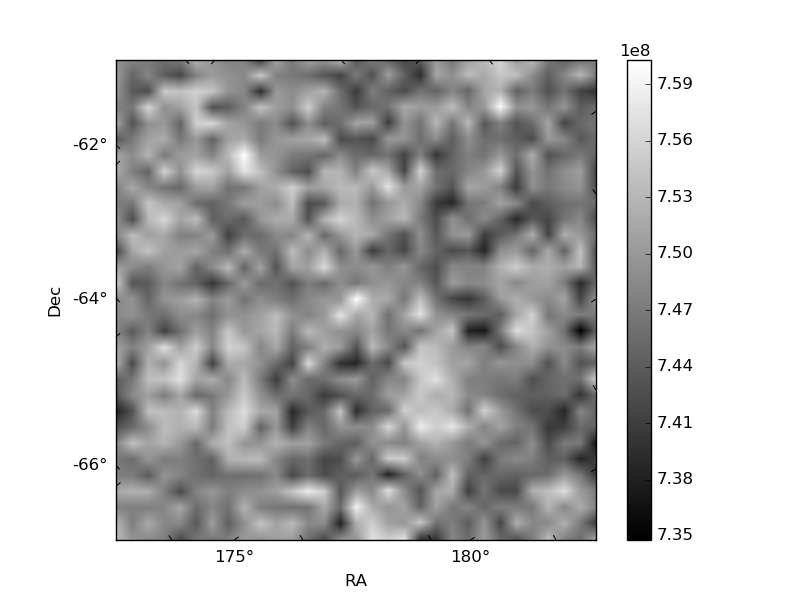
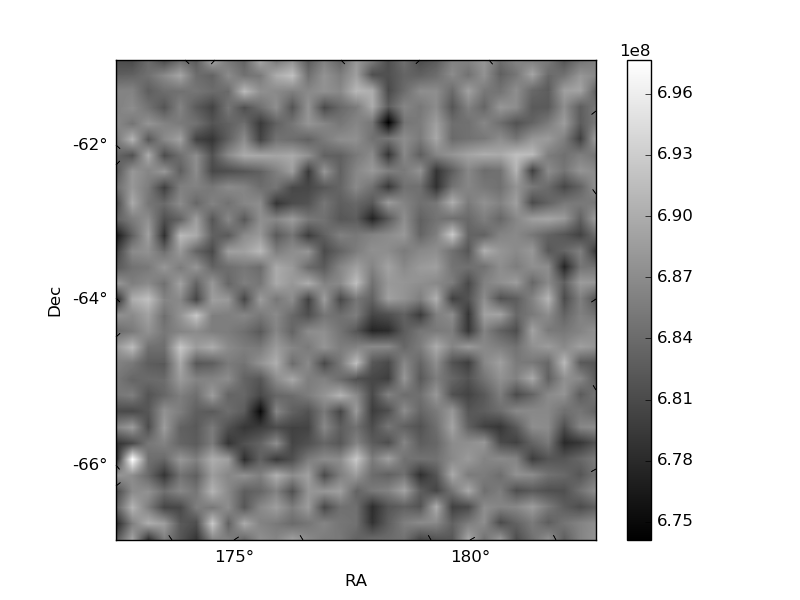
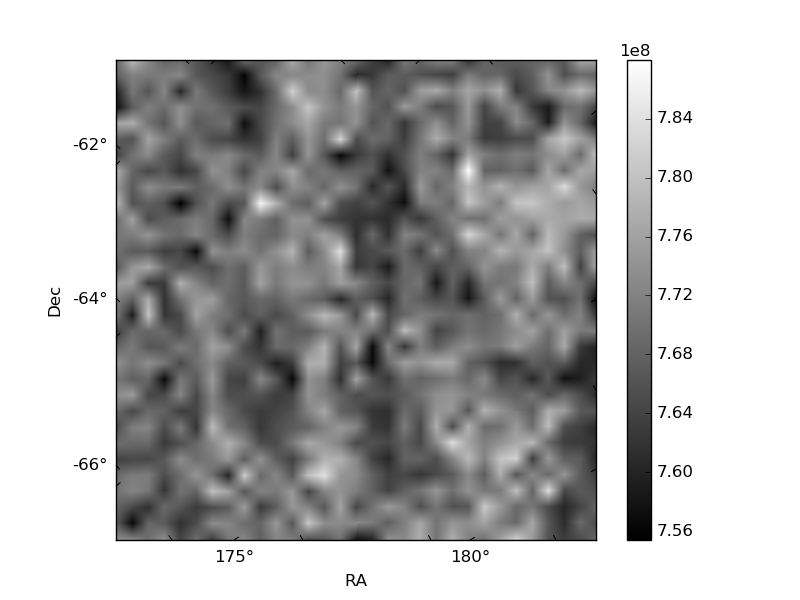
Histogram calculated using DETX and DETY for each event in the final _common_clean file
| Quadrant A | 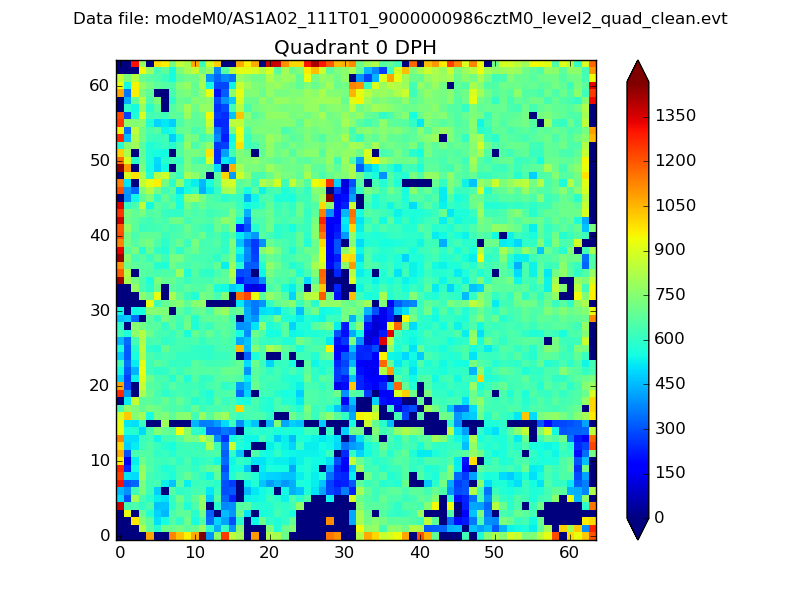 |
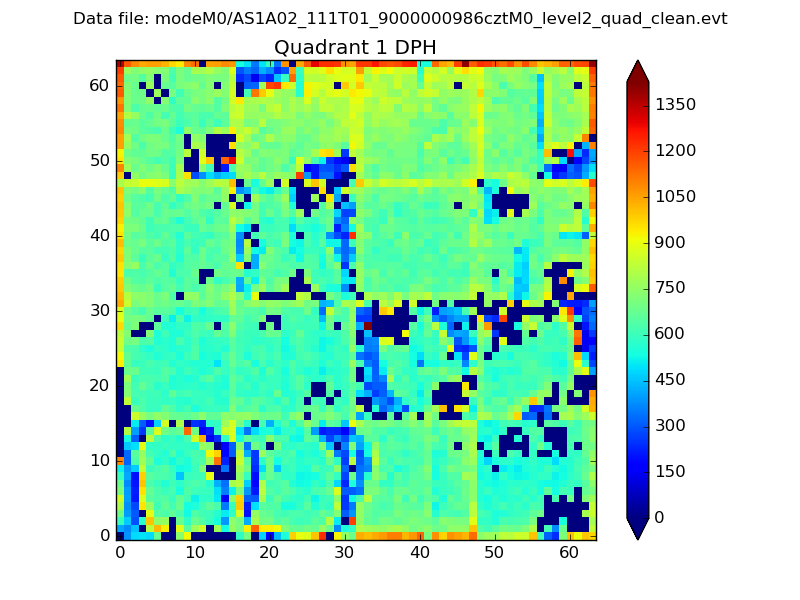 |
Quadrant B |
|---|---|---|---|
| Quadrant D | 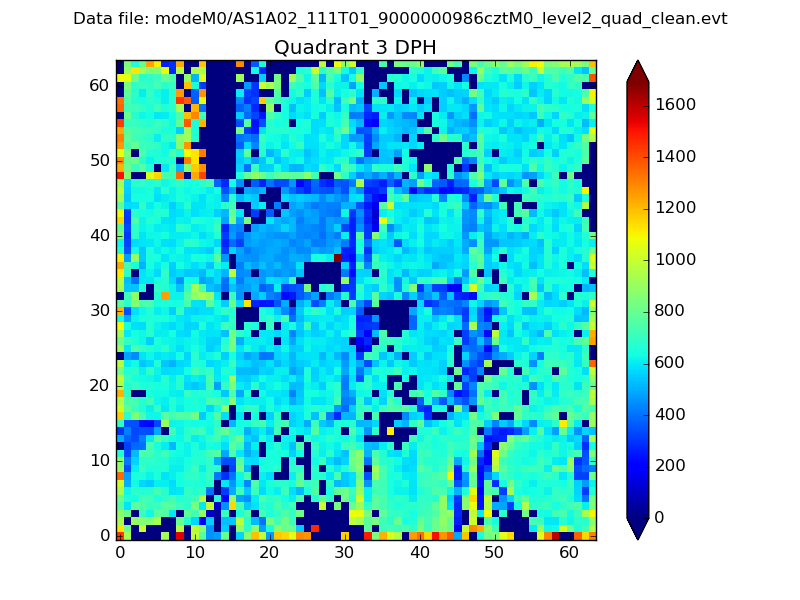 |
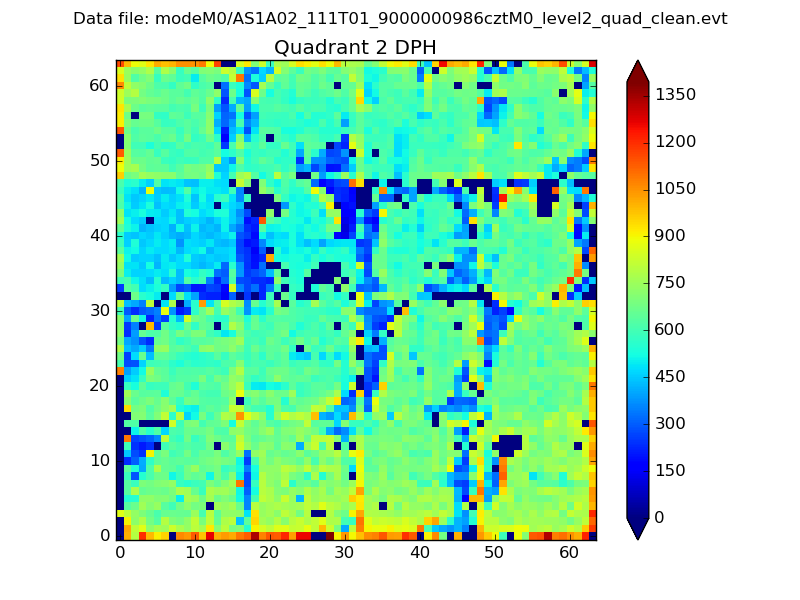 |
Quadrant C |
| Plot type | Count rate plots | Images |
|---|---|---|
| Comparison with Poisson distribution Blue bars denote a histogram of data divided into 1 sec bins. Red curve is a Poisson curve with rate = median count rate of data. |
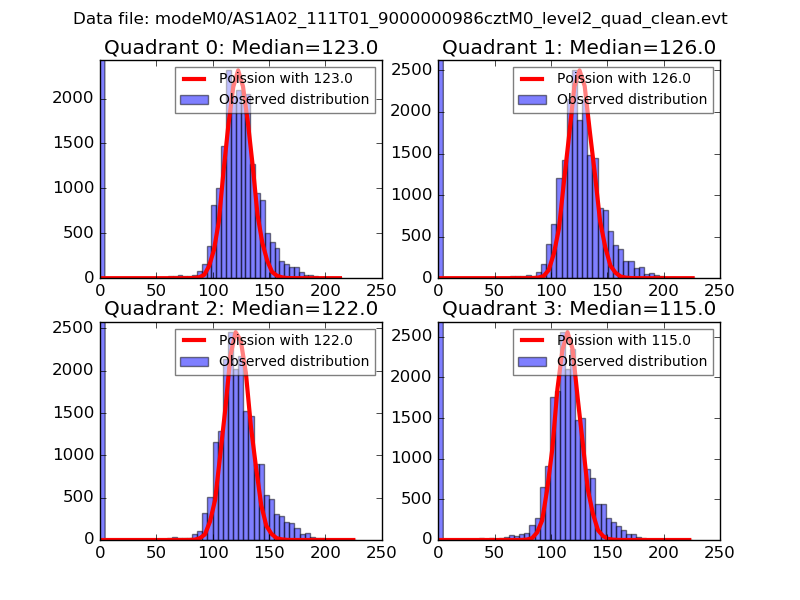 |
 |
| Quadrant-wise count rates Data is divided into 100 sec bins |
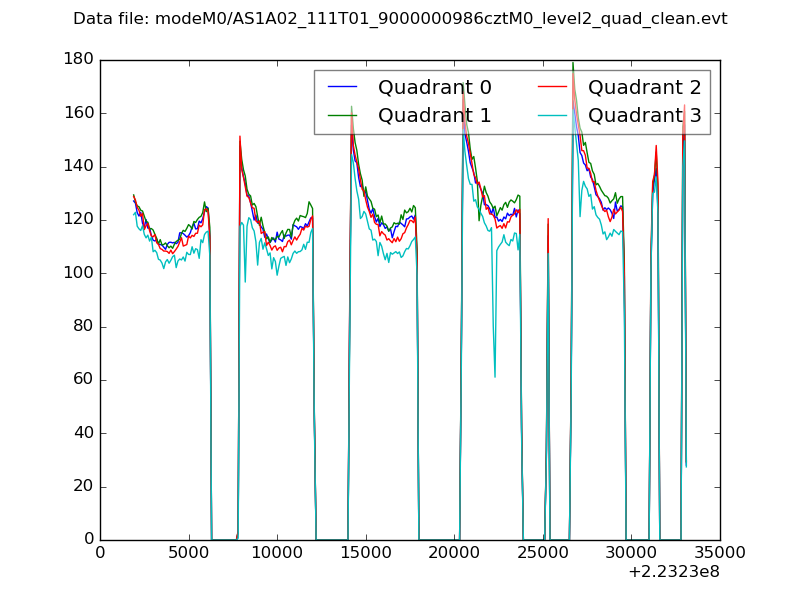 |
|
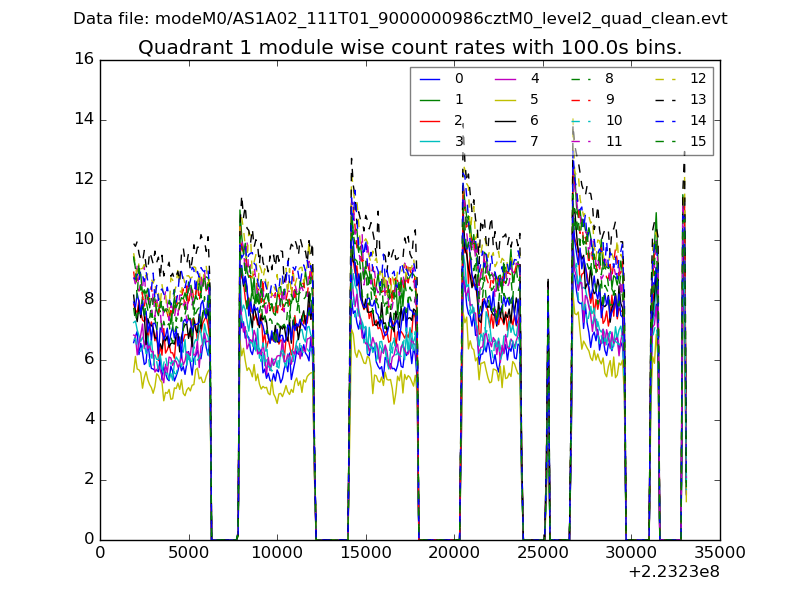
| Module-wise count rates for Quadrant A Data is divided into 100 sec bins |
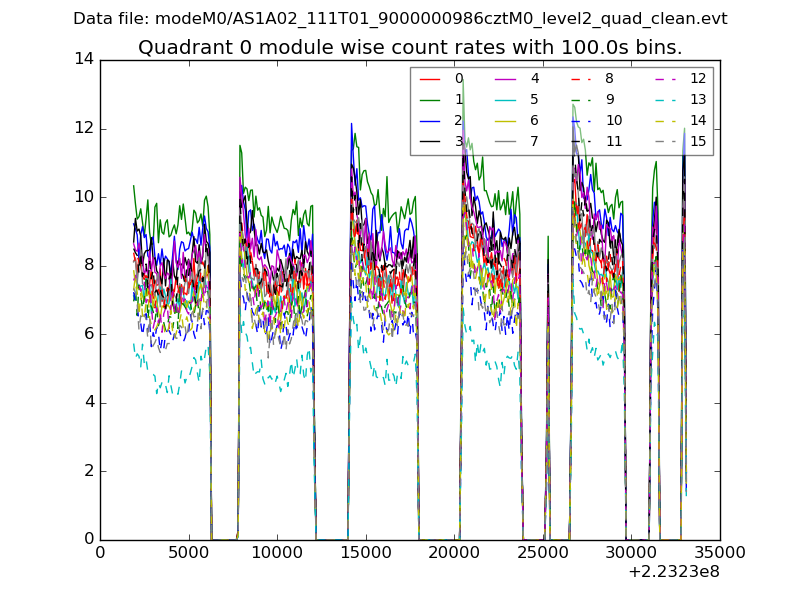 |
 |
| Module-wise count rates for Quadrant B Data is divided into 100 sec bins |
 |
 |
| Module-wise count rates for Quadrant C Data is divided into 100 sec bins |
 |
 |
| Module-wise count rates for Quadrant D Data is divided into 100 sec bins |
 |
 |
| Parameter | Plot |
|---|---|
| CZT HV Monitor | 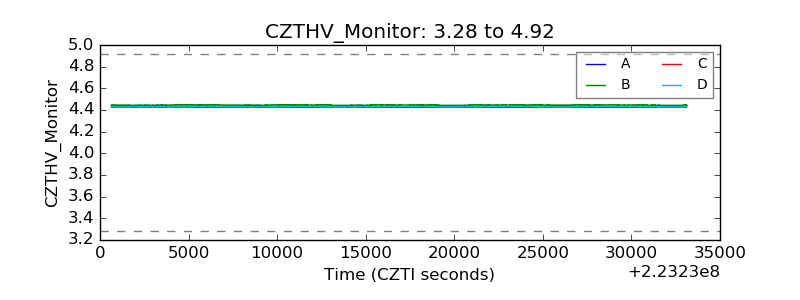 |
| D_VDD | 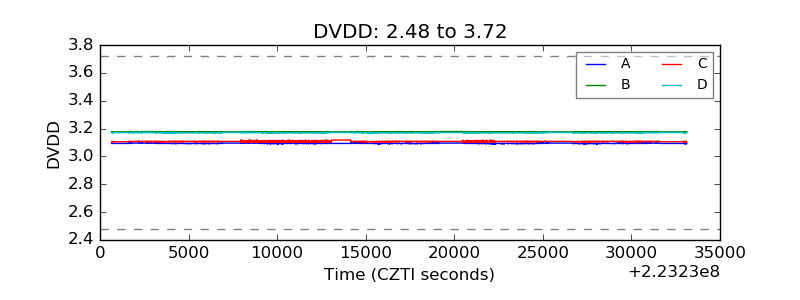 |
| Temperature 1 |  |
| Veto HV Monitor |  |
| Veto LLD | 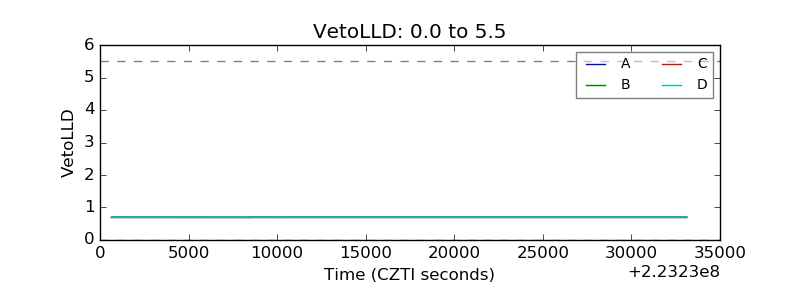 |
| Alpha Counter | 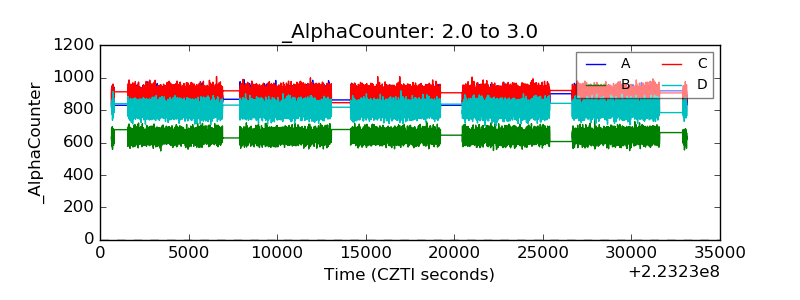 |
| _CPM_Rate |  |
| CZT Counter |  |
| +2.5 Volts monitor |  |
| +5 Volts monitor | 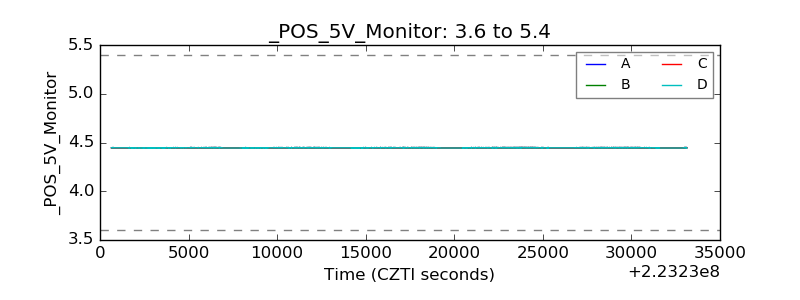 |
| _ROLL_ROT | 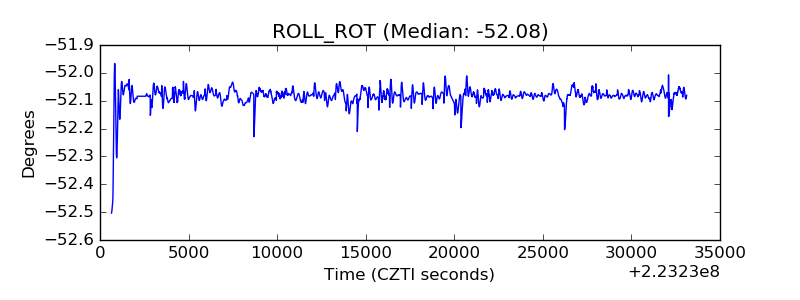 |
| _Roll_DEC | 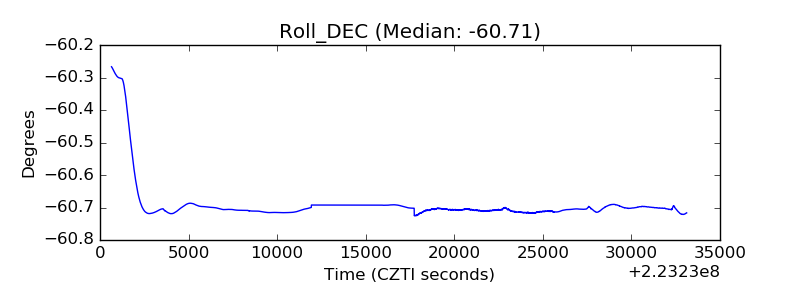 |
| _Roll_RA | 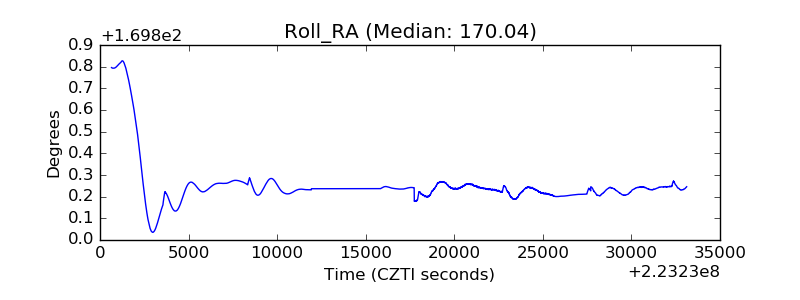 |
| Veto Counter |  |