| Param | Original file | Final file |
|---|---|---|
| Filename | modeM0/AS1A02_111T01_9000000986_07219cztM0_level2.evt | modeM0/AS1A02_111T01_9000000986_07219cztM0_level2_quad_clean.evt |
| Size (bytes) | 466,456,320 | 103,930,560 |
| Size | 444.8 MB | 99.1 MB |
| Events in quadrant A | 3,232,982 | 685,195 |
| Events in quadrant B | 3,305,869 | 699,666 |
| Events in quadrant C | 2,927,078 | 677,881 |
| Events in quadrant D | 4,221,112 | 633,422 |
| Mode SS | |||
|---|---|---|---|
| Quadrant | BADHDUFLAG | Total packets | Discarded packets |
| A | 0 | 130 | 0 |
| B | 0 | 130 | 0 |
| C | 0 | 130 | 0 |
| D | 0 | 130 | 0 |
| Mode M0 | |||
|---|---|---|---|
| Quadrant | BADHDUFLAG | Total packets | Discarded packets |
| A | 0 | 13855 | 3 |
| B | 0 | 14231 | 2 |
| C | 0 | 13249 | 2 |
| D | 0 | 17385 | 2 |
| Mode M9 | |||
|---|---|---|---|
| Quadrant | BADHDUFLAG | Total packets | Discarded packets |
| A | 0 | 13 | 0 |
| B | 0 | 13 | 0 |
| C | 0 | 13 | 0 |
| D | 0 | 14 | 0 |
| Quadrant | Total seconds | Saturated seconds | Saturation percentage |
|---|---|---|---|
| A | 6475 | 43 | 0.664093% |
| B | 6475 | 53 | 0.818533% |
| C | 6475 | 19 | 0.293436% |
| D | 6475 | 330 | 5.096525% |
Noise dominated data is calculated using 1-second bins in cleaned event files. If a bin has >2000 counts, and if more than 50% of those come from <1% of pixels, then it is considered to be noise-dominated and hence unusable.
| Quadrant | # 1 sec bins | Bins with >0 counts | Bins with >2000 counts | High rate bins dominated by noise | Noise dominated (total time) | Noise dominated (detector-on time) | Marked lightcurve |
|---|---|---|---|---|---|---|---|
| A | 7560 | 6475 | 10 | 10 | 0.13% | 0.15% | 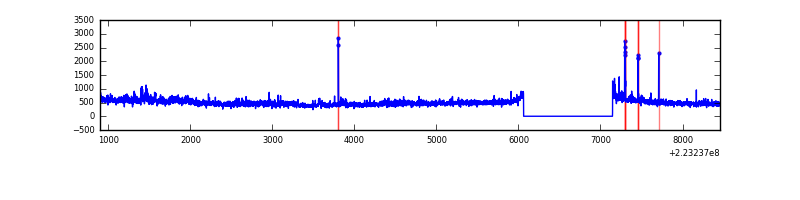 |
| B | 7560 | 6475 | 8 | 8 | 0.11% | 0.12% | 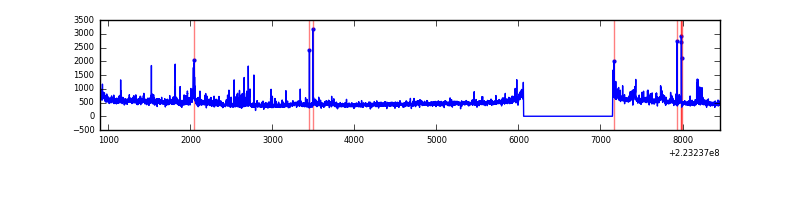 |
| C | 7560 | 6476 | 2 | 2 | 0.03% | 0.03% | 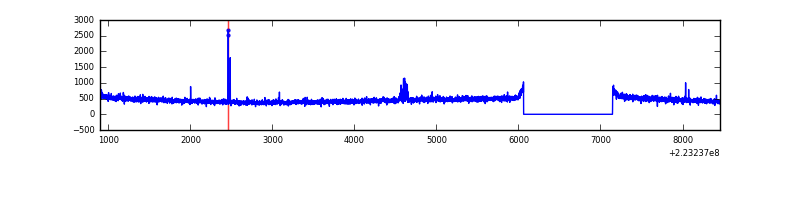 |
| D | 7560 | 6475 | 273 | 273 | 3.61% | 4.22% | 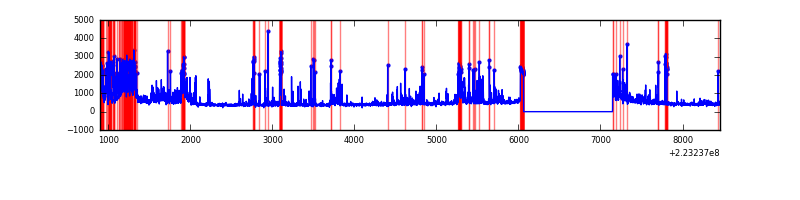 |
Top three noisy pixels from each quadrant. If the there are fewer than three noisy pixels in the level2.evt file, extra rows are filled as -1
| Pixel properties | Quadrant properties | ||||||
|---|---|---|---|---|---|---|---|
| Quadrant | DetID | PixID | Counts | Sigma | Mean | Median | Sigma |
| A | 8 | 15 | 294274 | 1938.57 | 754 | 740 | 151.4 |
| A | 3 | 1 | 10635 | 65.35 | 754 | 740 | 151.4 |
| A | 14 | 111 | 10302 | 63.15 | 754 | 740 | 151.4 |
| B | 0 | 214 | 101904 | 695.8 | 763 | 744 | 145.4 |
| B | 4 | 81 | 88455 | 603.3 | 763 | 744 | 145.4 |
| B | 10 | 16 | 60538 | 411.28 | 763 | 744 | 145.4 |
| C | 9 | 68 | 38155 | 218.45 | 731 | 733 | 171.3 |
| C | 8 | 128 | 12197 | 66.92 | 731 | 733 | 171.3 |
| C | 10 | 22 | 10924 | 59.49 | 731 | 733 | 171.3 |
| D | 2 | 216 | 1013578 | 5811.86 | 705 | 684 | 174.3 |
| D | 2 | 14 | 264646 | 1514.58 | 705 | 684 | 174.3 |
| D | 2 | 136 | 185270 | 1059.13 | 705 | 684 | 174.3 |
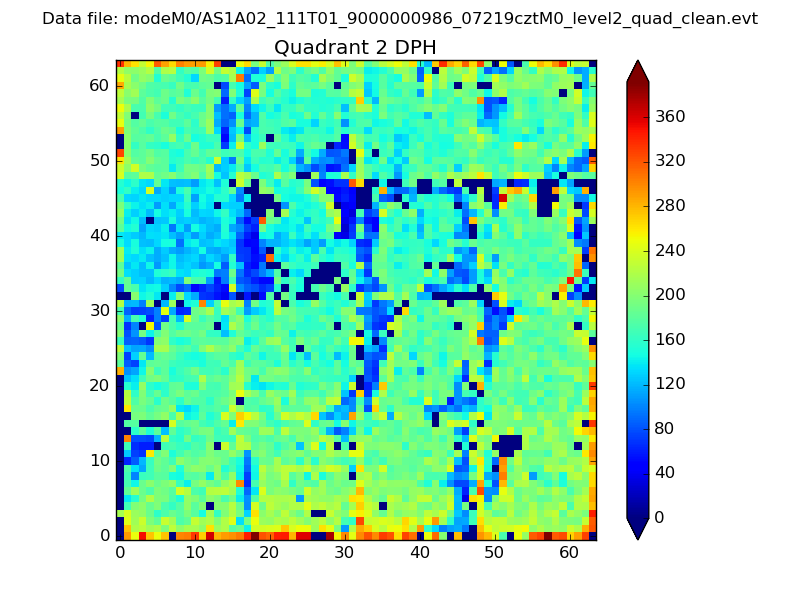
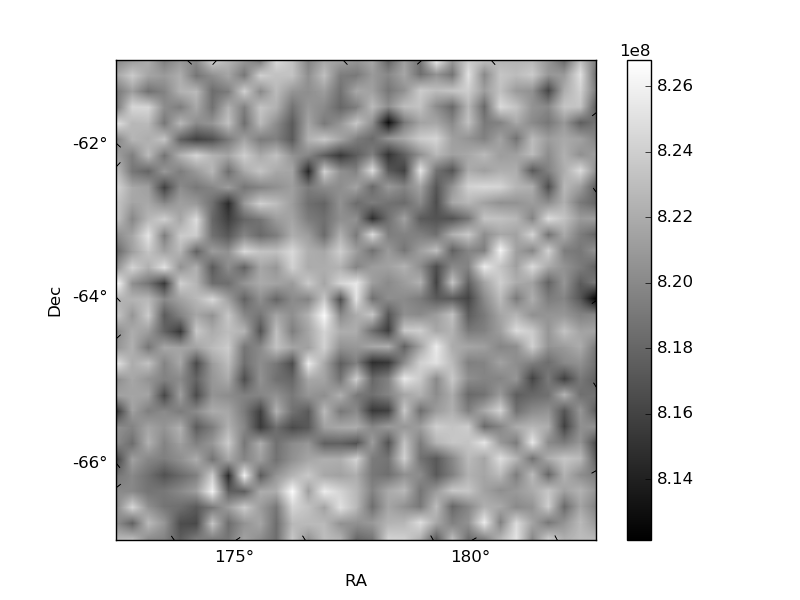
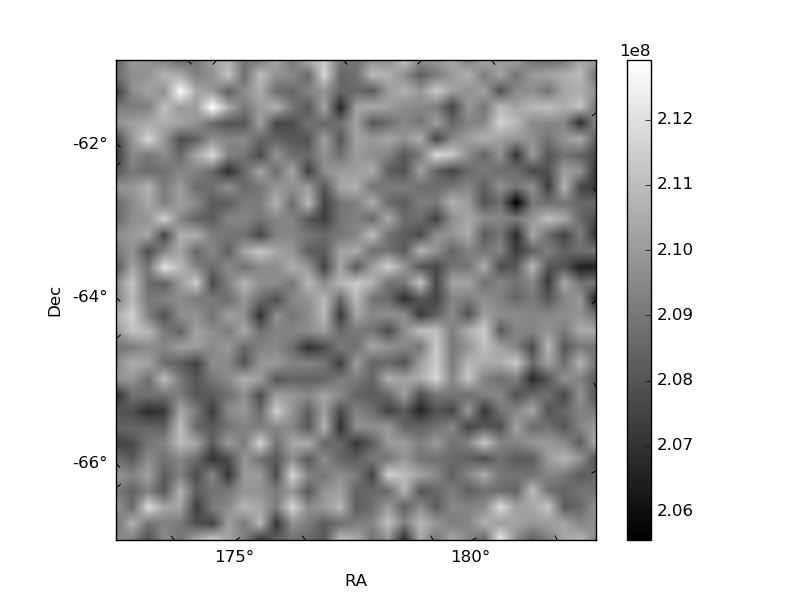
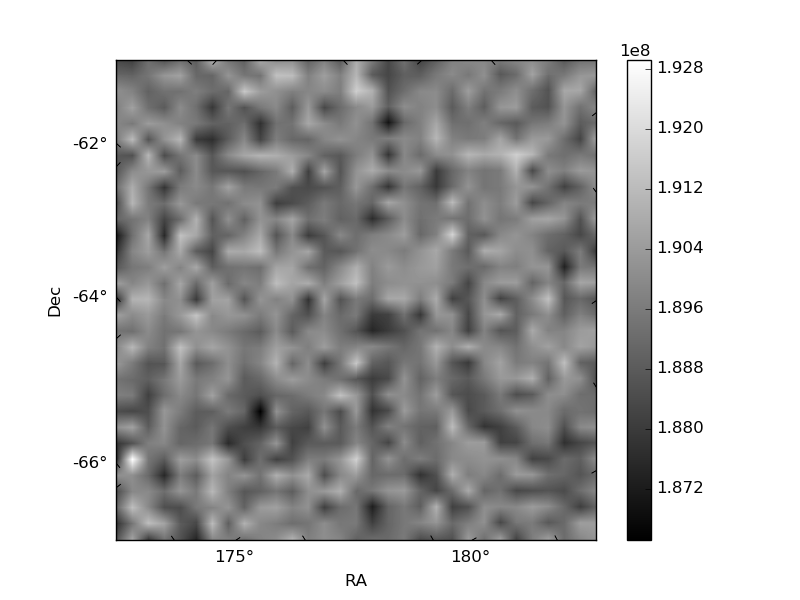
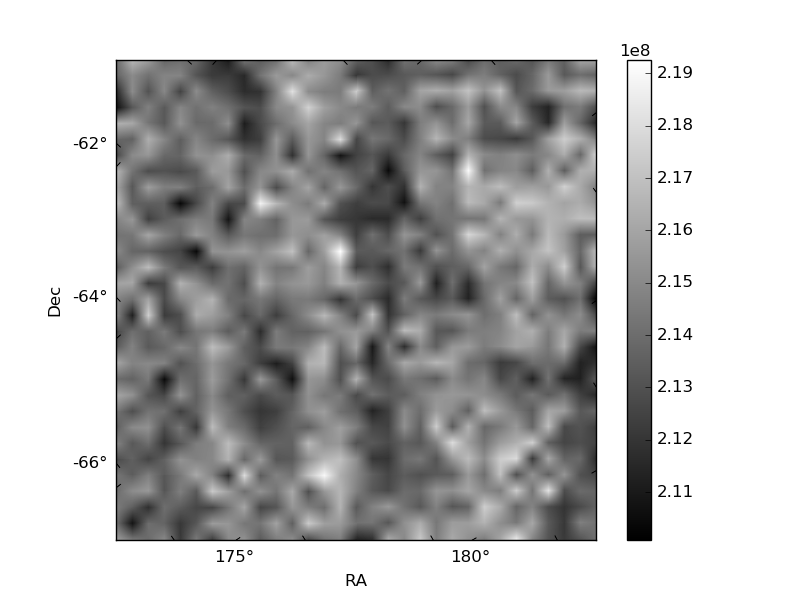
Histogram calculated using DETX and DETY for each event in the final _common_clean file
| Quadrant A | 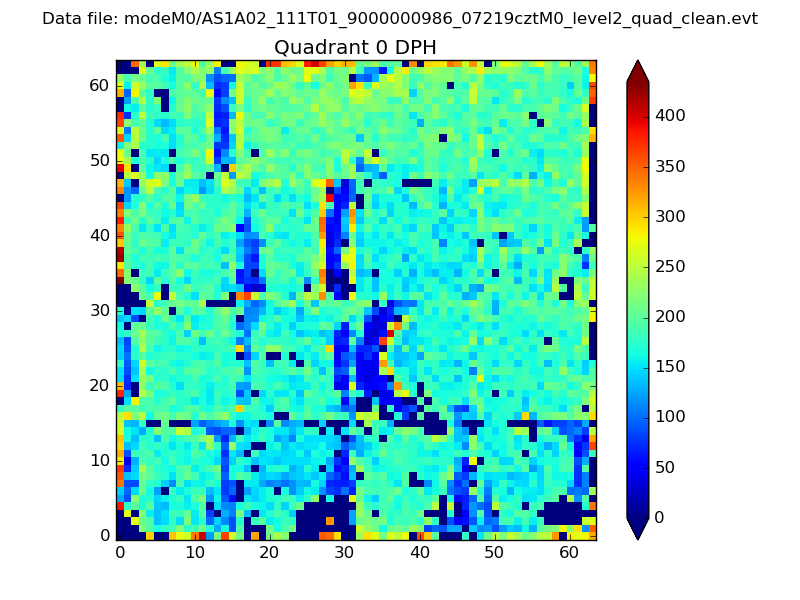 |
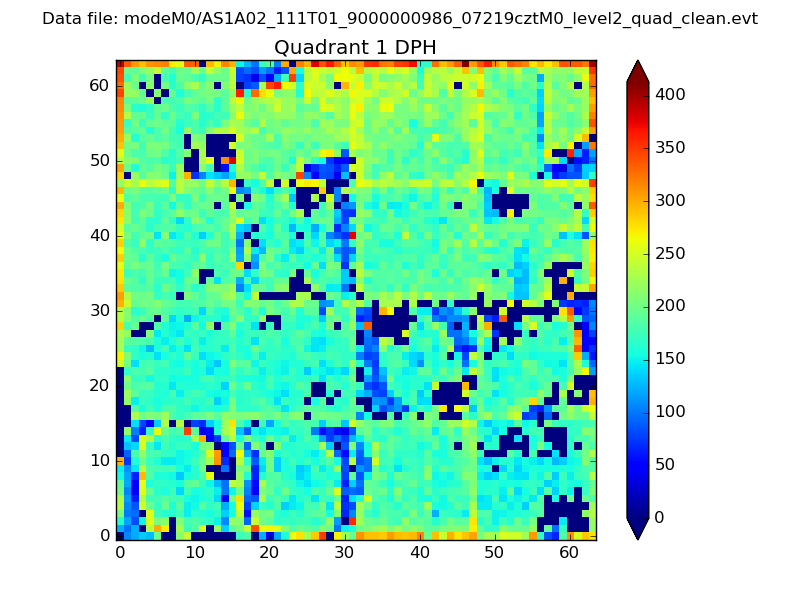 |
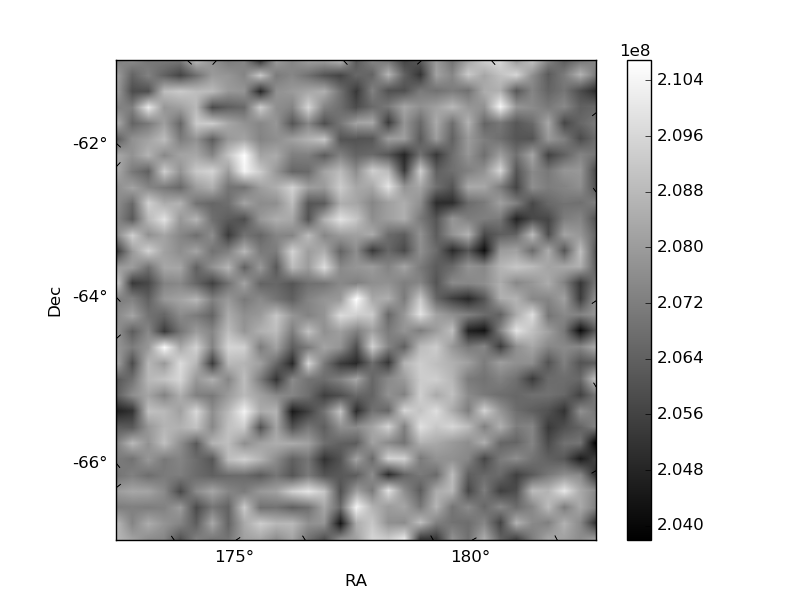
Quadrant B |
|---|---|---|---|
| Quadrant D | 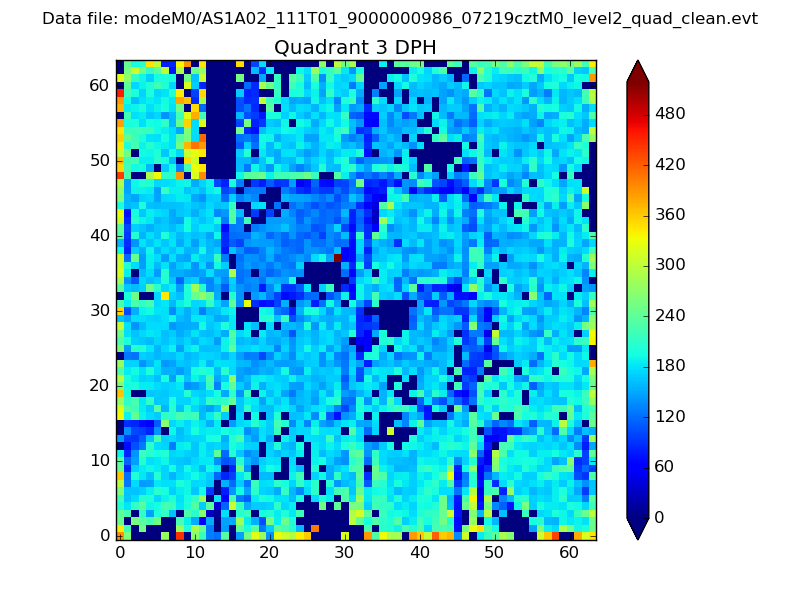 |
 |
Quadrant C |
| Plot type | Count rate plots | Images |
|---|---|---|
| Comparison with Poisson distribution Blue bars denote a histogram of data divided into 1 sec bins. Red curve is a Poisson curve with rate = median count rate of data. |
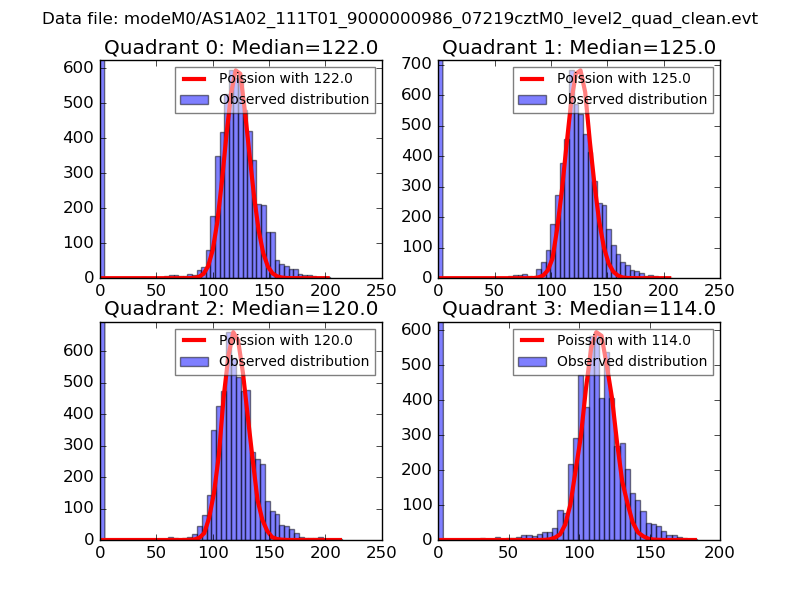 |
 |
| Quadrant-wise count rates Data is divided into 100 sec bins |
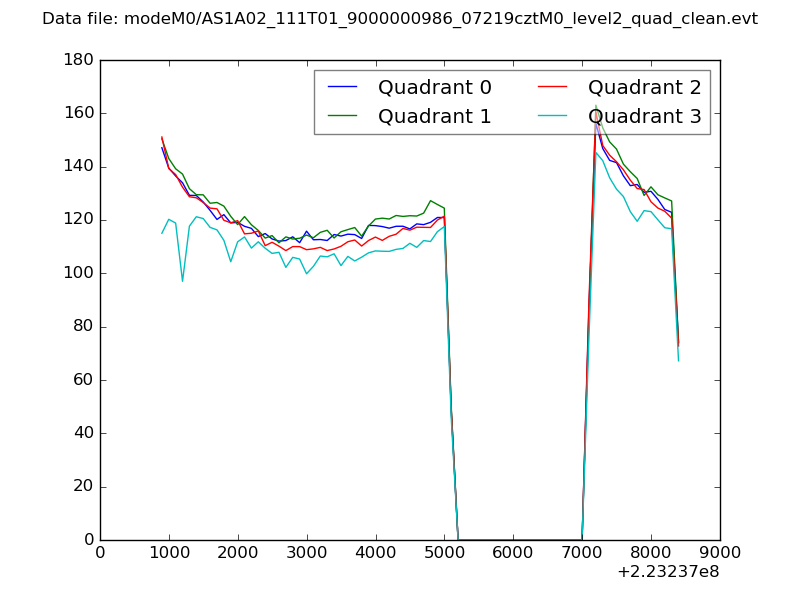 |
|
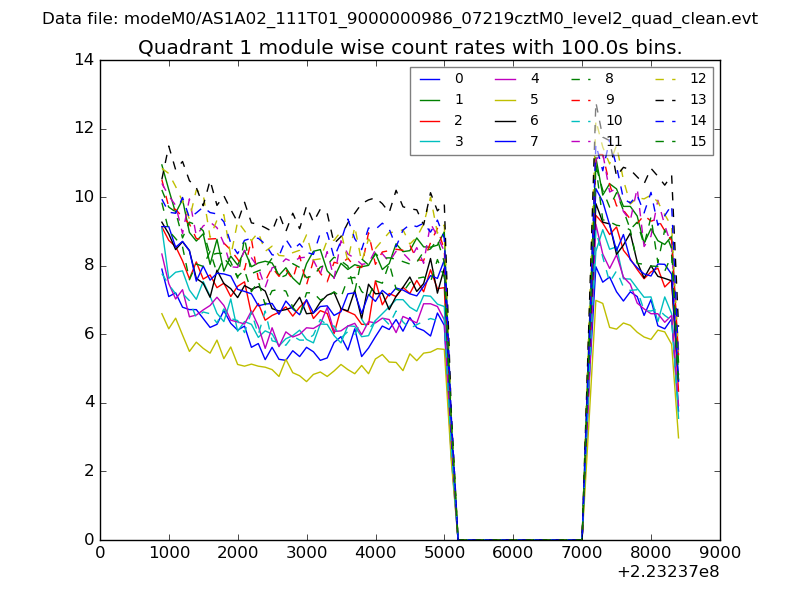
| Module-wise count rates for Quadrant A Data is divided into 100 sec bins |
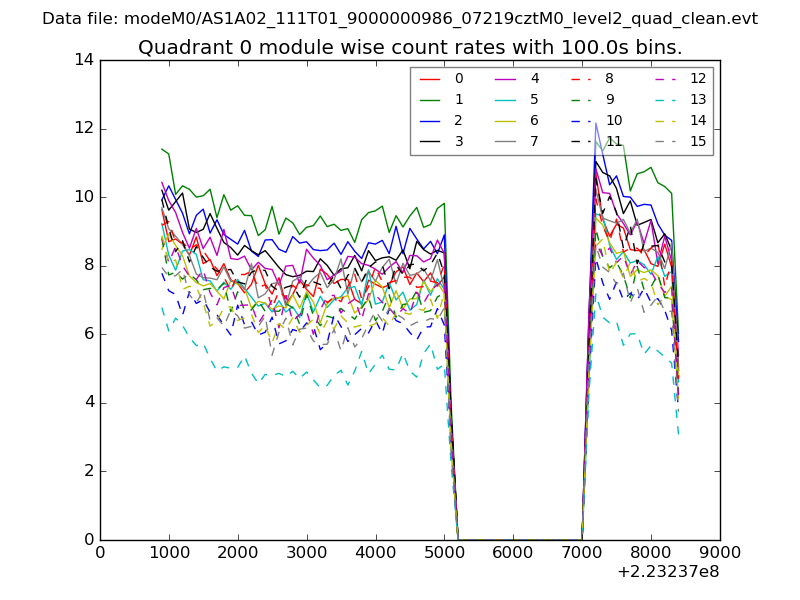 |
 |
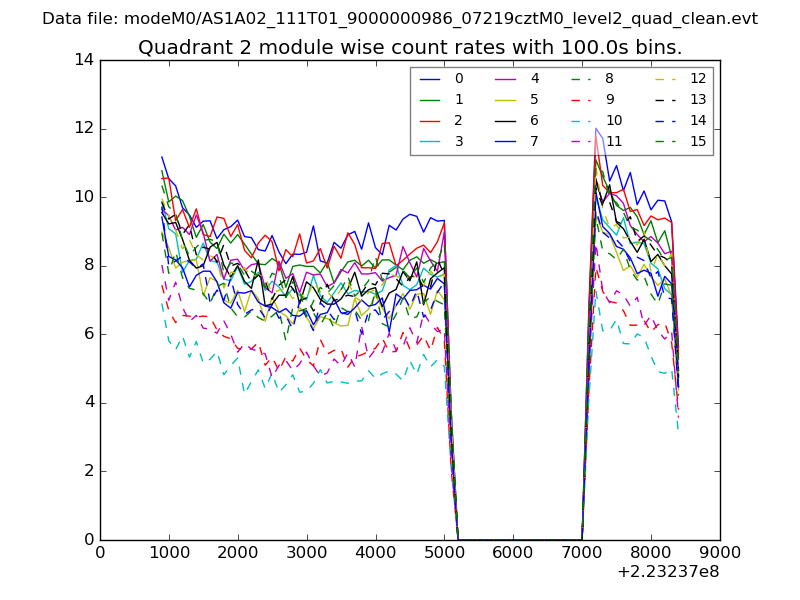
| Module-wise count rates for Quadrant B Data is divided into 100 sec bins |
 |
 |
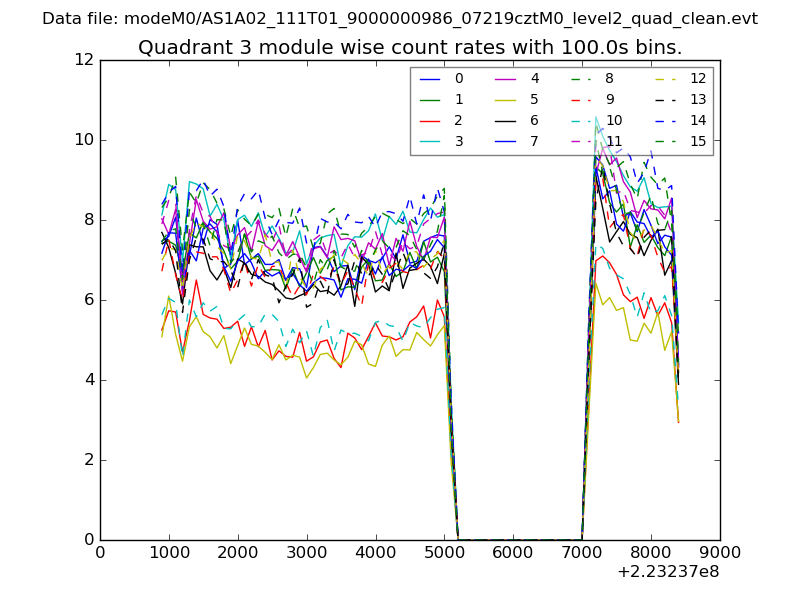
| Module-wise count rates for Quadrant C Data is divided into 100 sec bins |
 |
 |
| Module-wise count rates for Quadrant D Data is divided into 100 sec bins |
 |
 |
| Parameter | Plot |
|---|---|
| CZT HV Monitor | 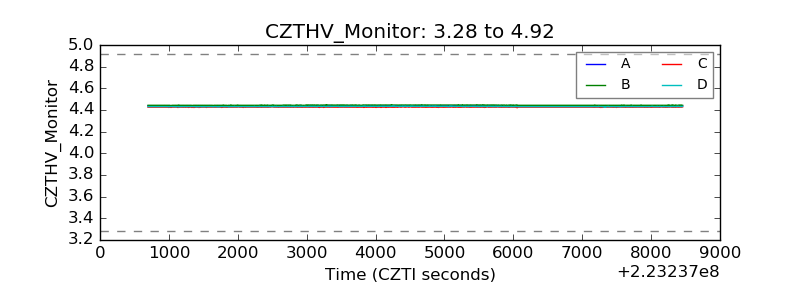 |
| D_VDD | 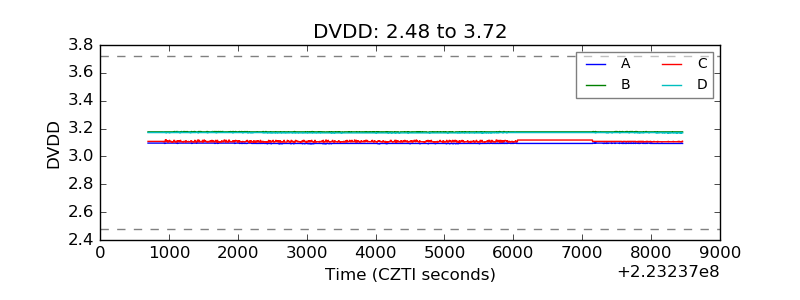 |
| Temperature 1 | 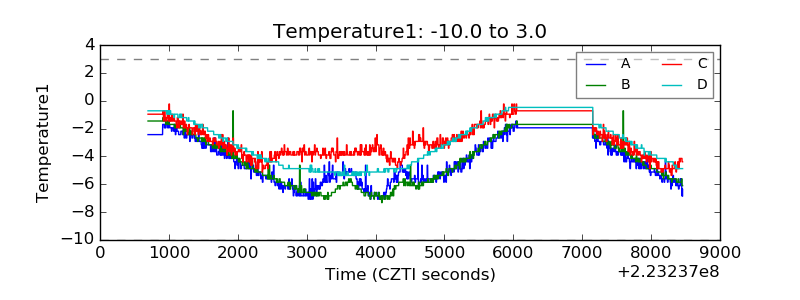 |
| Veto HV Monitor | 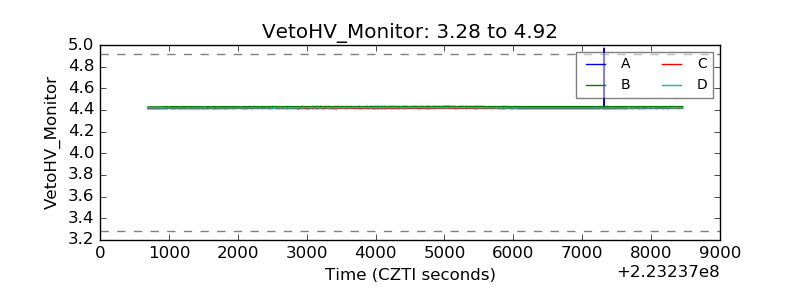 |
| Veto LLD | 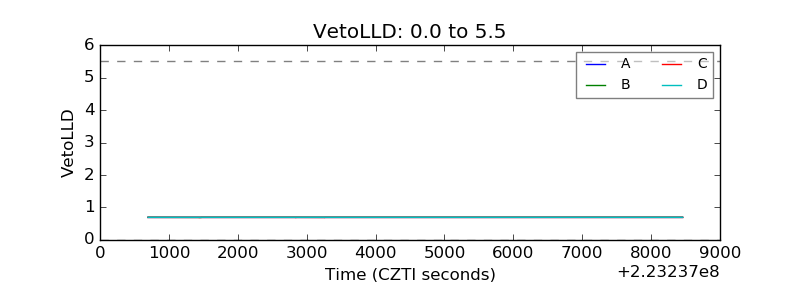 |
| Alpha Counter | 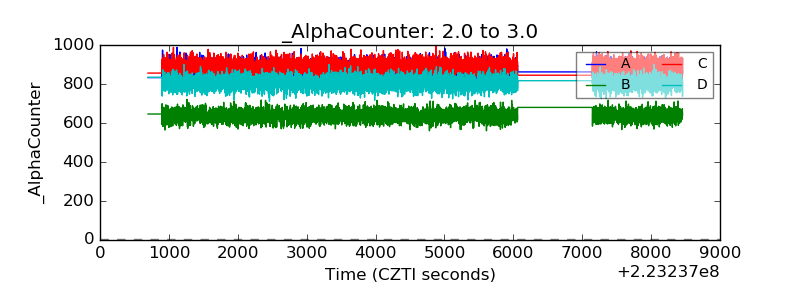 |
| _CPM_Rate | 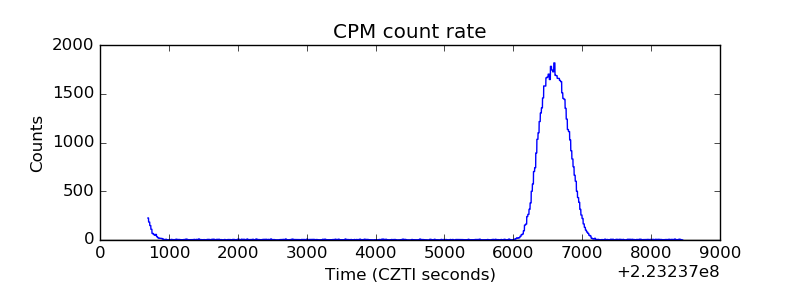 |
| CZT Counter | 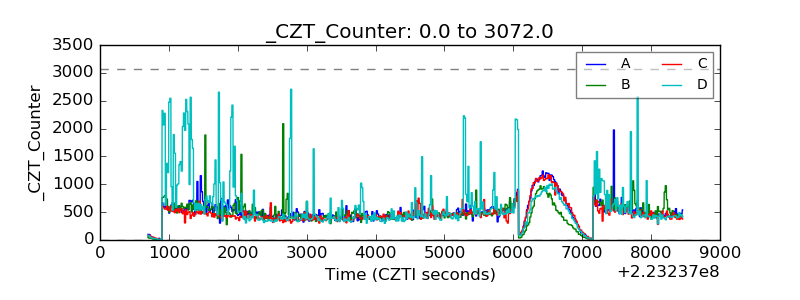 |
| +2.5 Volts monitor | 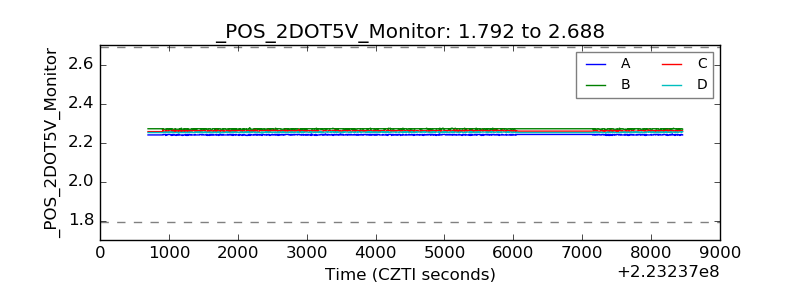 |
| +5 Volts monitor |  |
| _ROLL_ROT | 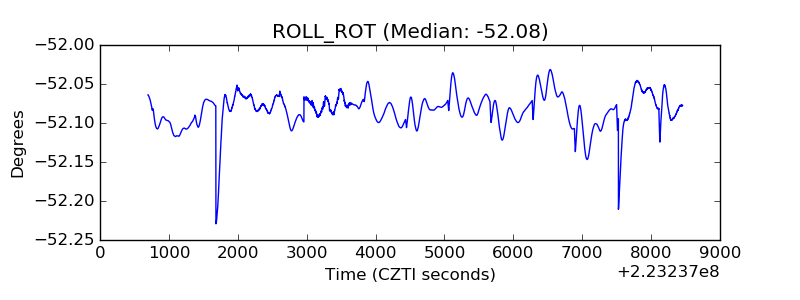 |
| _Roll_DEC | 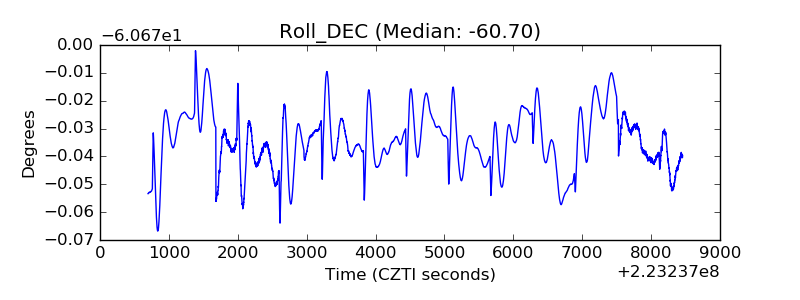 |
| _Roll_RA | 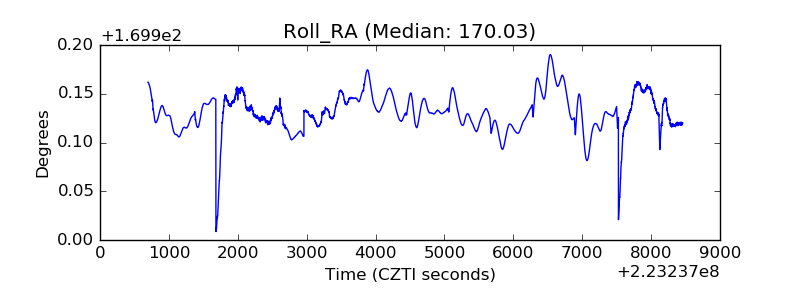 |
| Veto Counter | 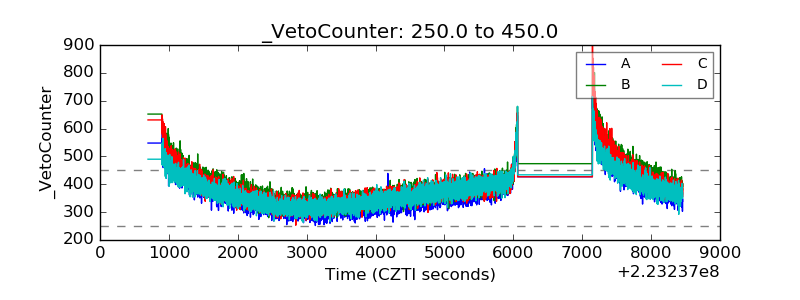 |