| Param | Original file | Final file |
|---|---|---|
| Filename | modeM0/AS1A02_111T01_9000000986_07221cztM0_level2.evt | modeM0/AS1A02_111T01_9000000986_07221cztM0_level2_quad_clean.evt |
| Size (bytes) | 461,162,880 | 103,348,800 |
| Size | 439.8 MB | 98.6 MB |
| Events in quadrant A | 3,209,939 | 675,370 |
| Events in quadrant B | 3,526,776 | 700,062 |
| Events in quadrant C | 3,017,634 | 679,355 |
| Events in quadrant D | 3,772,166 | 623,602 |
| Mode SS | |||
|---|---|---|---|
| Quadrant | BADHDUFLAG | Total packets | Discarded packets |
| A | 0 | 132 | 0 |
| B | 0 | 132 | 0 |
| C | 0 | 132 | 0 |
| D | 0 | 132 | 0 |
| Mode M0 | |||
|---|---|---|---|
| Quadrant | BADHDUFLAG | Total packets | Discarded packets |
| A | 0 | 13922 | 3 |
| B | 0 | 14851 | 2 |
| C | 0 | 13301 | 2 |
| D | 0 | 15585 | 2 |
| Mode M9 | |||
|---|---|---|---|
| Quadrant | BADHDUFLAG | Total packets | Discarded packets |
| A | 0 | 18 | 0 |
| B | 0 | 18 | 0 |
| C | 0 | 18 | 0 |
| D | 0 | 19 | 0 |
| Quadrant | Total seconds | Saturated seconds | Saturation percentage |
|---|---|---|---|
| A | 6471 | 33 | 0.509968% |
| B | 6471 | 97 | 1.498996% |
| C | 6471 | 9 | 0.139082% |
| D | 6471 | 217 | 3.353423% |
Noise dominated data is calculated using 1-second bins in cleaned event files. If a bin has >2000 counts, and if more than 50% of those come from <1% of pixels, then it is considered to be noise-dominated and hence unusable.
| Quadrant | # 1 sec bins | Bins with >0 counts | Bins with >2000 counts | High rate bins dominated by noise | Noise dominated (total time) | Noise dominated (detector-on time) | Marked lightcurve |
|---|---|---|---|---|---|---|---|
| A | 7761 | 6472 | 4 | 4 | 0.05% | 0.06% | 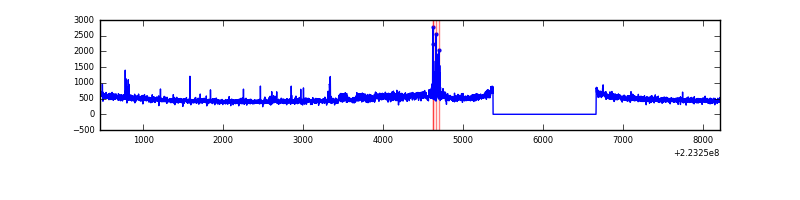 |
| B | 7761 | 6472 | 49 | 49 | 0.63% | 0.76% | 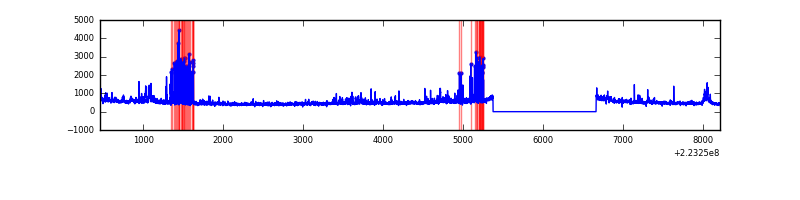 |
| C | 7761 | 6472 | 0 | 0 | 0.00% | 0.00% | 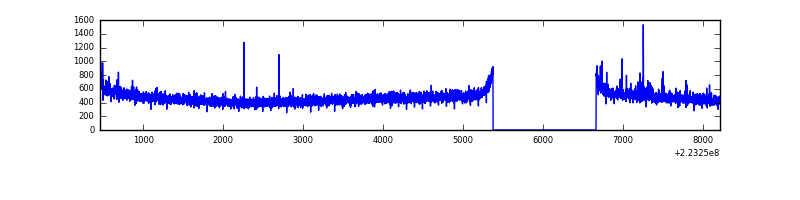 |
| D | 7761 | 6472 | 201 | 201 | 2.59% | 3.11% | 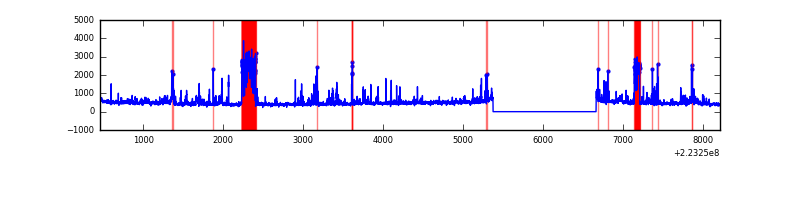 |
Top three noisy pixels from each quadrant. If the there are fewer than three noisy pixels in the level2.evt file, extra rows are filled as -1
| Pixel properties | Quadrant properties | ||||||
|---|---|---|---|---|---|---|---|
| Quadrant | DetID | PixID | Counts | Sigma | Mean | Median | Sigma |
| A | 14 | 111 | 154254 | 991.48 | 766 | 752 | 154.8 |
| A | 13 | 248 | 48513 | 308.49 | 766 | 752 | 154.8 |
| A | 8 | 15 | 45318 | 287.85 | 766 | 752 | 154.8 |
| B | 10 | 16 | 167959 | 1142.67 | 783 | 766 | 146.3 |
| B | 4 | 81 | 137063 | 931.51 | 783 | 766 | 146.3 |
| B | 0 | 214 | 92521 | 627.09 | 783 | 766 | 146.3 |
| C | 9 | 68 | 30535 | 170.11 | 760 | 766 | 175.0 |
| C | 1 | 16 | 7497 | 38.46 | 760 | 766 | 175.0 |
| C | 8 | 128 | 6192 | 31.01 | 760 | 766 | 175.0 |
| D | 2 | 216 | 597272 | 3328.86 | 735 | 712 | 179.2 |
| D | 2 | 33 | 155481 | 863.63 | 735 | 712 | 179.2 |
| D | 2 | 14 | 102291 | 566.82 | 735 | 712 | 179.2 |
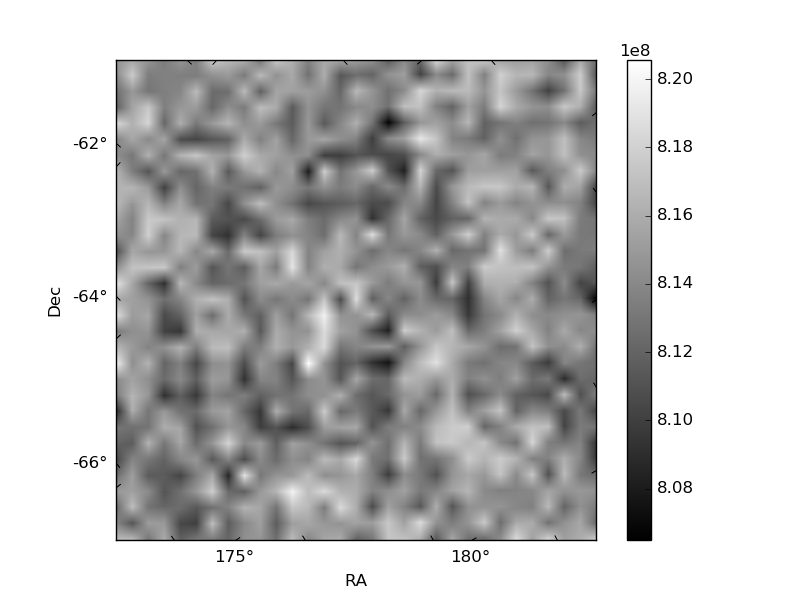
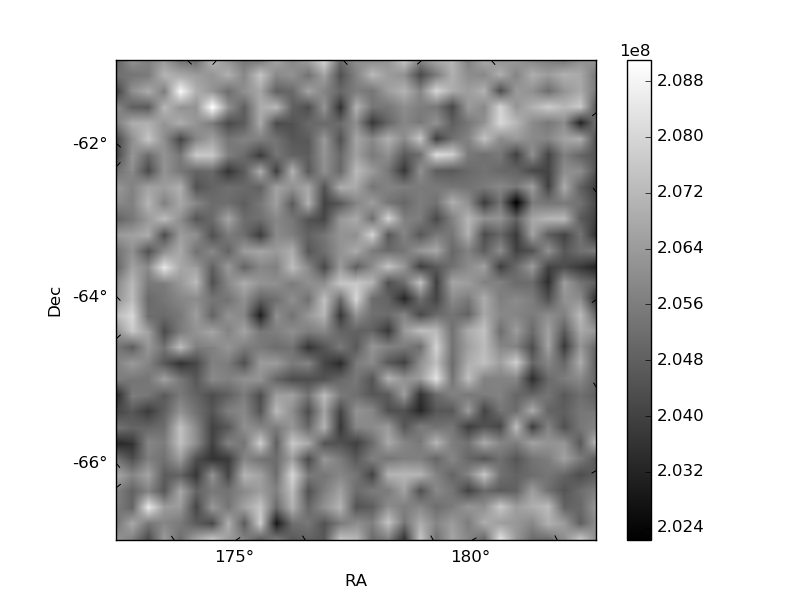
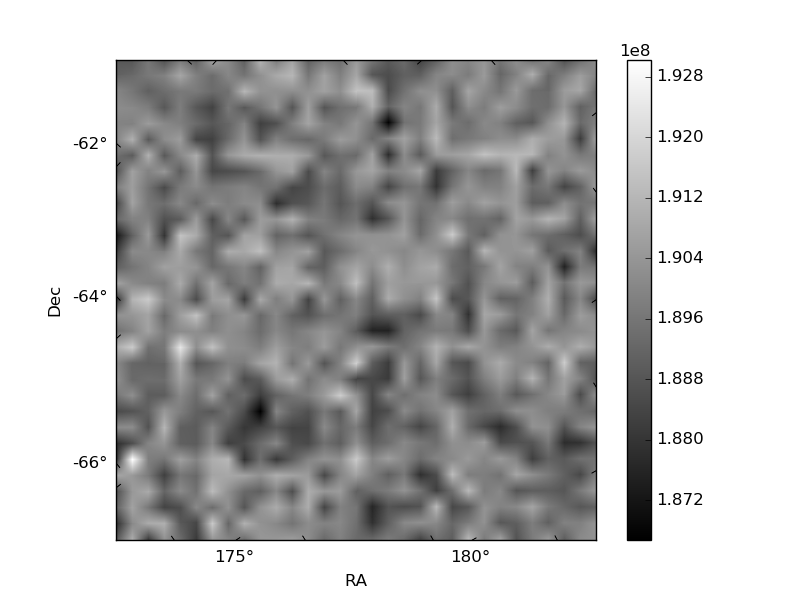
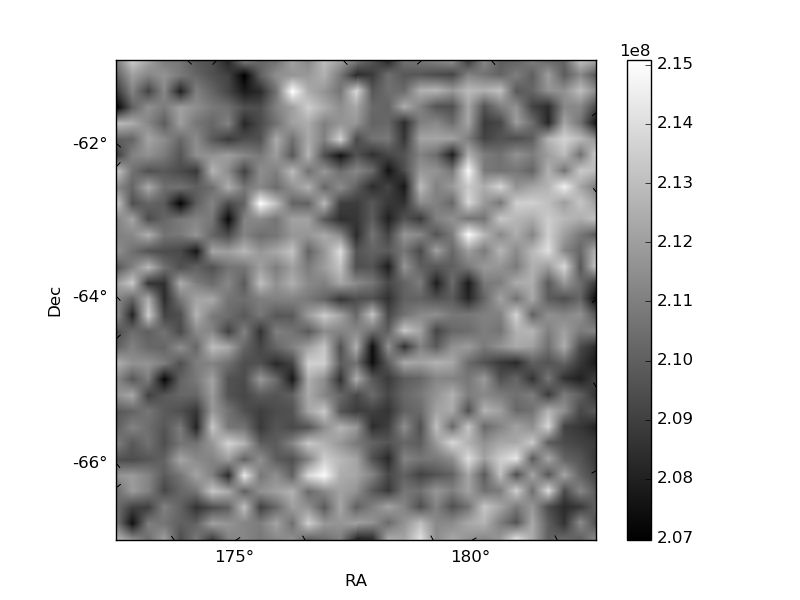
Histogram calculated using DETX and DETY for each event in the final _common_clean file
| Quadrant A | 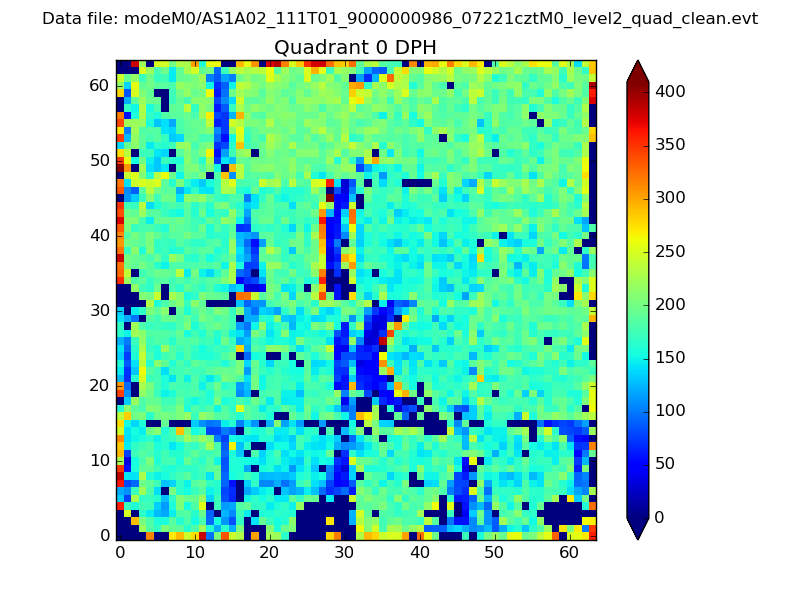 |
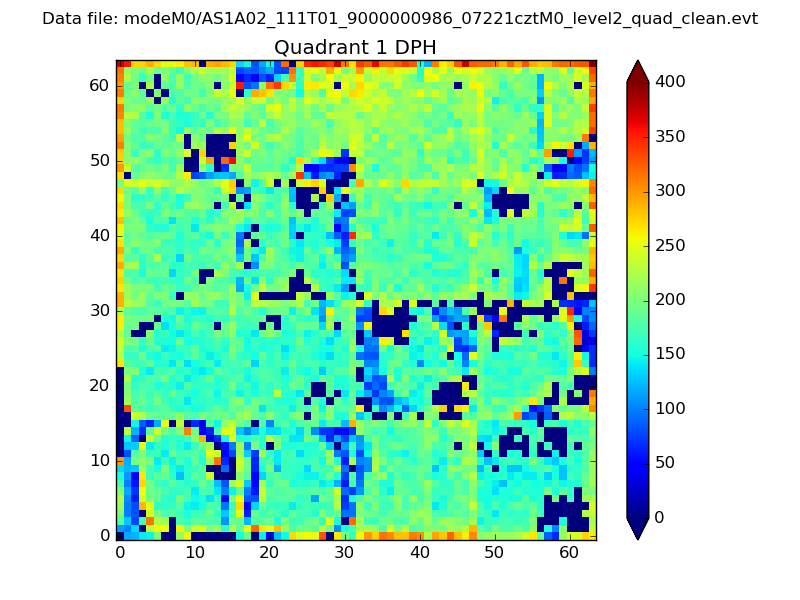 |
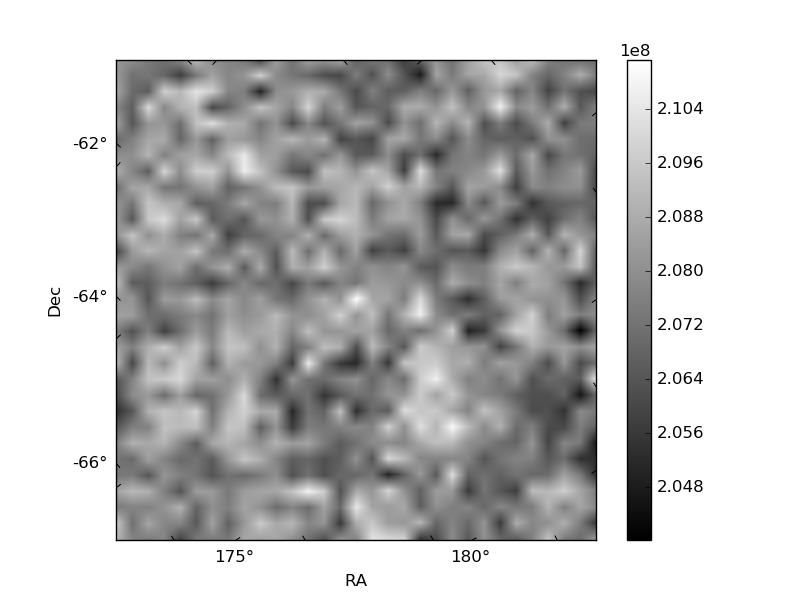
Quadrant B |
|---|---|---|---|
| Quadrant D | 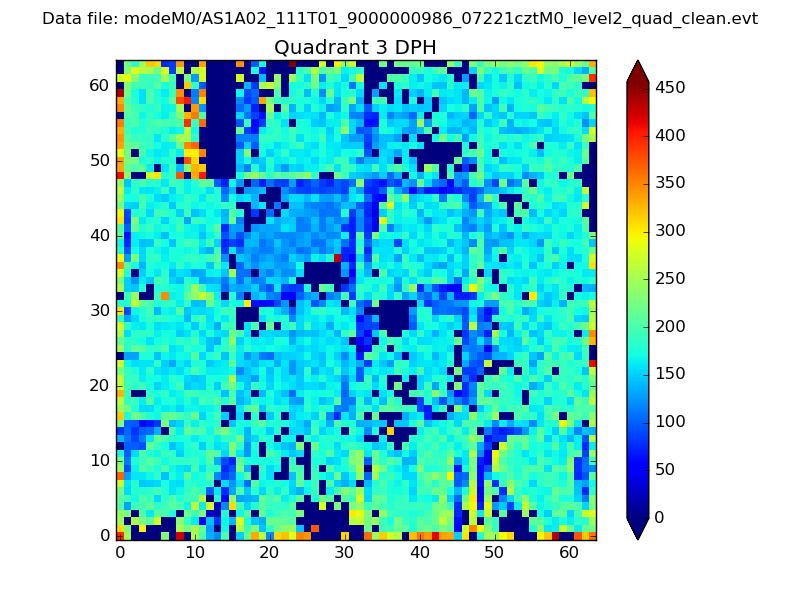 |
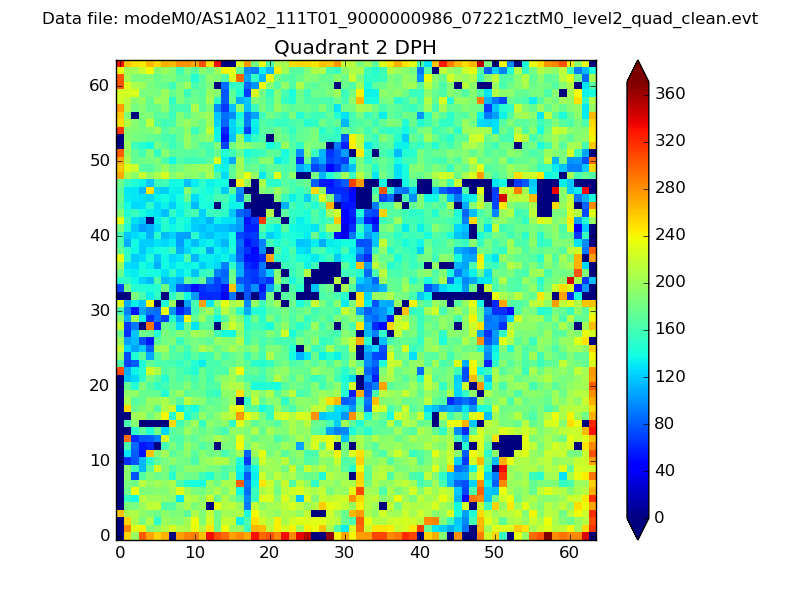 |
Quadrant C |
| Plot type | Count rate plots | Images |
|---|---|---|
| Comparison with Poisson distribution Blue bars denote a histogram of data divided into 1 sec bins. Red curve is a Poisson curve with rate = median count rate of data. |
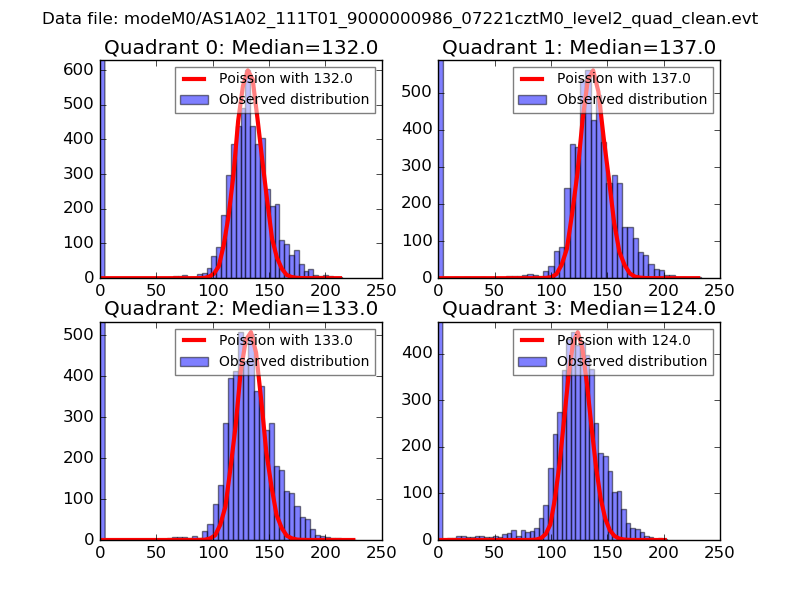 |
 |
| Quadrant-wise count rates Data is divided into 100 sec bins |
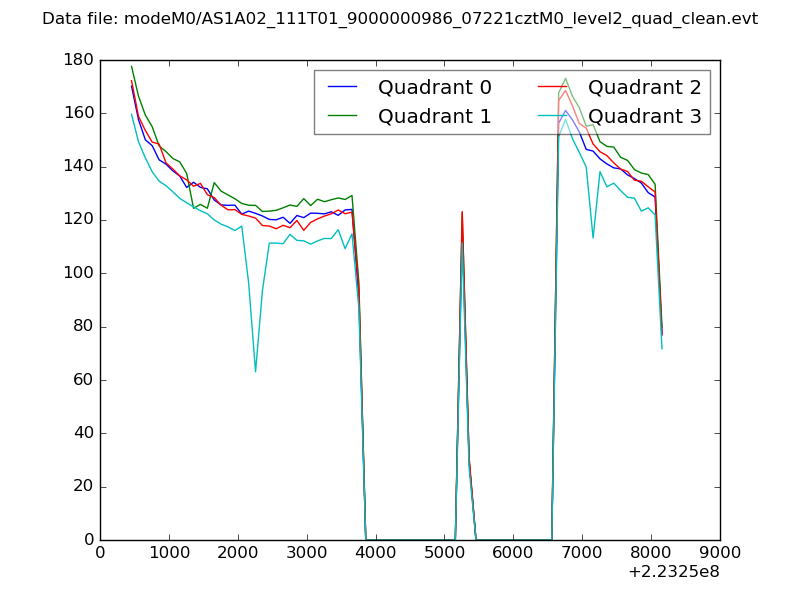 |
|
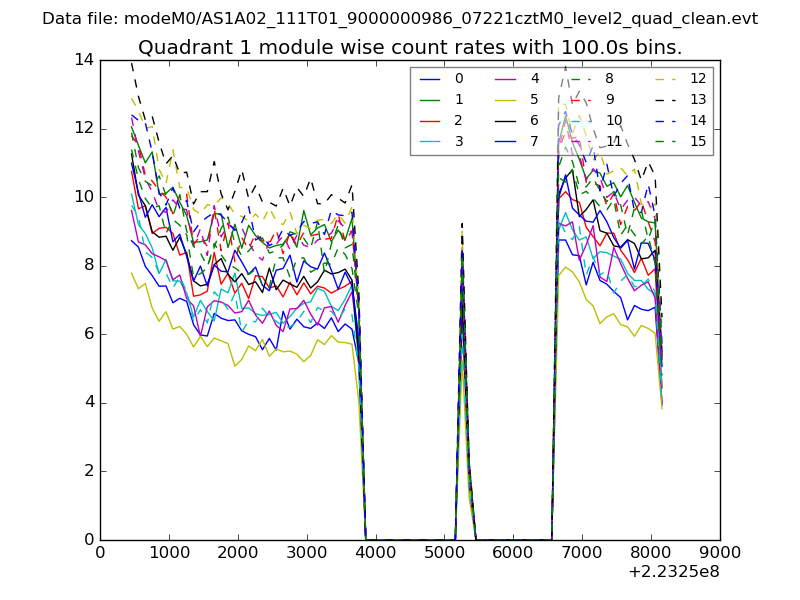
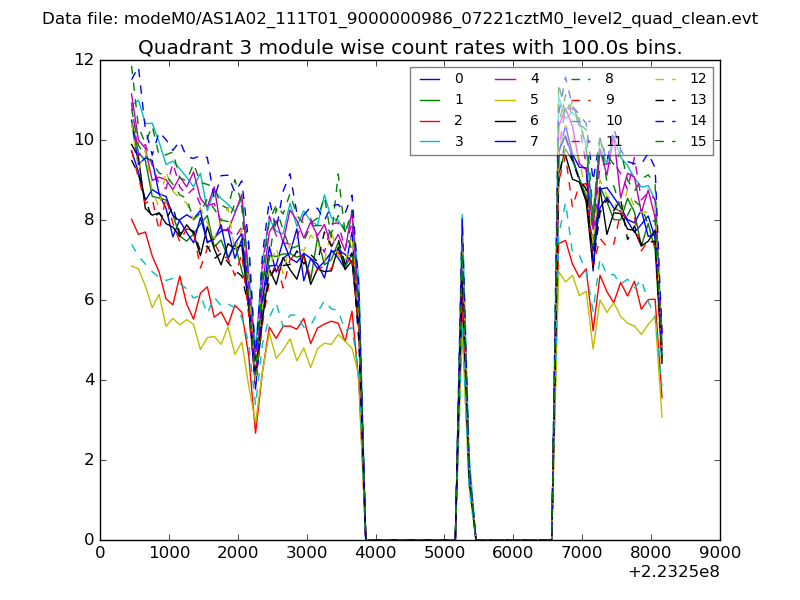
| Module-wise count rates for Quadrant A Data is divided into 100 sec bins |
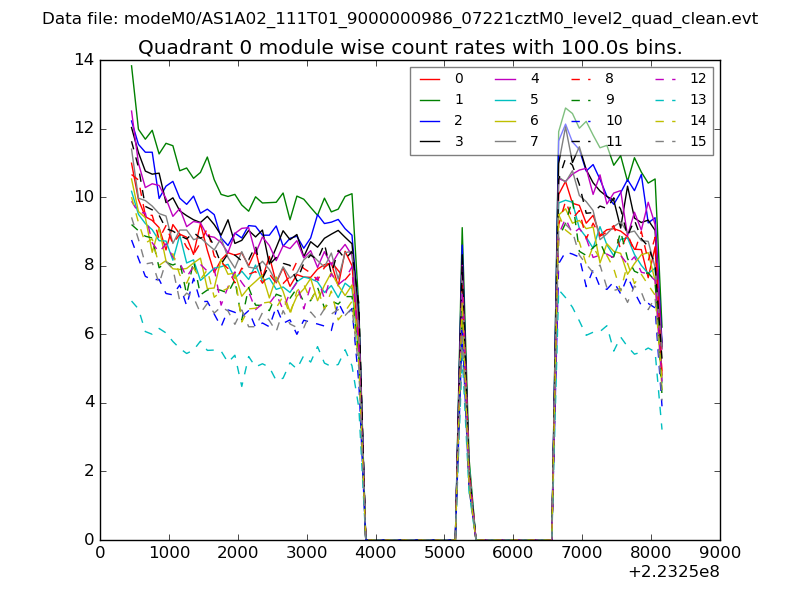 |
 |
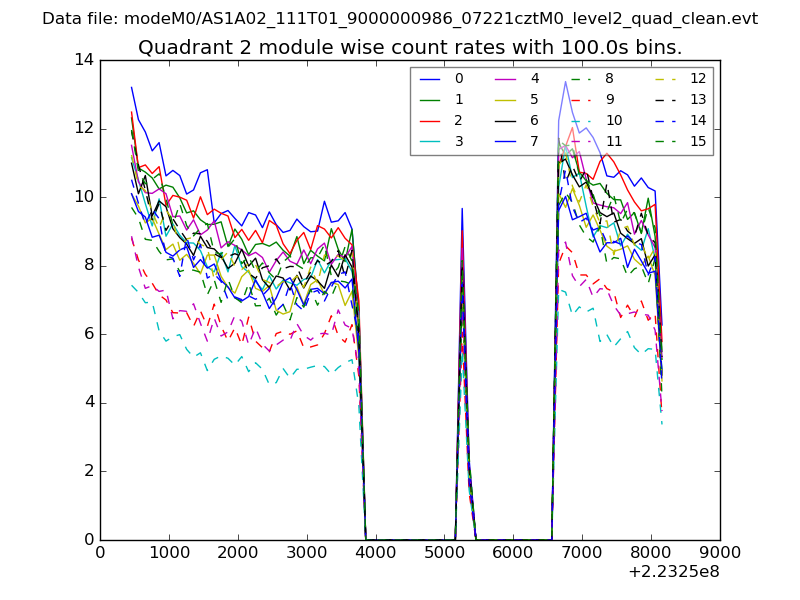
| Module-wise count rates for Quadrant B Data is divided into 100 sec bins |
 |
 |
| Module-wise count rates for Quadrant C Data is divided into 100 sec bins |
 |
 |
| Module-wise count rates for Quadrant D Data is divided into 100 sec bins |
 |
 |
| Parameter | Plot |
|---|---|
| CZT HV Monitor | 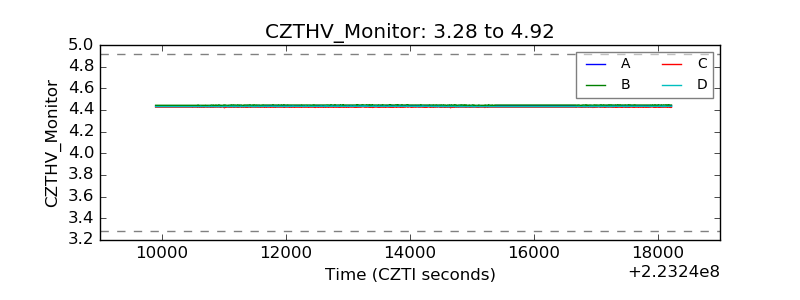 |
| D_VDD | 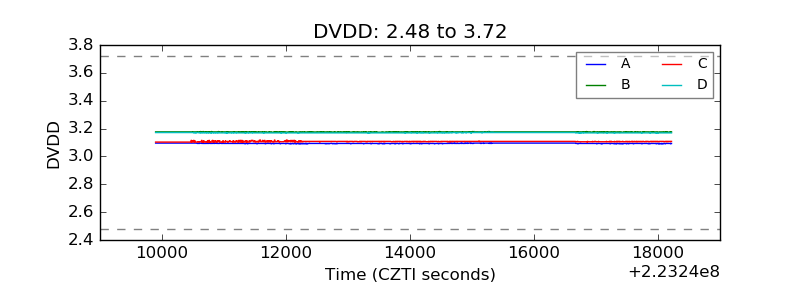 |
| Temperature 1 | 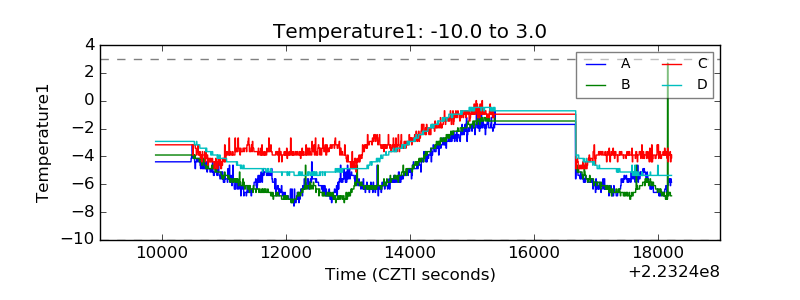 |
| Veto HV Monitor | 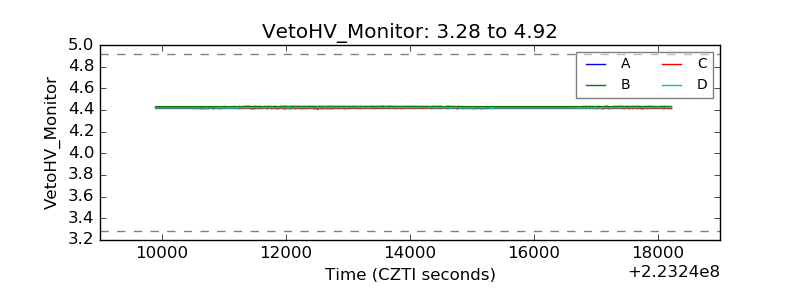 |
| Veto LLD | 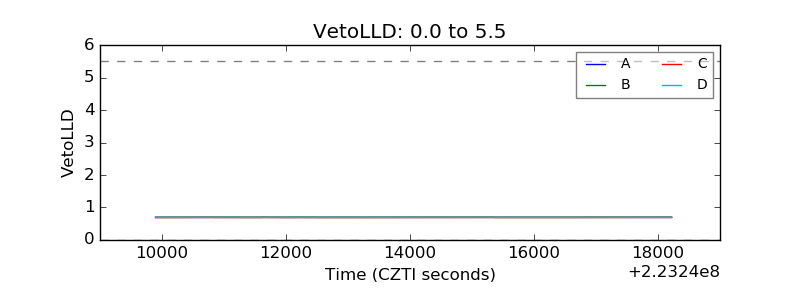 |
| Alpha Counter | 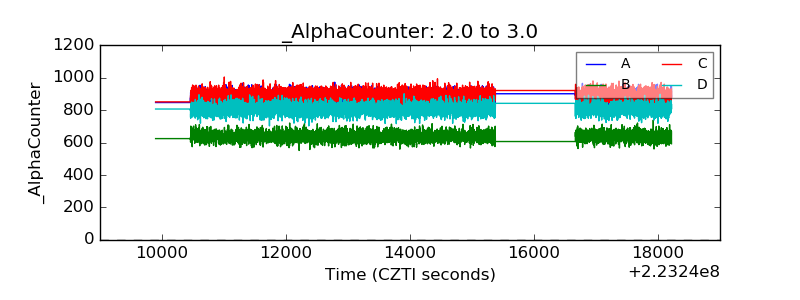 |
| _CPM_Rate | 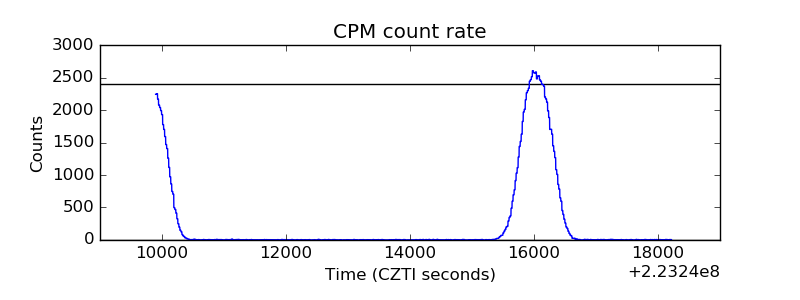 |
| CZT Counter | 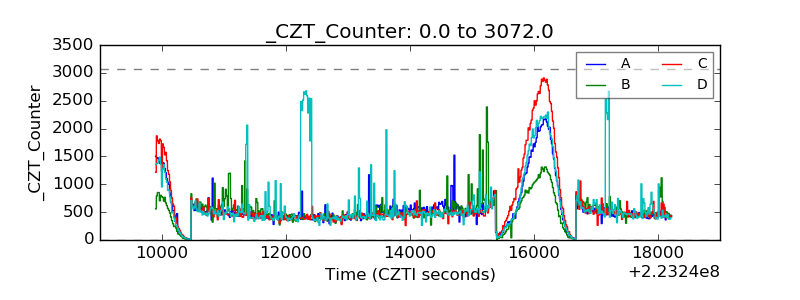 |
| +2.5 Volts monitor | 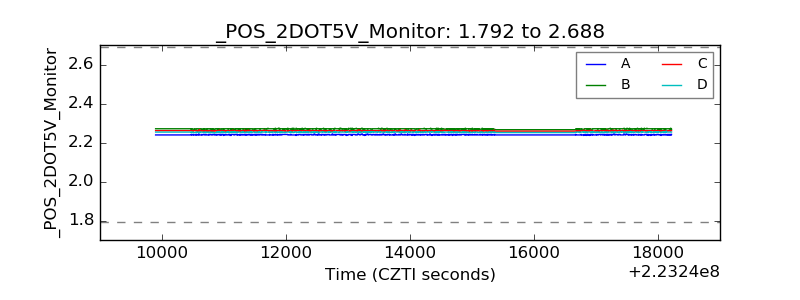 |
| +5 Volts monitor | 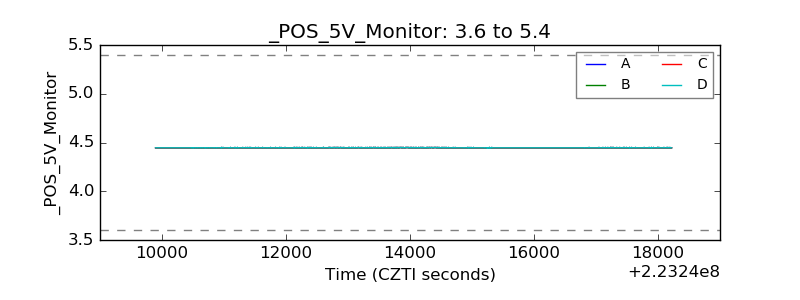 |
| _ROLL_ROT | 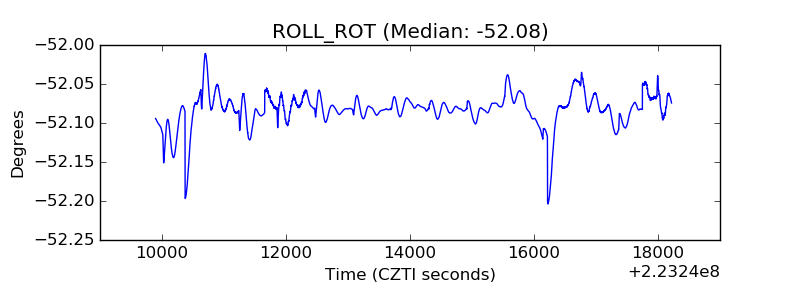 |
| _Roll_DEC | 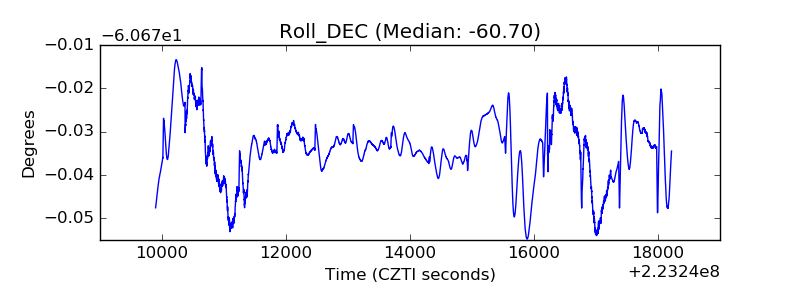 |
| _Roll_RA | 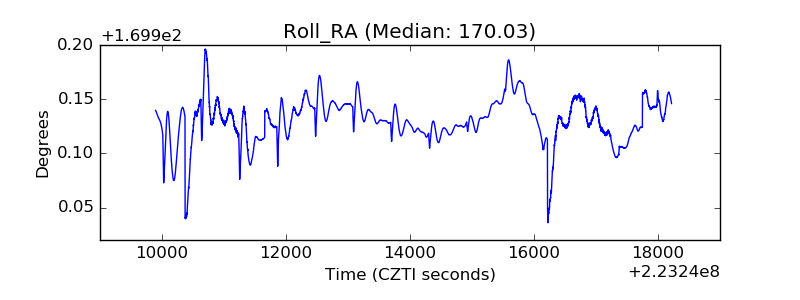 |
| Veto Counter | 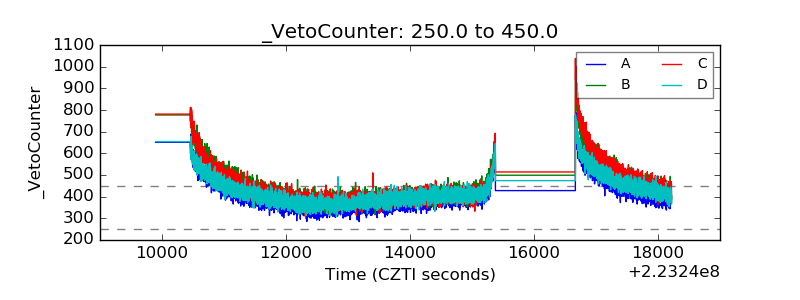 |