| Param | Original file | Final file |
|---|---|---|
| Filename | modeM0/AS1A02_111T01_9000000986_07222cztM0_level2.evt | modeM0/AS1A02_111T01_9000000986_07222cztM0_level2_quad_clean.evt |
| Size (bytes) | 358,960,320 | 77,952,960 |
| Size | 342.3 MB | 74.3 MB |
| Events in quadrant A | 2,469,450 | 499,214 |
| Events in quadrant B | 2,628,281 | 521,986 |
| Events in quadrant C | 2,582,197 | 509,024 |
| Events in quadrant D | 2,842,612 | 471,472 |
| Mode SS | |||
|---|---|---|---|
| Quadrant | BADHDUFLAG | Total packets | Discarded packets |
| A | 0 | 104 | 0 |
| B | 0 | 104 | 0 |
| C | 0 | 104 | 0 |
| D | 0 | 104 | 0 |
| Mode M0 | |||
|---|---|---|---|
| Quadrant | BADHDUFLAG | Total packets | Discarded packets |
| A | 0 | 10754 | 2 |
| B | 0 | 11260 | 2 |
| C | 0 | 11131 | 2 |
| D | 0 | 11935 | 2 |
| Mode M9 | |||
|---|---|---|---|
| Quadrant | BADHDUFLAG | Total packets | Discarded packets |
| A | 0 | 14 | 0 |
| B | 0 | 14 | 0 |
| C | 0 | 14 | 0 |
| D | 0 | 15 | 0 |
| Quadrant | Total seconds | Saturated seconds | Saturation percentage |
|---|---|---|---|
| A | 5121 | 28 | 0.546768% |
| B | 5121 | 45 | 0.878735% |
| C | 5121 | 20 | 0.390549% |
| D | 5121 | 90 | 1.757469% |
Noise dominated data is calculated using 1-second bins in cleaned event files. If a bin has >2000 counts, and if more than 50% of those come from <1% of pixels, then it is considered to be noise-dominated and hence unusable.
| Quadrant | # 1 sec bins | Bins with >0 counts | Bins with >2000 counts | High rate bins dominated by noise | Noise dominated (total time) | Noise dominated (detector-on time) | Marked lightcurve |
|---|---|---|---|---|---|---|---|
| A | 6451 | 5122 | 0 | 0 | 0.00% | 0.00% | 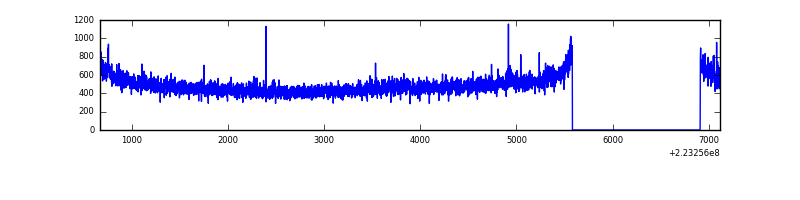 |
| B | 6451 | 5122 | 3 | 3 | 0.05% | 0.06% | 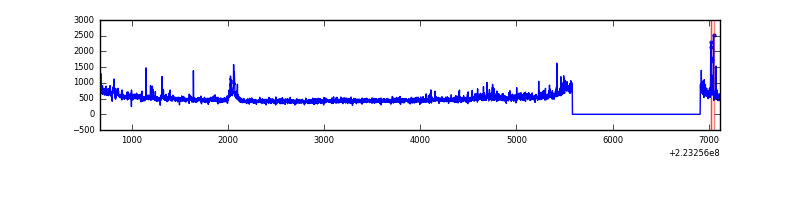 |
| C | 6451 | 5122 | 2 | 2 | 0.03% | 0.04% | 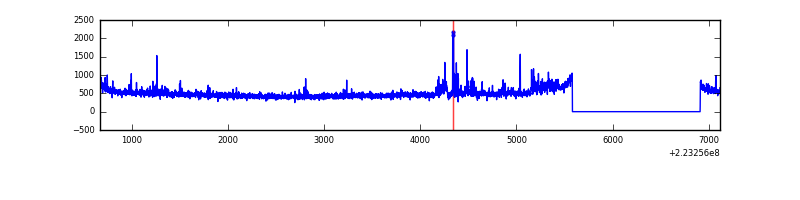 |
| D | 6451 | 5122 | 75 | 75 | 1.16% | 1.46% | 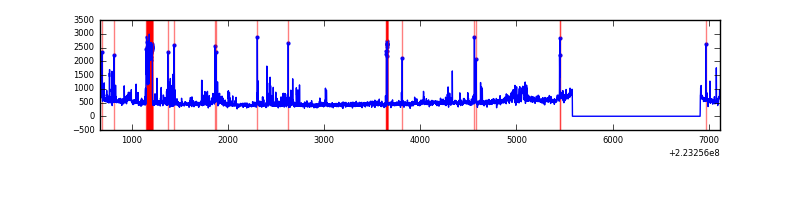 |
Top three noisy pixels from each quadrant. If the there are fewer than three noisy pixels in the level2.evt file, extra rows are filled as -1
| Pixel properties | Quadrant properties | ||||||
|---|---|---|---|---|---|---|---|
| Quadrant | DetID | PixID | Counts | Sigma | Mean | Median | Sigma |
| A | 8 | 15 | 63248 | 498.1 | 618 | 604 | 125.8 |
| A | 3 | 1 | 11895 | 89.78 | 618 | 604 | 125.8 |
| A | 14 | 111 | 9474 | 70.53 | 618 | 604 | 125.8 |
| B | 0 | 214 | 64488 | 536.99 | 632 | 618 | 118.9 |
| B | 4 | 81 | 49115 | 407.74 | 632 | 618 | 118.9 |
| B | 0 | 228 | 43143 | 357.53 | 632 | 618 | 118.9 |
| C | 9 | 68 | 172902 | 1204.99 | 616 | 620 | 143.0 |
| C | 10 | 22 | 6626 | 42.01 | 616 | 620 | 143.0 |
| C | 13 | 61 | 4594 | 27.8 | 616 | 620 | 143.0 |
| D | 2 | 33 | 179286 | 1216.34 | 601 | 581 | 146.9 |
| D | 2 | 216 | 161746 | 1096.95 | 601 | 581 | 146.9 |
| D | 2 | 63 | 110508 | 748.21 | 601 | 581 | 146.9 |
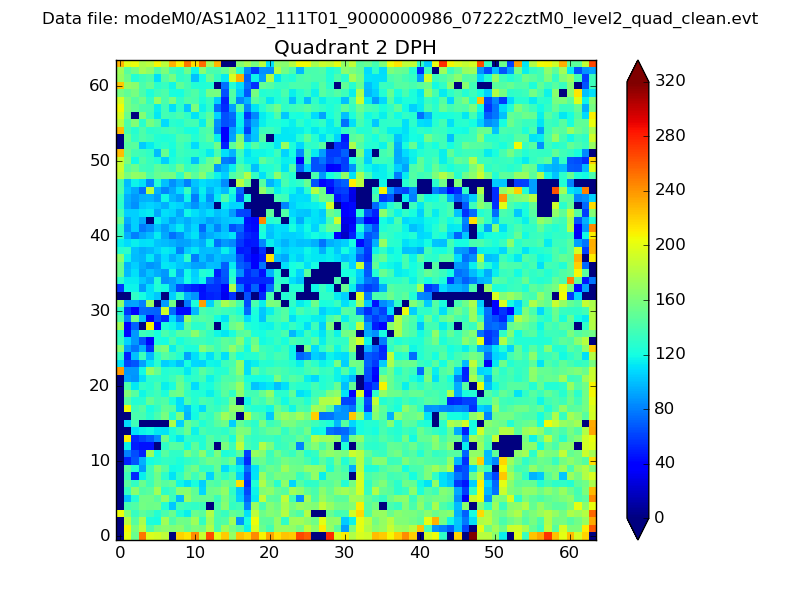
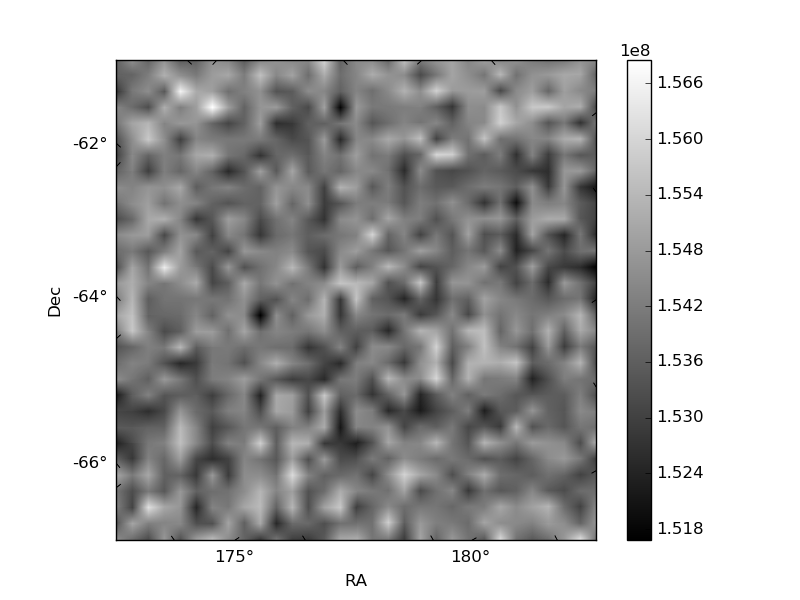
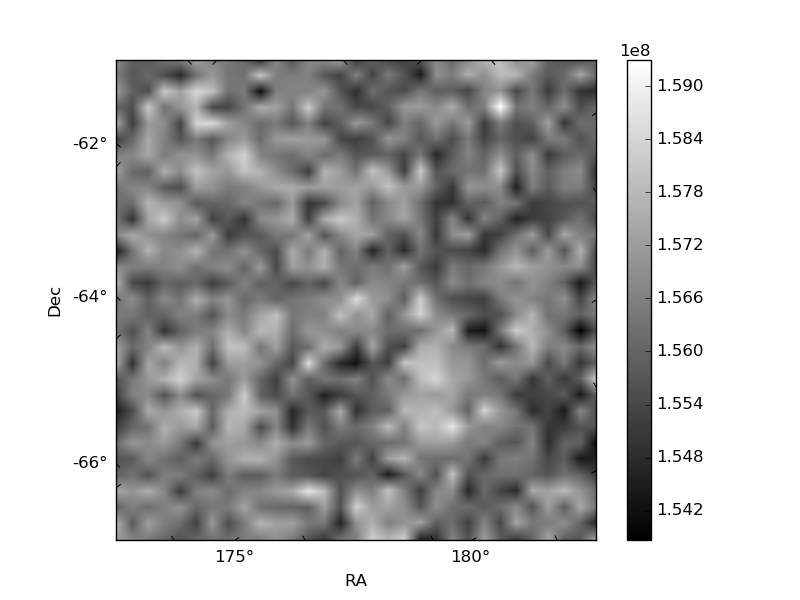
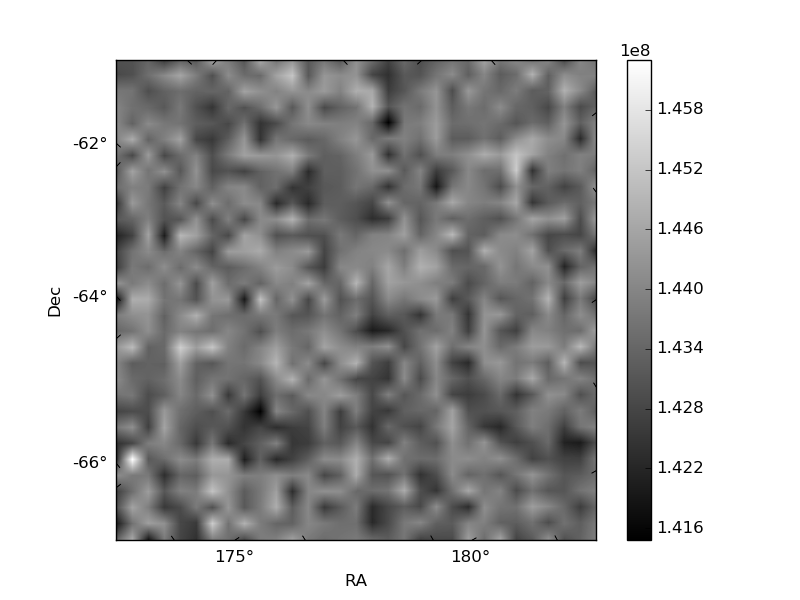
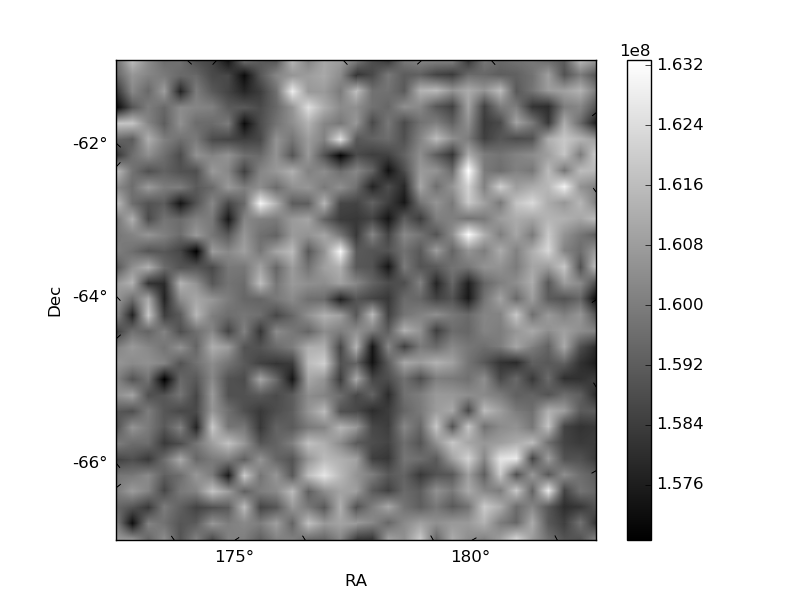
Histogram calculated using DETX and DETY for each event in the final _common_clean file
| Quadrant A | 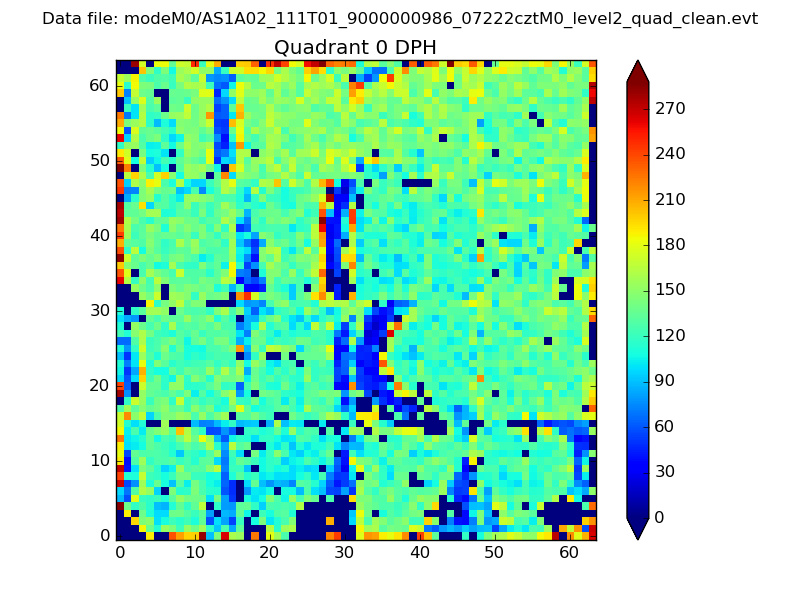 |
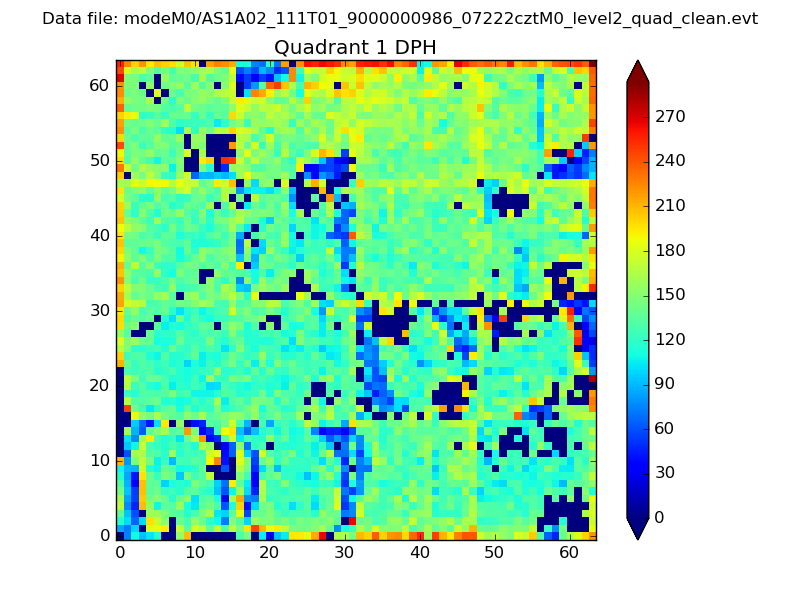 |
Quadrant B |
|---|---|---|---|
| Quadrant D | 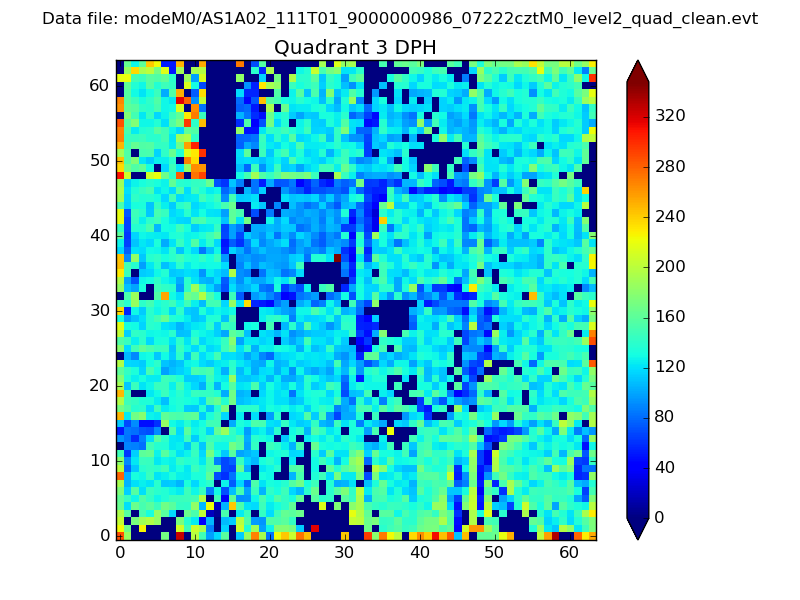 |
 |
Quadrant C |
| Plot type | Count rate plots | Images |
|---|---|---|
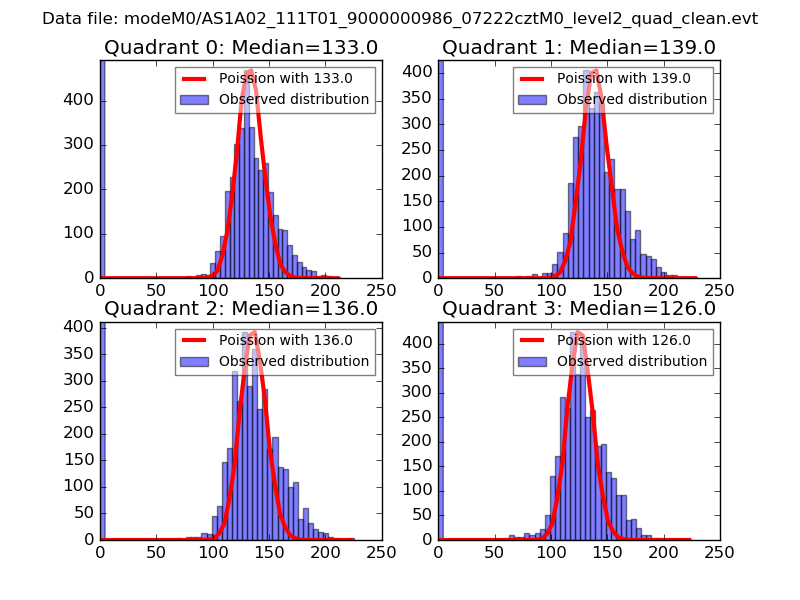
| Comparison with Poisson distribution Blue bars denote a histogram of data divided into 1 sec bins. Red curve is a Poisson curve with rate = median count rate of data. |
 |
 |
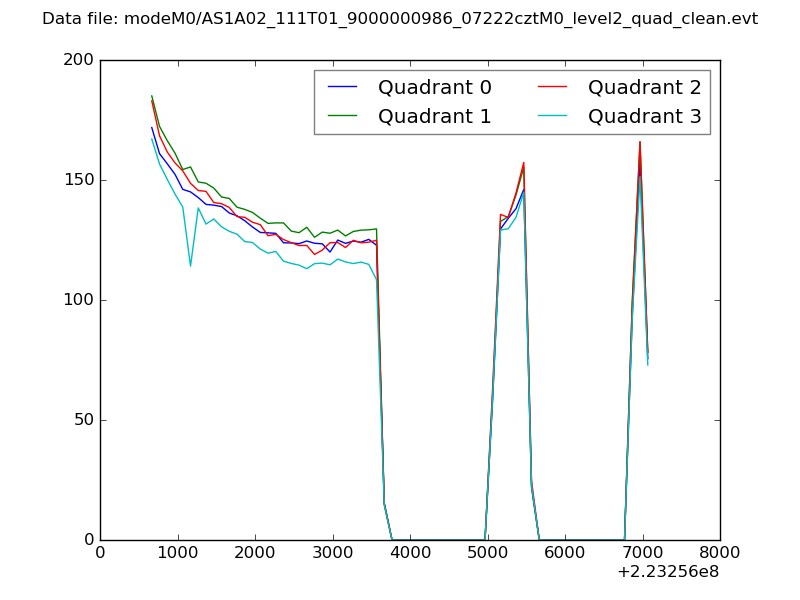
| Quadrant-wise count rates Data is divided into 100 sec bins |
 |
|
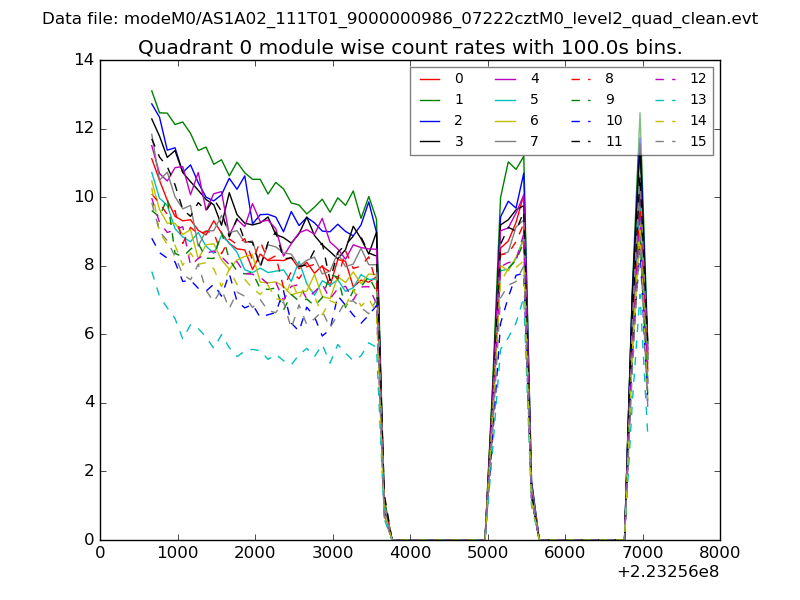
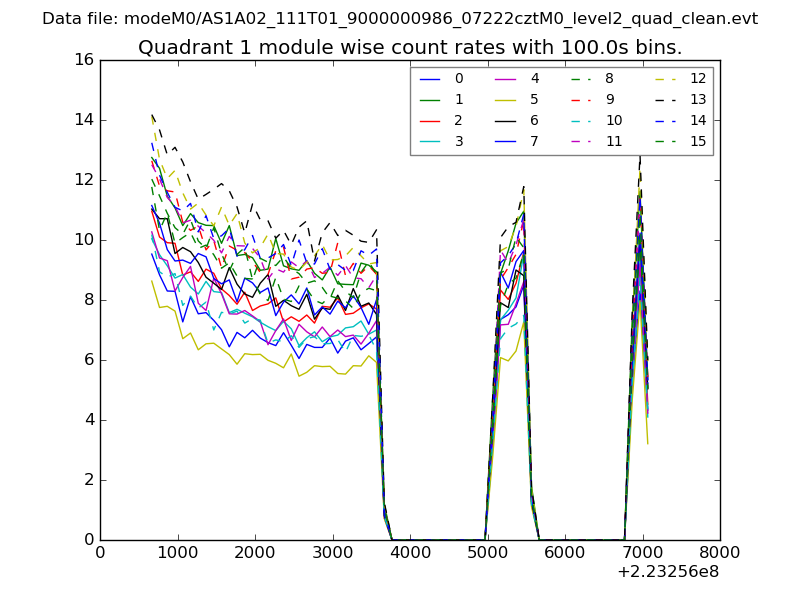
| Module-wise count rates for Quadrant A Data is divided into 100 sec bins |
 |
 |
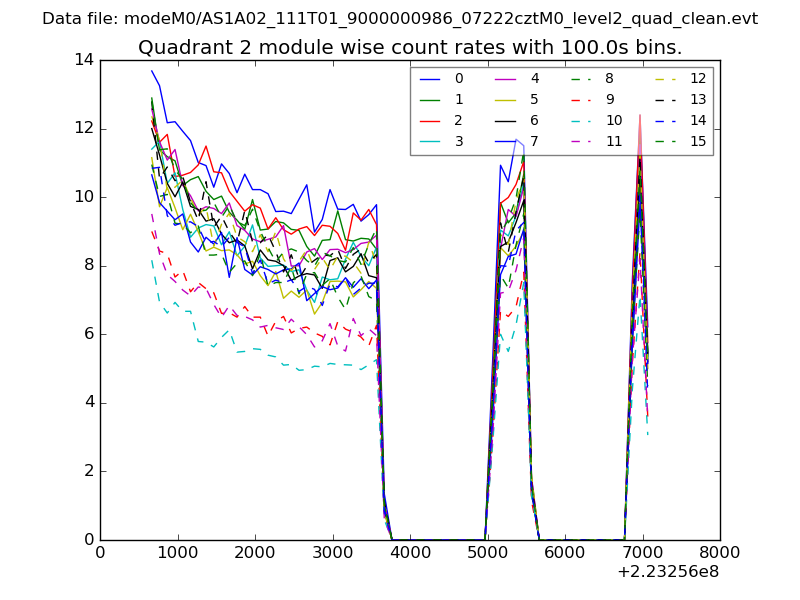
| Module-wise count rates for Quadrant B Data is divided into 100 sec bins |
 |
 |
| Module-wise count rates for Quadrant C Data is divided into 100 sec bins |
 |
 |
| Module-wise count rates for Quadrant D Data is divided into 100 sec bins |
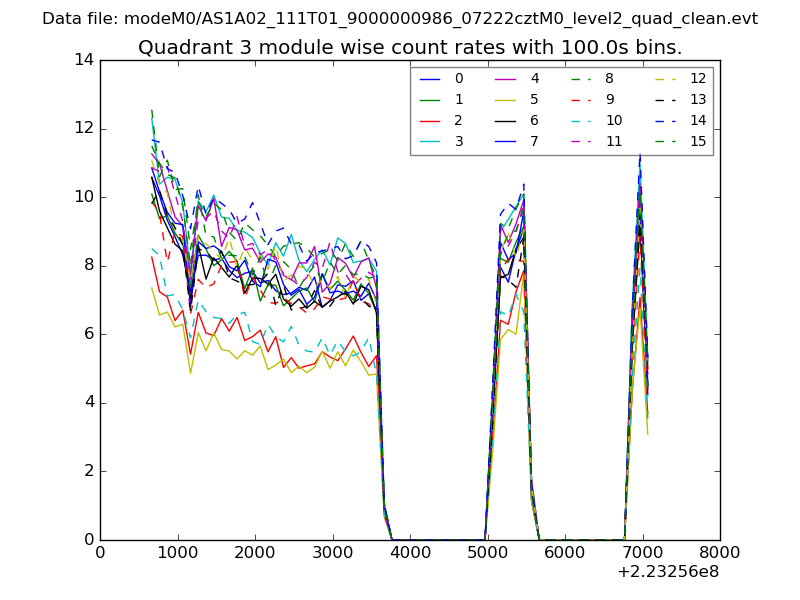 |
 |
| Parameter | Plot |
|---|---|
| CZT HV Monitor | 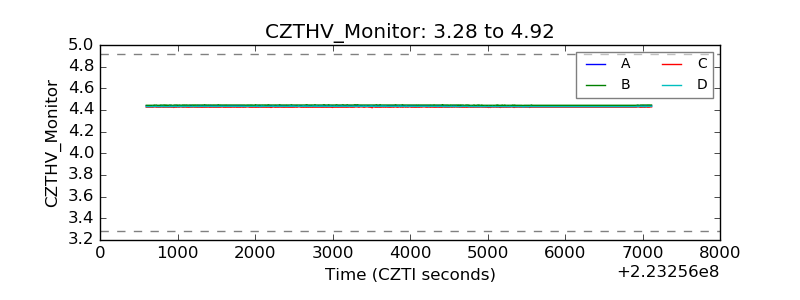 |
| D_VDD | 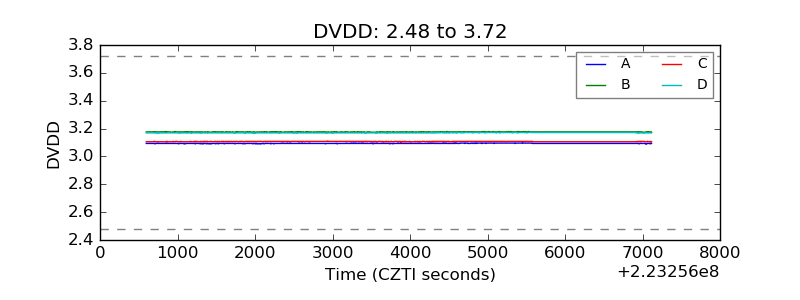 |
| Temperature 1 | 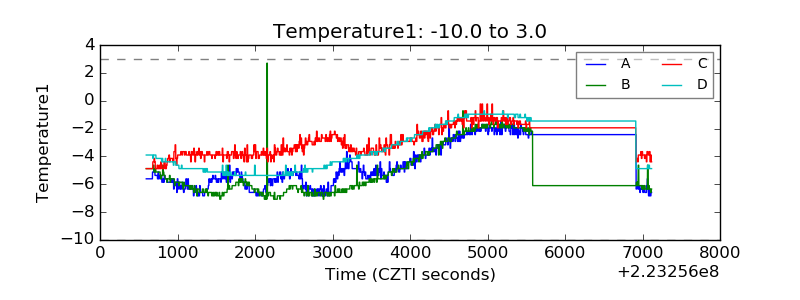 |
| Veto HV Monitor | 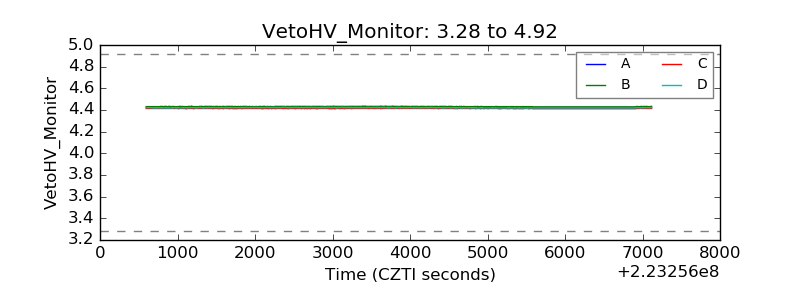 |
| Veto LLD | 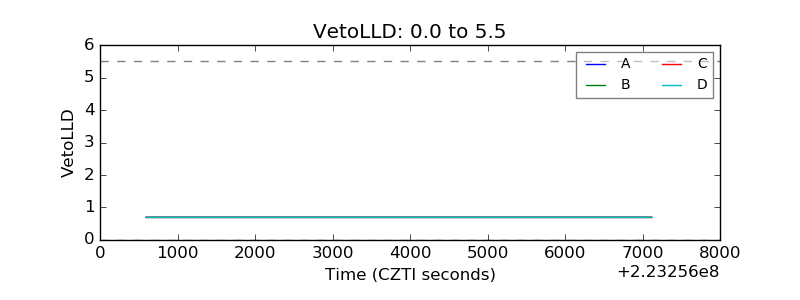 |
| Alpha Counter | 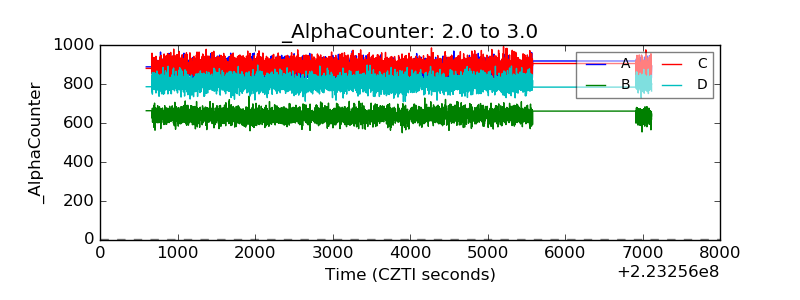 |
| _CPM_Rate | 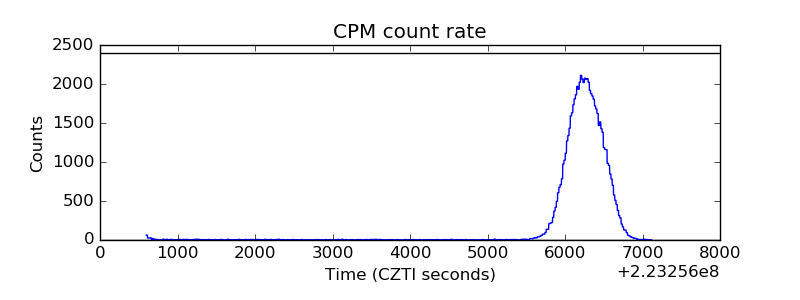 |
| CZT Counter | 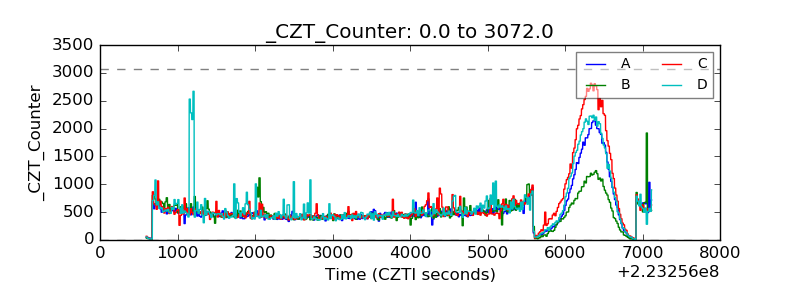 |
| +2.5 Volts monitor | 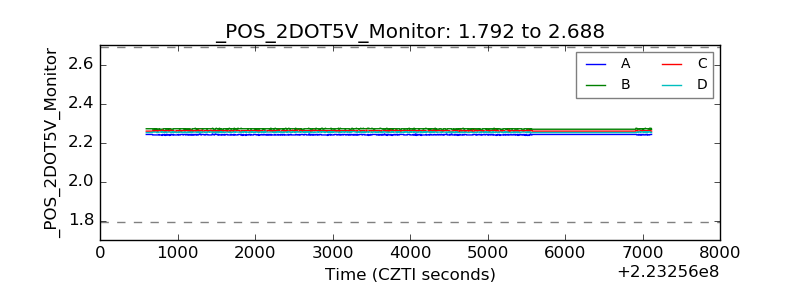 |
| +5 Volts monitor | 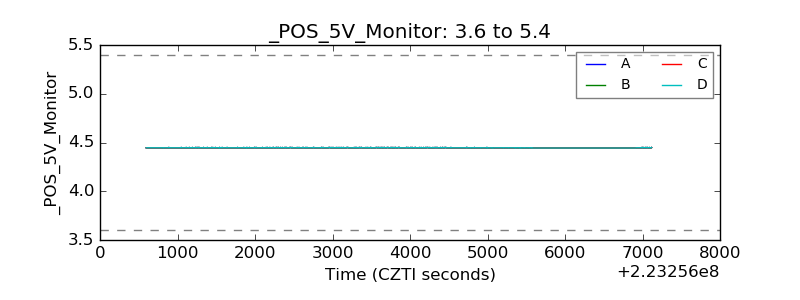 |
| _ROLL_ROT | 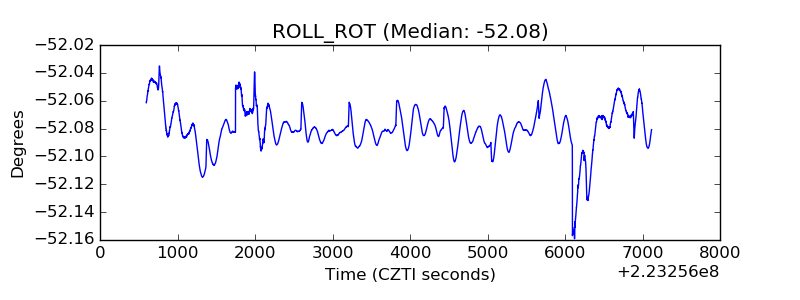 |
| _Roll_DEC | 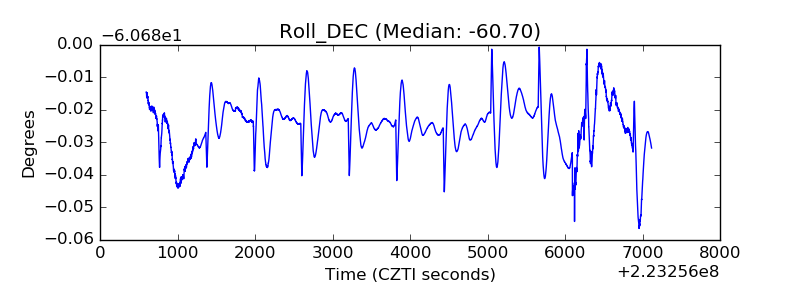 |
| _Roll_RA | 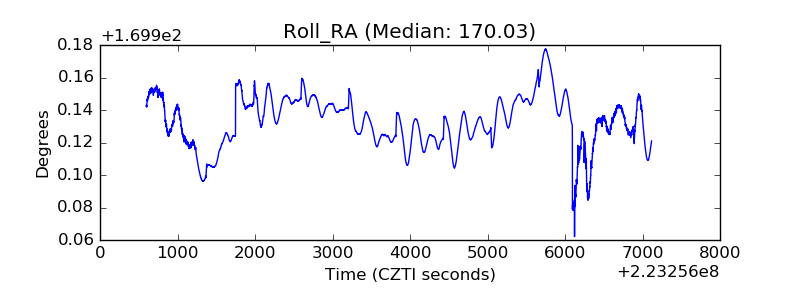 |
| Veto Counter | 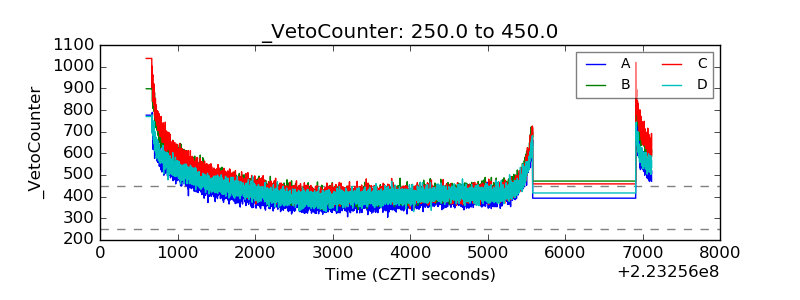 |