| Param | Original file | Final file |
|---|---|---|
| Filename | modeM0/AS1G05_246T03_9000000990cztM0_level2.fits | modeM0/AS1G05_246T03_9000000990cztM0_level2_quad_clean.evt |
| Size (bytes) | 1,117,293,120 | 1,137,994,560 |
| Size | 1.0 GB | 1.1 GB |
| Events in quadrant A | 6,703,028 | 6,796,968 |
| Events in quadrant B | 6,470,958 | 6,767,228 |
| Events in quadrant C | 6,656,864 | 6,571,901 |
| Events in quadrant D | 5,672,398 | 5,997,866 |
| Mode M0 | |||
|---|---|---|---|
| Quadrant | BADHDUFLAG | Total packets | Discarded packets |
| A | 0 | 254167 | 0 |
| B | 0 | 274680 | 0 |
| C | 0 | 274461 | 0 |
| D | 0 | 285750 | 0 |
| Mode M9 | |||
|---|---|---|---|
| Quadrant | BADHDUFLAG | Total packets | Discarded packets |
| A | 0 | 192 | 0 |
| B | 0 | 192 | 0 |
| C | 0 | 192 | 0 |
| D | 0 | 192 | 0 |
| Mode SS | |||
|---|---|---|---|
| Quadrant | BADHDUFLAG | Total packets | Discarded packets |
| A | 0 | 2470 | 0 |
| B | 0 | 2470 | 0 |
| C | 0 | 2470 | 0 |
| D | 0 | 2470 | 0 |
| Quadrant | Total seconds | Saturated seconds | Saturation percentage |
|---|---|---|---|
| A | 121594 | 1624 | 1.335592% |
| B | 121602 | 3515 | 2.890577% |
| C | 121590 | 917 | 0.754174% |
| D | 121595 | 3272 | 2.690900% |
Noise dominated data is calculated using 1-second bins in cleaned event files. If a bin has >2000 counts, and if more than 50% of those come from <1% of pixels, then it is considered to be noise-dominated and hence unusable.
| Quadrant | # 1 sec bins | Bins with >0 counts | Bins with >2000 counts | High rate bins dominated by noise | Noise dominated (total time) | Noise dominated (detector-on time) | Marked lightcurve |
|---|---|---|---|---|---|---|---|
| A | 140683 | 121620 | 0 | 0 | 0.00% | 0.00% |  |
| B | 140683 | 121285 | 0 | 0 | 0.00% | 0.00% |  |
| C | 140683 | 121611 | 0 | 0 | 0.00% | 0.00% |  |
| D | 140683 | 121480 | 0 | 0 | 0.00% | 0.00% |  |
Top three noisy pixels from each quadrant. If the there are fewer than three noisy pixels in the level2.evt file, extra rows are filled as -1
| Pixel properties | Quadrant properties | ||||||
|---|---|---|---|---|---|---|---|
| Quadrant | DetID | PixID | Counts | Sigma | Mean | Median | Sigma |
| A | 0 | 29 | 6492 | 10.94 | 1744 | 1627 | 444.8 |
| A | 7 | 110 | 5725 | 9.21 | 1744 | 1627 | 444.8 |
| A | 0 | 30 | 5014 | 7.61 | 1744 | 1627 | 444.8 |
| B | 2 | 9 | 5821 | 12.35 | 1708 | 1624 | 339.8 |
| B | 5 | 128 | 4339 | 7.99 | 1708 | 1624 | 339.8 |
| B | 14 | 254 | 4335 | 7.98 | 1708 | 1624 | 339.8 |
| C | 1 | 80 | 4815 | 6.84 | 1759 | 1626 | 466.5 |
| C | 1 | 81 | 4778 | 6.76 | 1759 | 1626 | 466.5 |
| C | 12 | 241 | 4596 | 6.37 | 1759 | 1626 | 466.5 |
| D | 3 | 14 | 4277 | 6.39 | 1620 | 1469 | 439.5 |
| D | 6 | 231 | 4206 | 6.23 | 1620 | 1469 | 439.5 |
| D | 7 | 5 | 4161 | 6.12 | 1620 | 1469 | 439.5 |
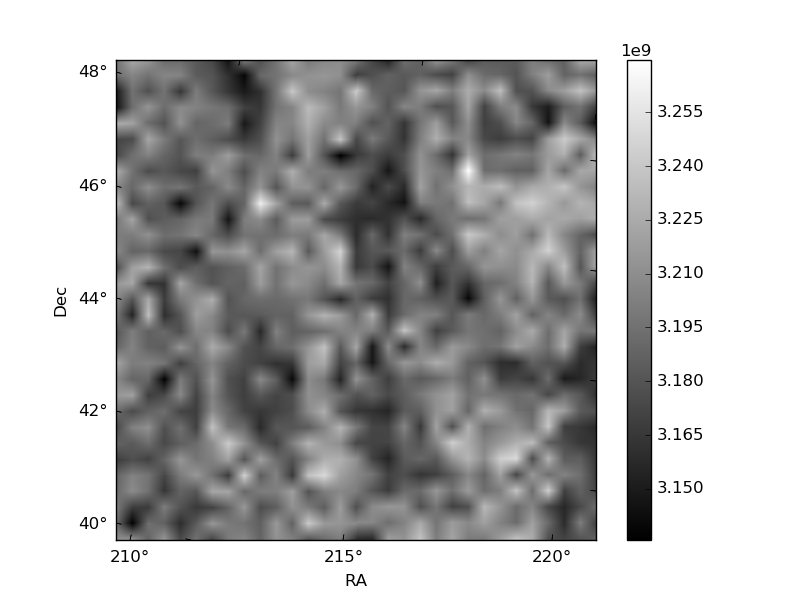
Histogram calculated using DETX and DETY for each event in the final _common_clean file
| Quadrant A |  |
 |
Quadrant B |
|---|---|---|---|
| Quadrant D |  |
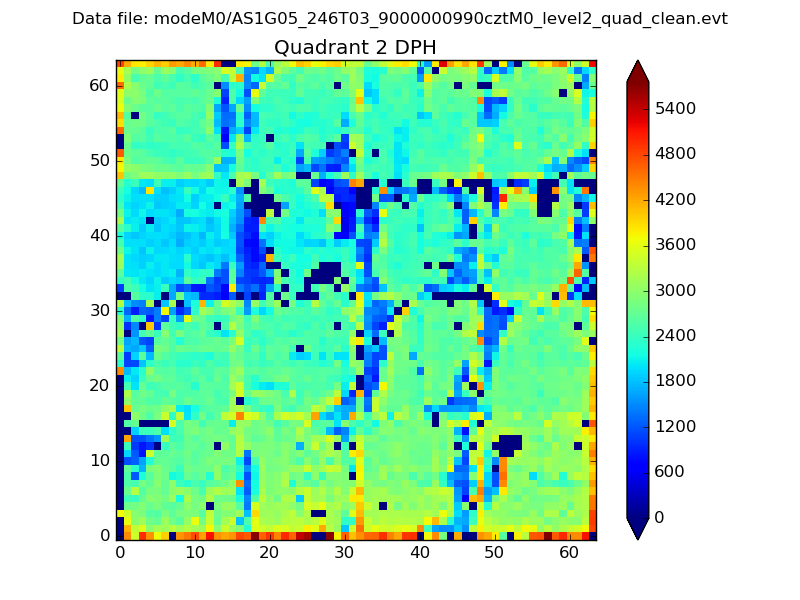 |
Quadrant C |
| Plot type | Count rate plots | Images |
|---|---|---|
| Comparison with Poisson distribution Blue bars denote a histogram of data divided into 1 sec bins. Red curve is a Poisson curve with rate = median count rate of data. |
 |
 |
| Quadrant-wise count rates Data is divided into 100 sec bins |
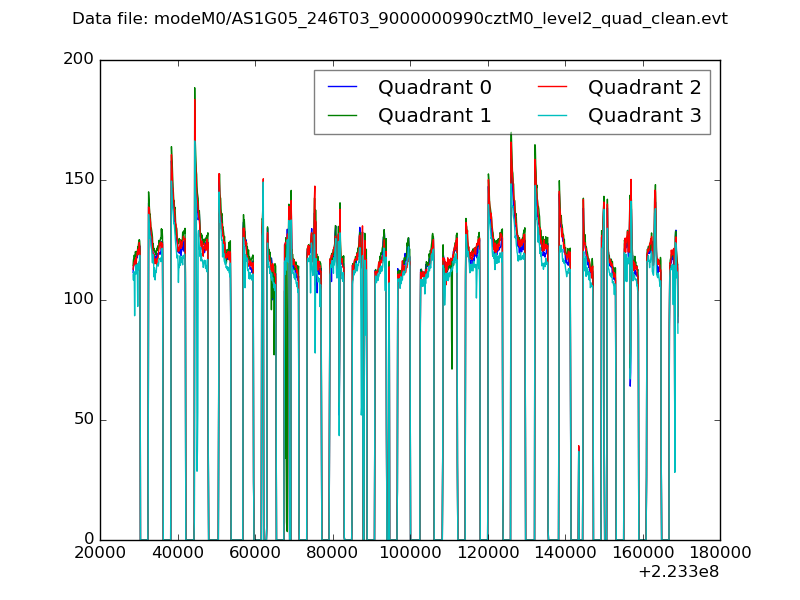 |
|
| Module-wise count rates for Quadrant A Data is divided into 100 sec bins |
 |
 |
| Module-wise count rates for Quadrant B Data is divided into 100 sec bins |
 |
 |
| Module-wise count rates for Quadrant C Data is divided into 100 sec bins |
 |
 |
| Module-wise count rates for Quadrant D Data is divided into 100 sec bins |
 |
 |
| Parameter | Plot |
|---|---|
| CZT HV Monitor |  |
| D_VDD |  |
| Temperature 1 |  |
| Veto HV Monitor | 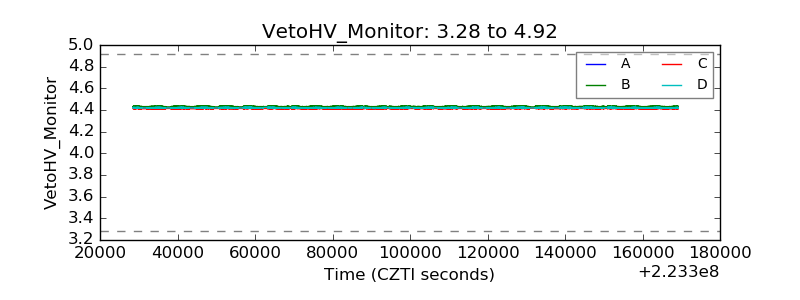 |
| Veto LLD |  |
| Alpha Counter |  |
| _CPM_Rate | 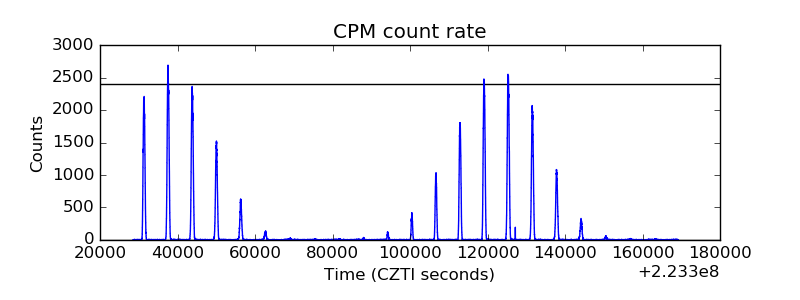 |
| CZT Counter |  |
| +2.5 Volts monitor |  |
| +5 Volts monitor | 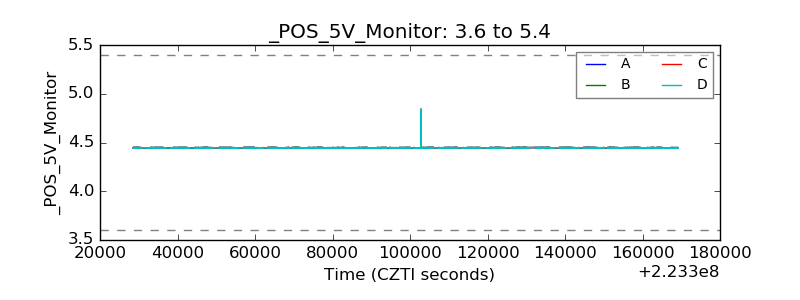 |
| _ROLL_ROT |  |
| _Roll_DEC | 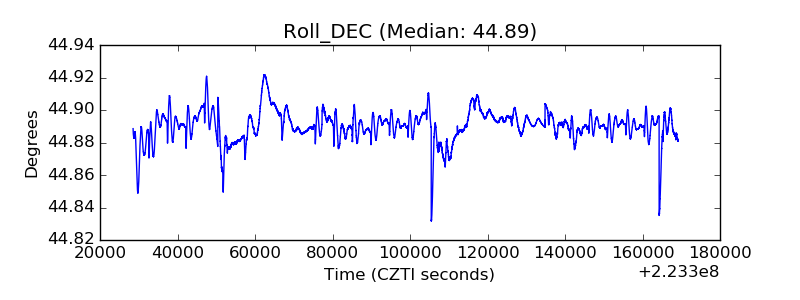 |
| _Roll_RA |  |
| Veto Counter | 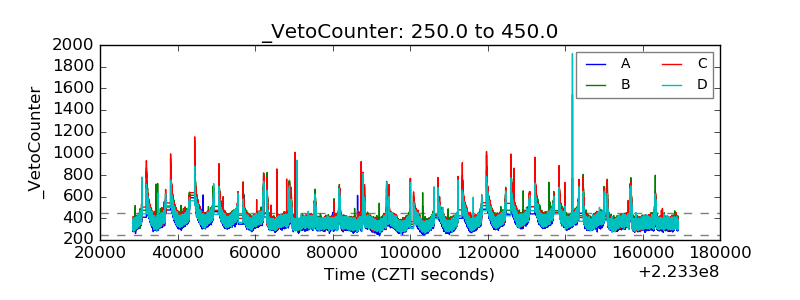 |