| Param | Original file | Final file |
|---|---|---|
| Filename | modeM0/AS1G05_246T03_9000000990_07234cztM0_level2.evt | modeM0/AS1G05_246T03_9000000990_07234cztM0_level2_quad_clean.evt |
| Size (bytes) | 268,309,440 | 49,996,800 |
| Size | 255.9 MB | 47.7 MB |
| Events in quadrant A | 1,799,829 | 317,634 |
| Events in quadrant B | 1,856,578 | 325,693 |
| Events in quadrant C | 2,141,145 | 319,067 |
| Events in quadrant D | 2,088,214 | 302,560 |
| Mode M0 | |||
|---|---|---|---|
| Quadrant | BADHDUFLAG | Total packets | Discarded packets |
| A | 0 | 7645 | 2 |
| B | 0 | 7934 | 1 |
| C | 0 | 8925 | 1 |
| D | 0 | 8649 | 1 |
| Mode M9 | |||
|---|---|---|---|
| Quadrant | BADHDUFLAG | Total packets | Discarded packets |
| A | 0 | 12 | 0 |
| B | 0 | 12 | 0 |
| C | 0 | 12 | 0 |
| D | 0 | 12 | 0 |
| Mode SS | |||
|---|---|---|---|
| Quadrant | BADHDUFLAG | Total packets | Discarded packets |
| A | 0 | 72 | 0 |
| B | 0 | 72 | 0 |
| C | 0 | 72 | 0 |
| D | 0 | 72 | 0 |
| Quadrant | Total seconds | Saturated seconds | Saturation percentage |
|---|---|---|---|
| A | 3513 | 28 | 0.797040% |
| B | 3513 | 54 | 1.537148% |
| C | 3513 | 38 | 1.081697% |
| D | 3513 | 97 | 2.761173% |
Noise dominated data is calculated using 1-second bins in cleaned event files. If a bin has >2000 counts, and if more than 50% of those come from <1% of pixels, then it is considered to be noise-dominated and hence unusable.
| Quadrant | # 1 sec bins | Bins with >0 counts | Bins with >2000 counts | High rate bins dominated by noise | Noise dominated (total time) | Noise dominated (detector-on time) | Marked lightcurve |
|---|---|---|---|---|---|---|---|
| A | 4688 | 3513 | 1 | 1 | 0.02% | 0.03% | 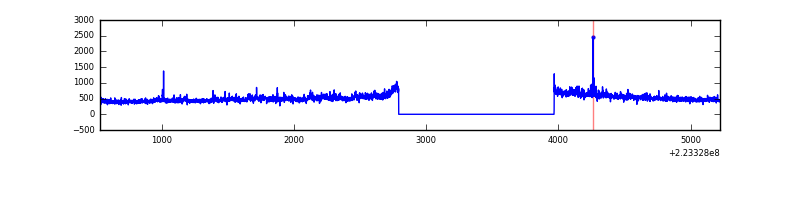 |
| B | 4688 | 3514 | 16 | 16 | 0.34% | 0.46% | 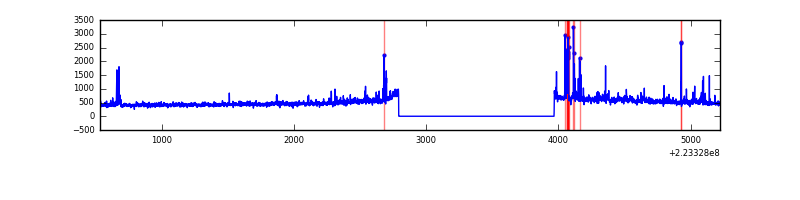 |
| C | 4688 | 3513 | 0 | 0 | 0.00% | 0.00% | 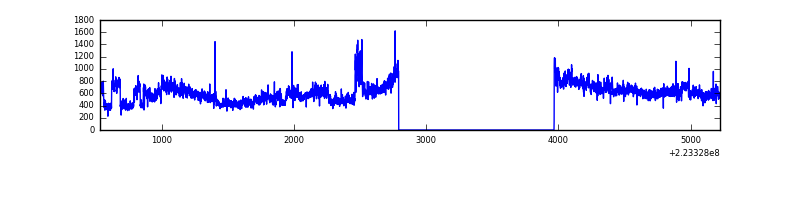 |
| D | 4688 | 3513 | 59 | 59 | 1.26% | 1.68% | 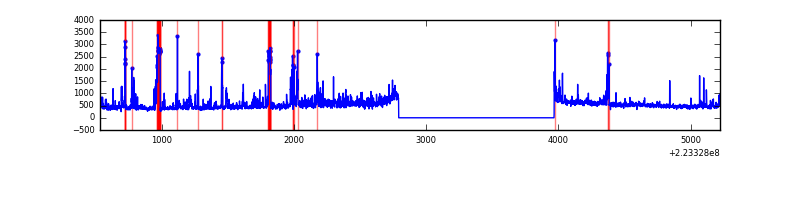 |
Top three noisy pixels from each quadrant. If the there are fewer than three noisy pixels in the level2.evt file, extra rows are filled as -1
| Pixel properties | Quadrant properties | ||||||
|---|---|---|---|---|---|---|---|
| Quadrant | DetID | PixID | Counts | Sigma | Mean | Median | Sigma |
| A | 8 | 15 | 122920 | 1362.91 | 432 | 422 | 89.9 |
| A | 13 | 248 | 8857 | 93.84 | 432 | 422 | 89.9 |
| A | 14 | 111 | 4945 | 50.32 | 432 | 422 | 89.9 |
| B | 0 | 214 | 63577 | 747.83 | 433 | 423 | 84.4 |
| B | 4 | 81 | 60126 | 706.96 | 433 | 423 | 84.4 |
| B | 15 | 85 | 33968 | 397.22 | 433 | 423 | 84.4 |
| C | 9 | 68 | 502559 | 5104.26 | 419 | 421 | 98.4 |
| C | 13 | 61 | 3277 | 29.03 | 419 | 421 | 98.4 |
| C | 12 | 4 | 2103 | 17.1 | 419 | 421 | 98.4 |
| D | 2 | 14 | 219782 | 2153.06 | 414 | 402 | 101.9 |
| D | 2 | 216 | 208019 | 2037.62 | 414 | 402 | 101.9 |
| D | 14 | 34 | 34736 | 336.96 | 414 | 402 | 101.9 |
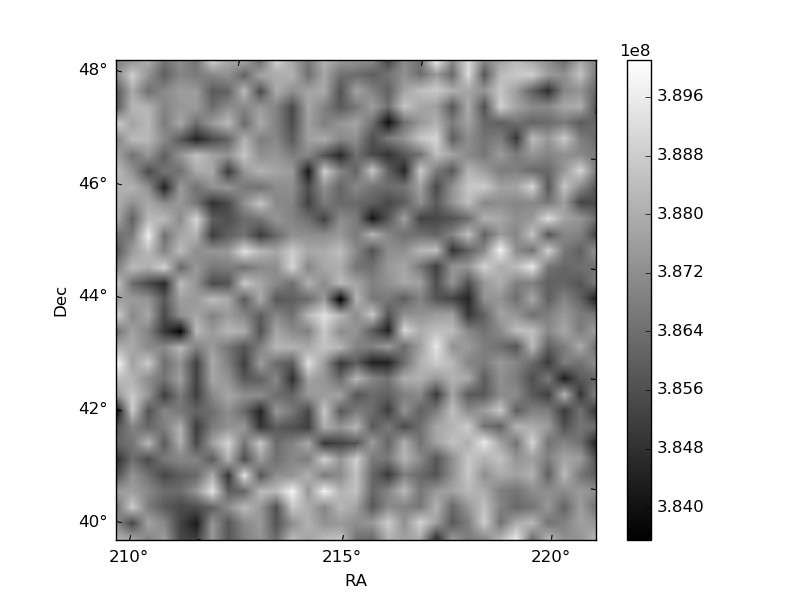
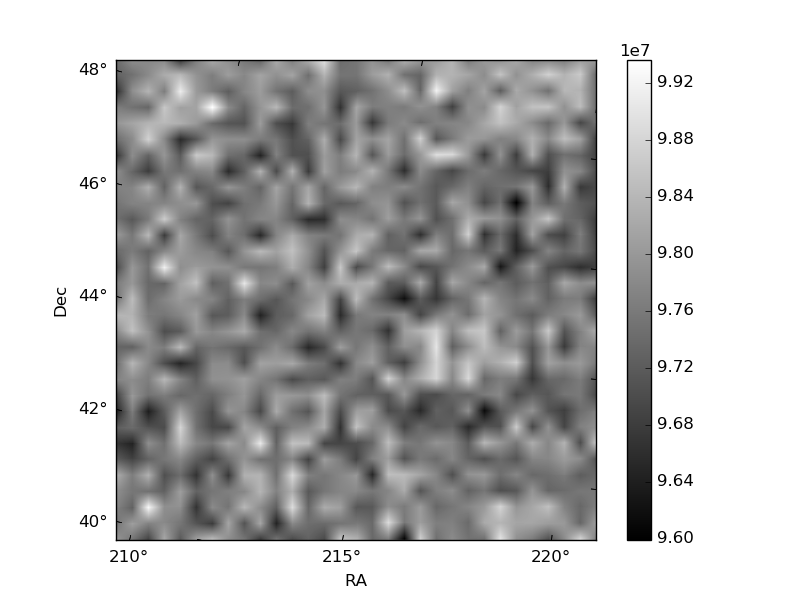
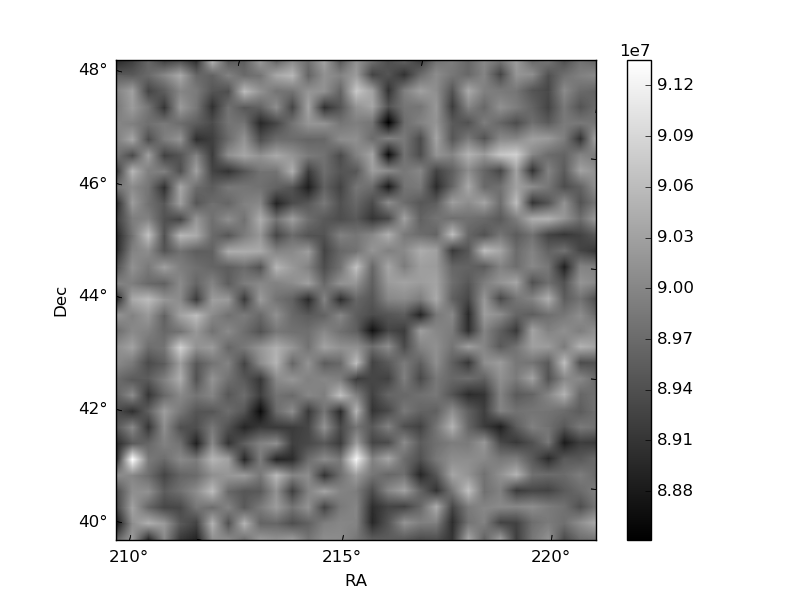
Histogram calculated using DETX and DETY for each event in the final _common_clean file
| Quadrant A | 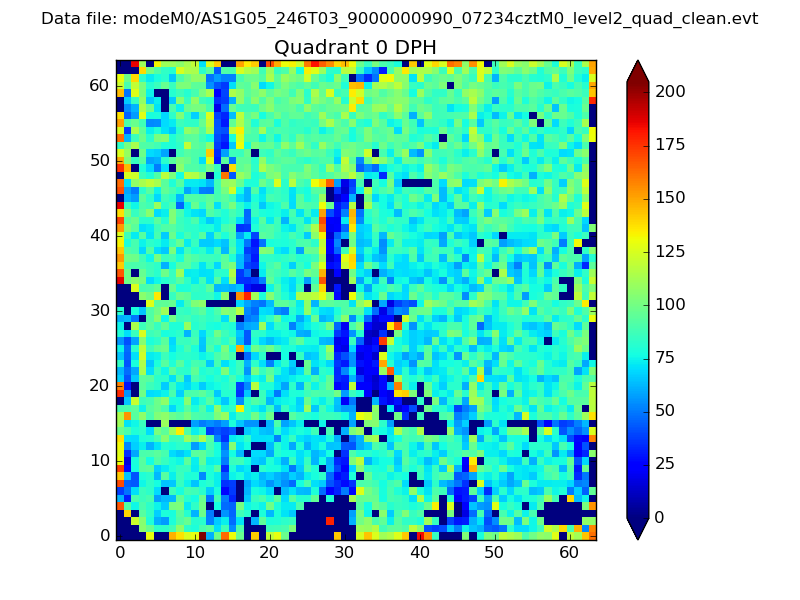 |
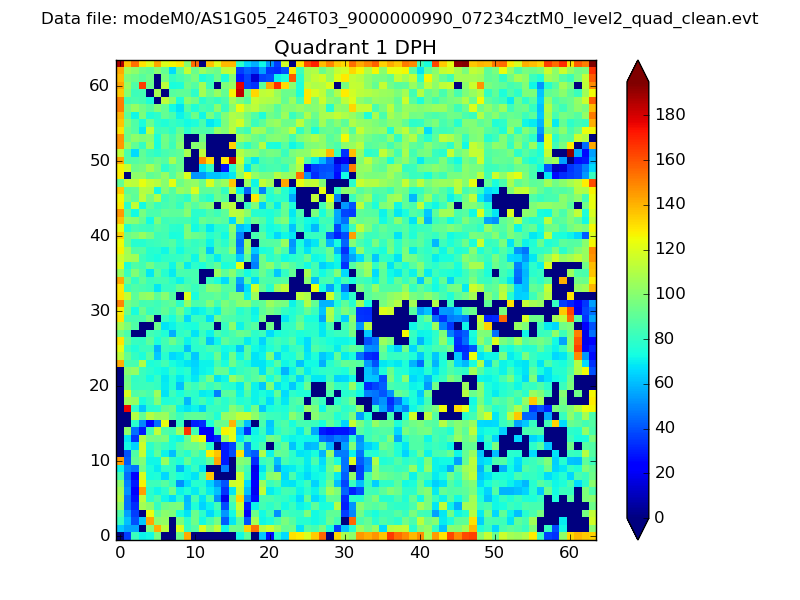 |
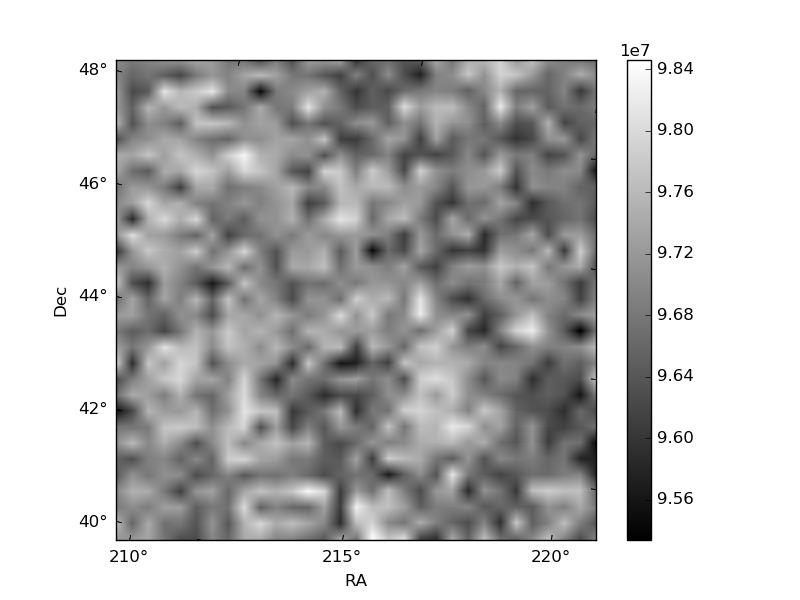
Quadrant B |
|---|---|---|---|
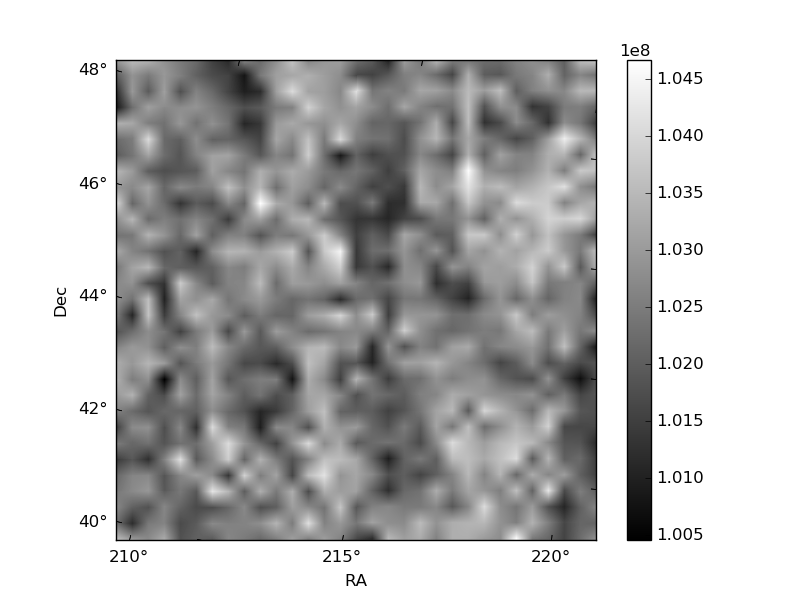
| Quadrant D | 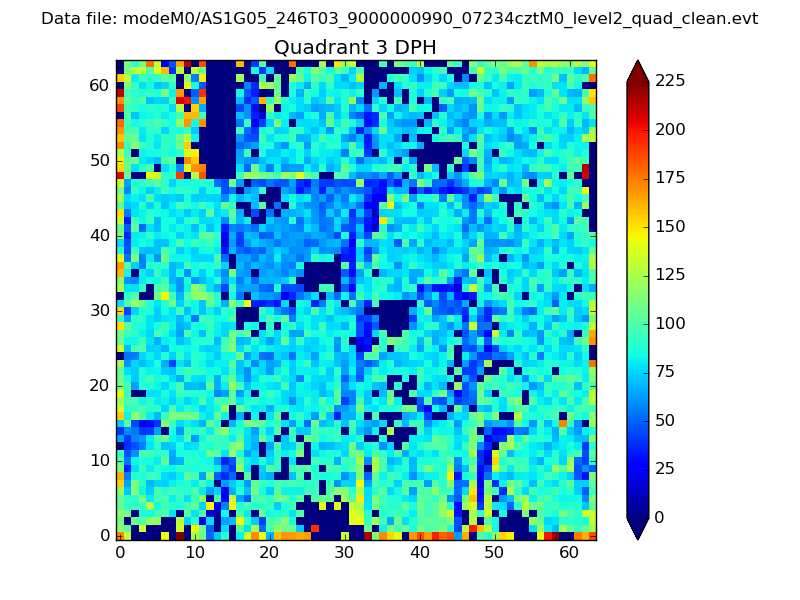 |
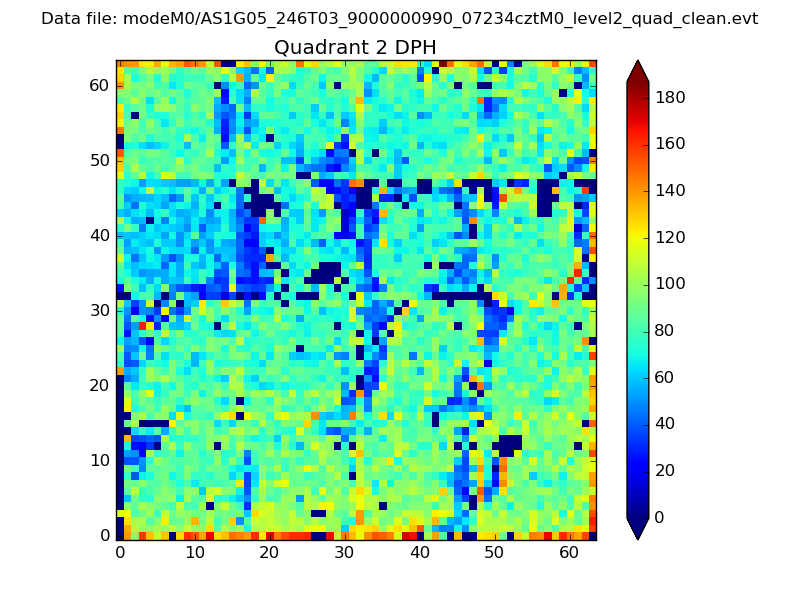 |
Quadrant C |
| Plot type | Count rate plots | Images |
|---|---|---|
| Comparison with Poisson distribution Blue bars denote a histogram of data divided into 1 sec bins. Red curve is a Poisson curve with rate = median count rate of data. |
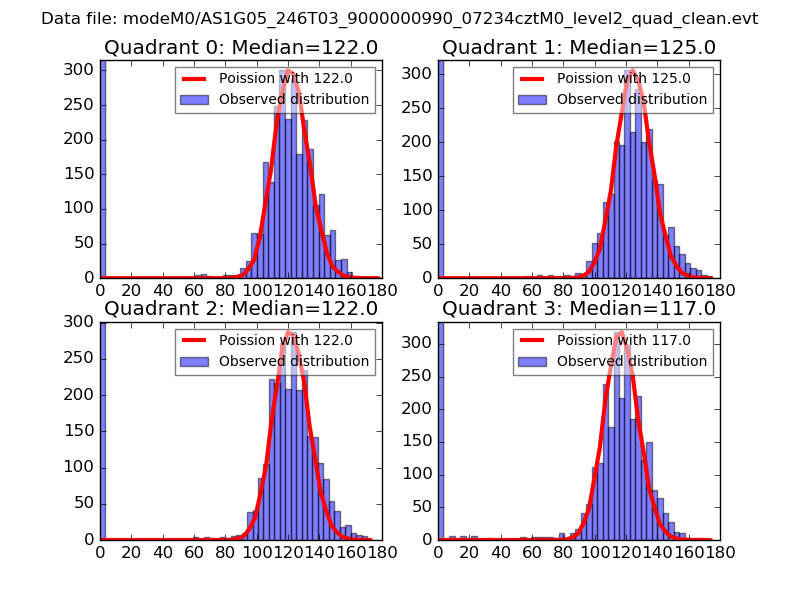 |
 |
| Quadrant-wise count rates Data is divided into 100 sec bins |
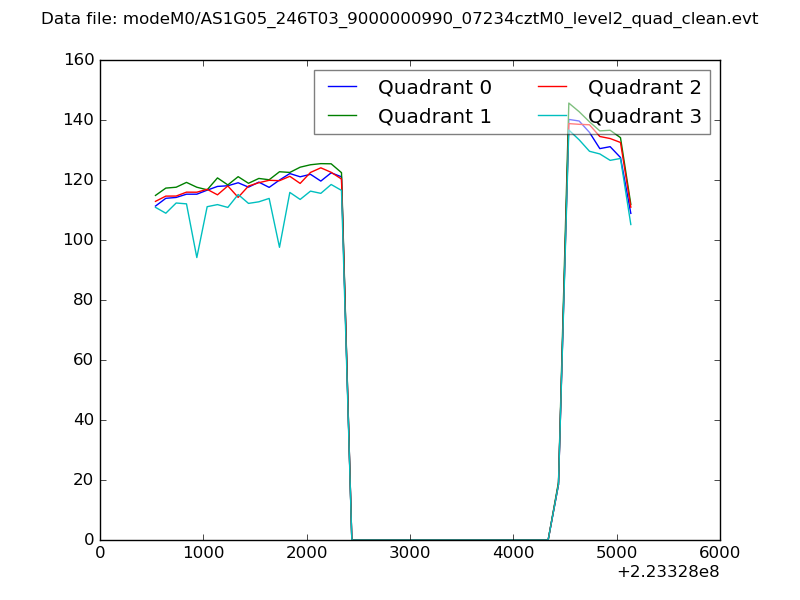 |
|
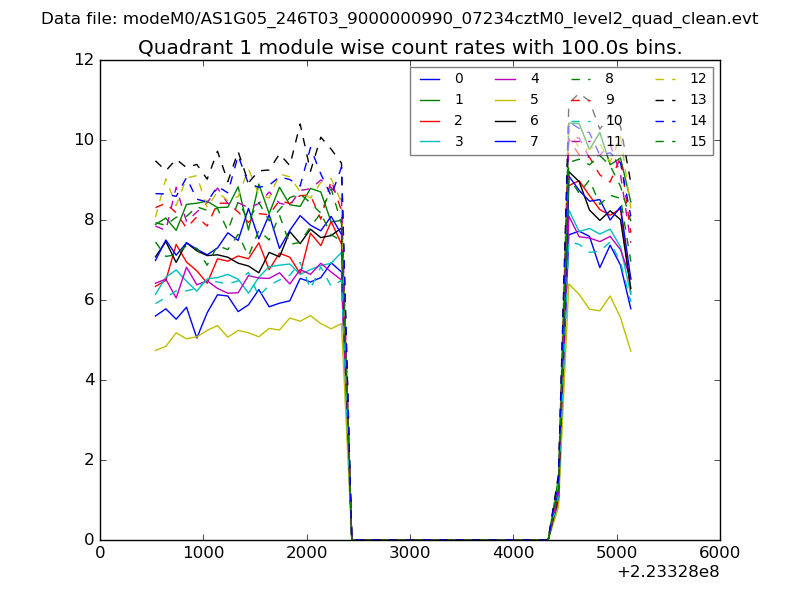
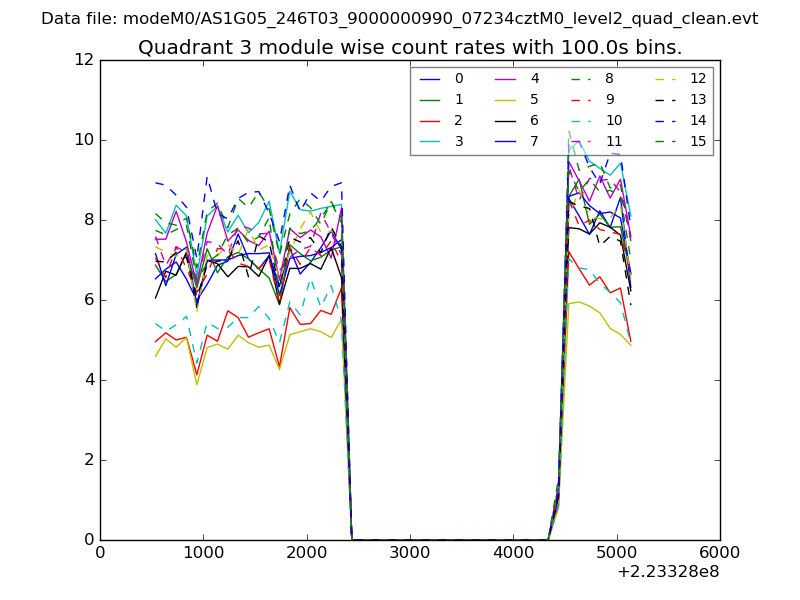
| Module-wise count rates for Quadrant A Data is divided into 100 sec bins |
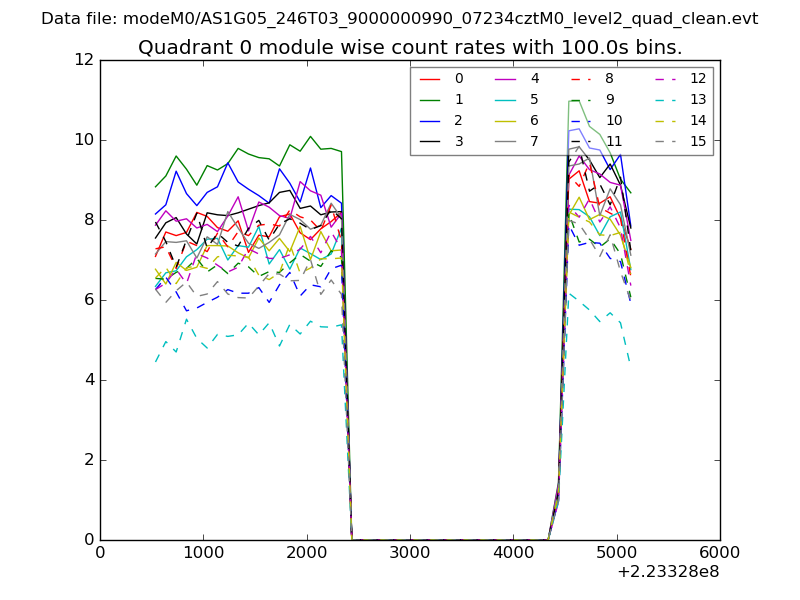 |
 |
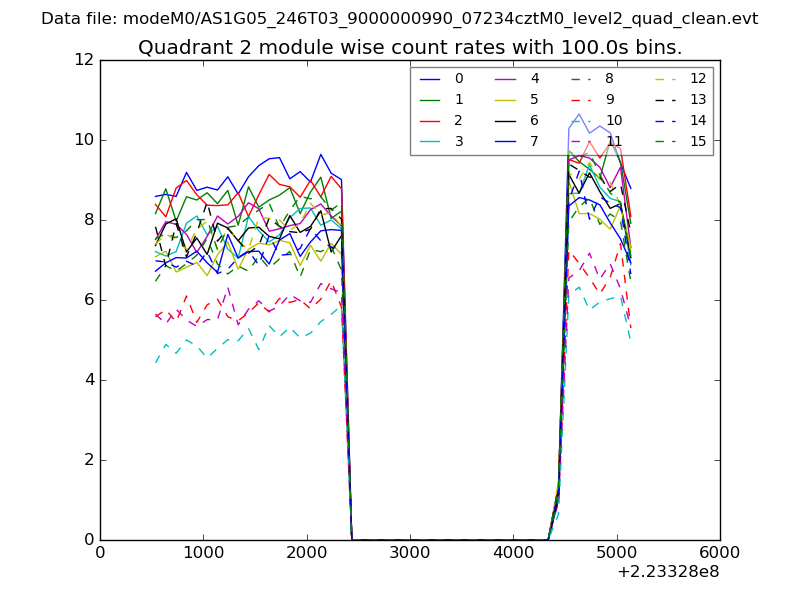
| Module-wise count rates for Quadrant B Data is divided into 100 sec bins |
 |
 |
| Module-wise count rates for Quadrant C Data is divided into 100 sec bins |
 |
 |
| Module-wise count rates for Quadrant D Data is divided into 100 sec bins |
 |
 |
| Parameter | Plot |
|---|---|
| CZT HV Monitor | 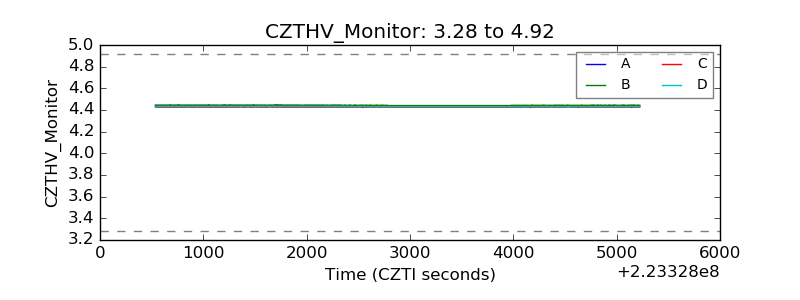 |
| D_VDD | 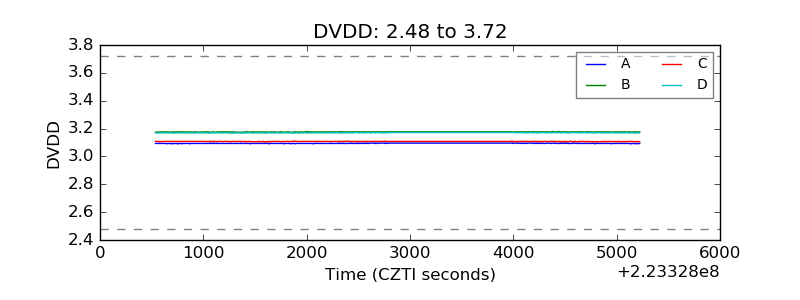 |
| Temperature 1 | 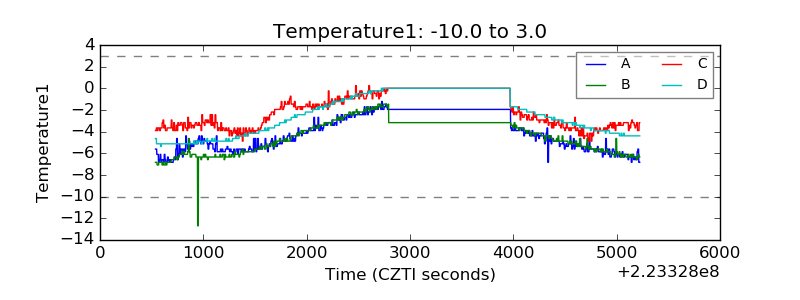 |
| Veto HV Monitor | 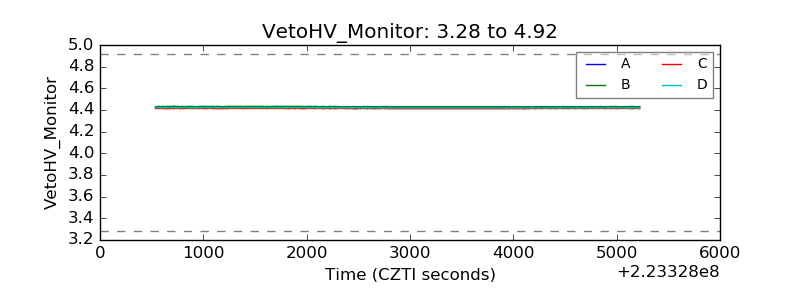 |
| Veto LLD | 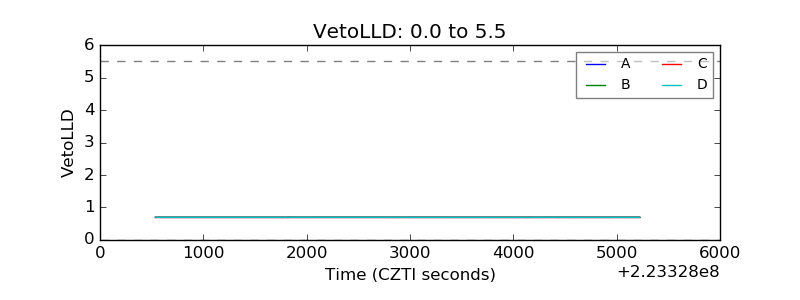 |
| Alpha Counter | 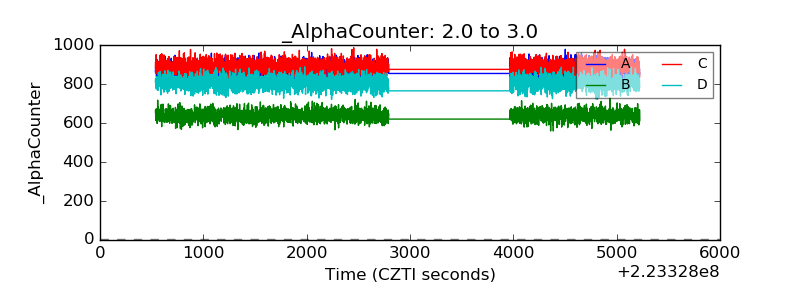 |
| _CPM_Rate | 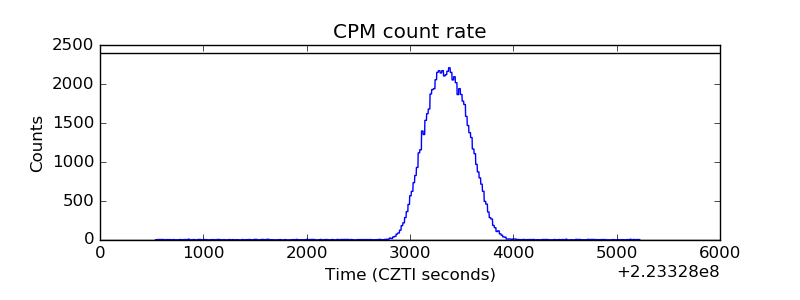 |
| CZT Counter | 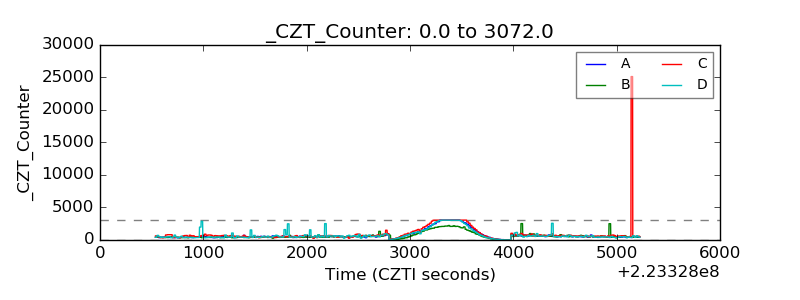 |
| +2.5 Volts monitor | 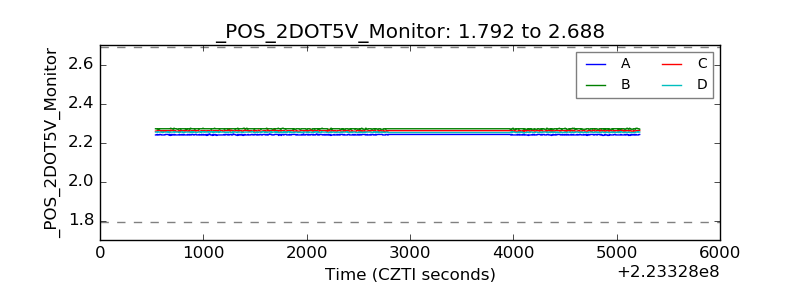 |
| +5 Volts monitor | 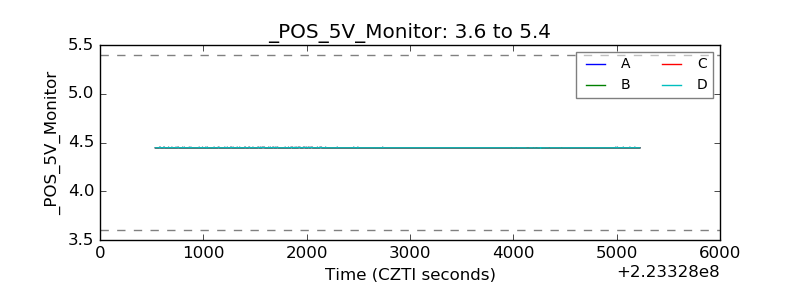 |
| _ROLL_ROT | 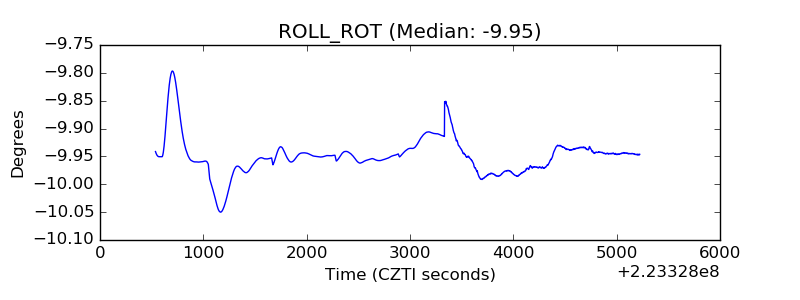 |
| _Roll_DEC | 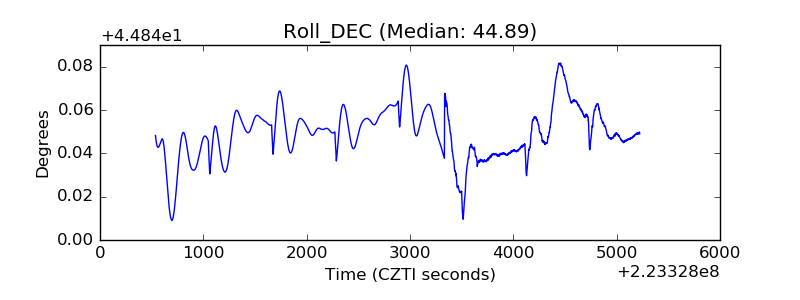 |
| _Roll_RA | 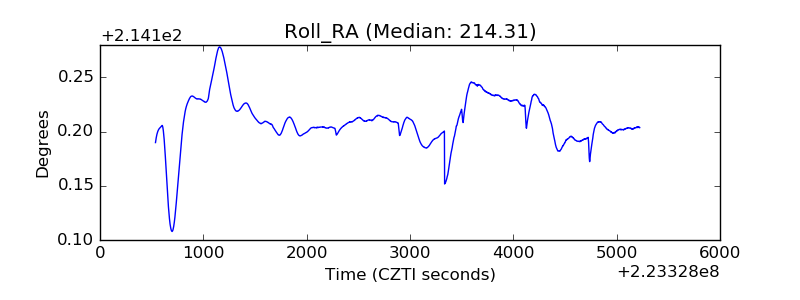 |
| Veto Counter | 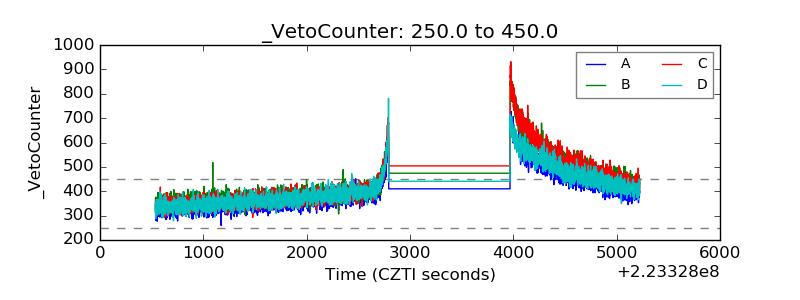 |