| Param | Original file | Final file |
|---|---|---|
| Filename | modeM0/AS1G05_246T03_9000000990_07235cztM0_level2.evt | modeM0/AS1G05_246T03_9000000990_07235cztM0_level2_quad_clean.evt |
| Size (bytes) | 455,725,440 | 98,254,080 |
| Size | 434.6 MB | 93.7 MB |
| Events in quadrant A | 3,112,904 | 632,292 |
| Events in quadrant B | 3,248,948 | 655,569 |
| Events in quadrant C | 3,881,339 | 638,898 |
| Events in quadrant D | 3,132,427 | 611,013 |
| Mode M0 | |||
|---|---|---|---|
| Quadrant | BADHDUFLAG | Total packets | Discarded packets |
| A | 0 | 13379 | 2 |
| B | 0 | 13970 | 1 |
| C | 0 | 15926 | 1 |
| D | 0 | 13847 | 1 |
| Mode M9 | |||
|---|---|---|---|
| Quadrant | BADHDUFLAG | Total packets | Discarded packets |
| A | 0 | 13 | 0 |
| B | 0 | 13 | 0 |
| C | 0 | 13 | 0 |
| D | 0 | 13 | 0 |
| Mode SS | |||
|---|---|---|---|
| Quadrant | BADHDUFLAG | Total packets | Discarded packets |
| A | 0 | 126 | 0 |
| B | 0 | 126 | 0 |
| C | 0 | 126 | 0 |
| D | 0 | 126 | 0 |
| Quadrant | Total seconds | Saturated seconds | Saturation percentage |
|---|---|---|---|
| A | 6279 | 28 | 0.445931% |
| B | 6279 | 52 | 0.828157% |
| C | 6279 | 31 | 0.493709% |
| D | 6279 | 69 | 1.098901% |
Noise dominated data is calculated using 1-second bins in cleaned event files. If a bin has >2000 counts, and if more than 50% of those come from <1% of pixels, then it is considered to be noise-dominated and hence unusable.
| Quadrant | # 1 sec bins | Bins with >0 counts | Bins with >2000 counts | High rate bins dominated by noise | Noise dominated (total time) | Noise dominated (detector-on time) | Marked lightcurve |
|---|---|---|---|---|---|---|---|
| A | 7559 | 6280 | 2 | 2 | 0.03% | 0.03% | 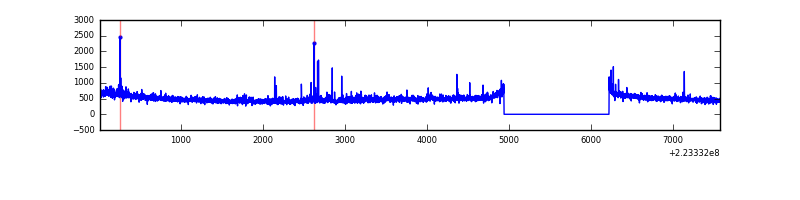 |
| B | 7559 | 6280 | 18 | 18 | 0.24% | 0.29% | 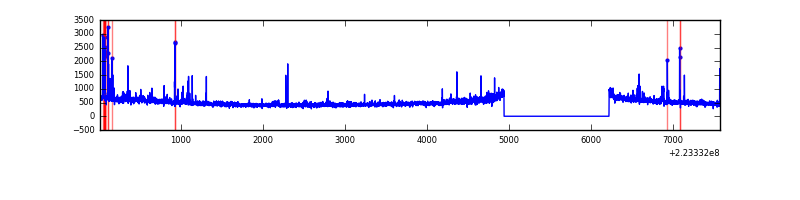 |
| C | 7559 | 6280 | 0 | 0 | 0.00% | 0.00% | 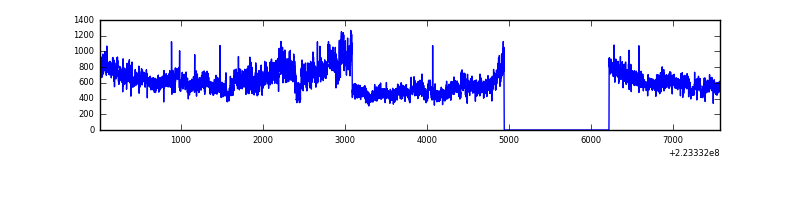 |
| D | 7559 | 6280 | 36 | 36 | 0.48% | 0.57% | 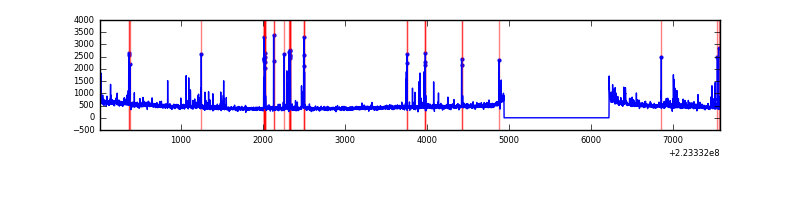 |
Top three noisy pixels from each quadrant. If the there are fewer than three noisy pixels in the level2.evt file, extra rows are filled as -1
| Pixel properties | Quadrant properties | ||||||
|---|---|---|---|---|---|---|---|
| Quadrant | DetID | PixID | Counts | Sigma | Mean | Median | Sigma |
| A | 8 | 15 | 136850 | 884.19 | 757 | 744 | 153.9 |
| A | 13 | 248 | 37452 | 238.47 | 757 | 744 | 153.9 |
| A | 3 | 1 | 11905 | 72.51 | 757 | 744 | 153.9 |
| B | 0 | 214 | 118084 | 810.77 | 770 | 753 | 144.7 |
| B | 4 | 81 | 46919 | 319.01 | 770 | 753 | 144.7 |
| B | 15 | 85 | 30662 | 206.67 | 770 | 753 | 144.7 |
| C | 9 | 68 | 971950 | 5629.04 | 745 | 749 | 172.5 |
| C | 13 | 61 | 5812 | 29.34 | 745 | 749 | 172.5 |
| C | 8 | 222 | 2101 | 7.84 | 745 | 749 | 172.5 |
| D | 2 | 14 | 189732 | 1040.51 | 737 | 714 | 181.7 |
| D | 2 | 216 | 77980 | 425.34 | 737 | 714 | 181.7 |
| D | 14 | 34 | 32820 | 176.74 | 737 | 714 | 181.7 |
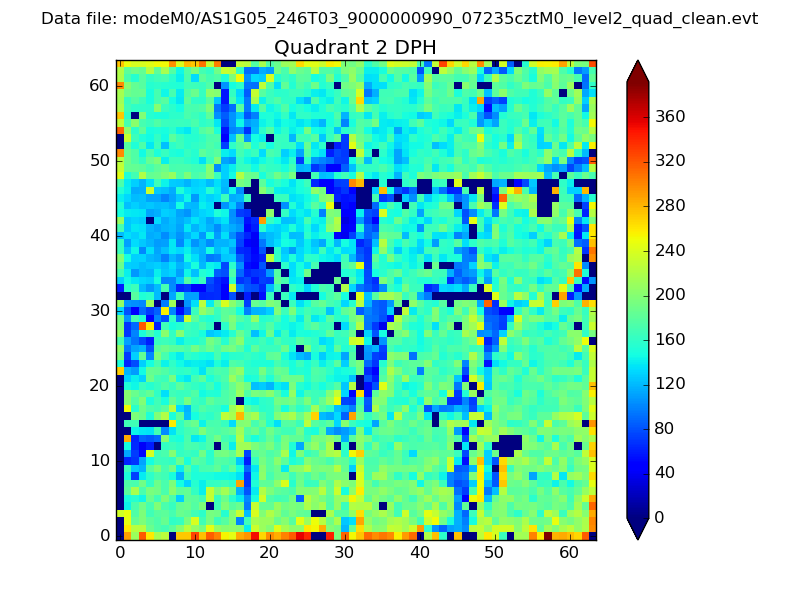
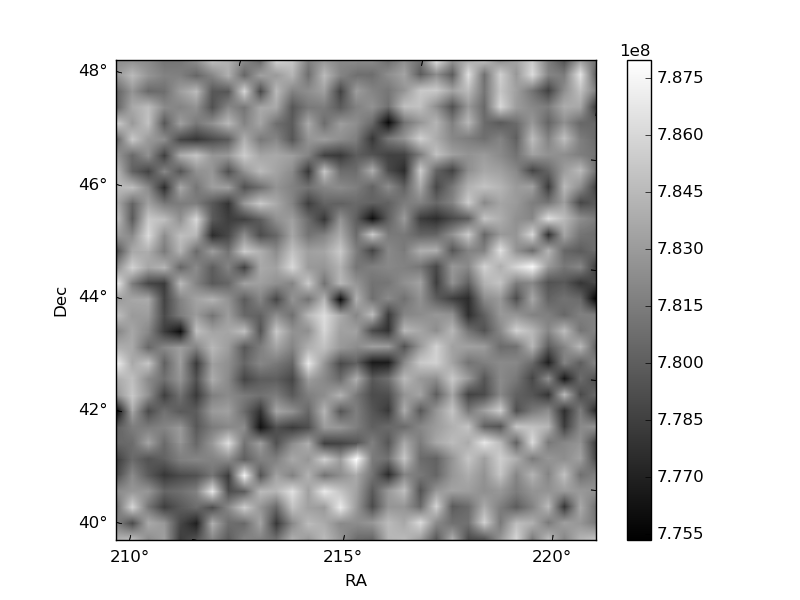
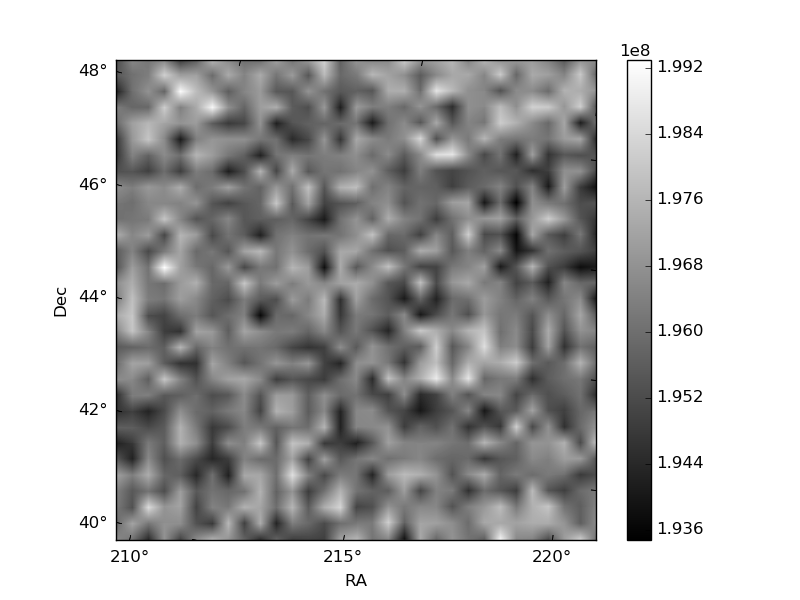
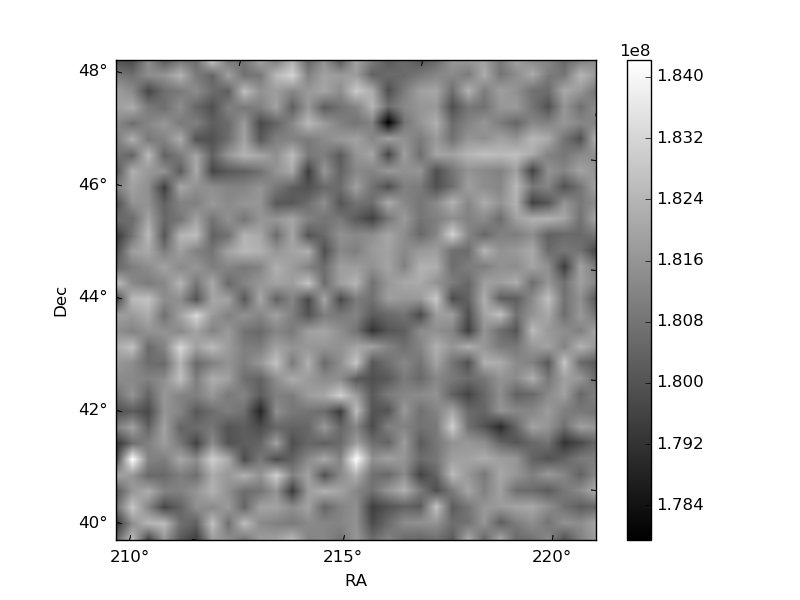
Histogram calculated using DETX and DETY for each event in the final _common_clean file
| Quadrant A | 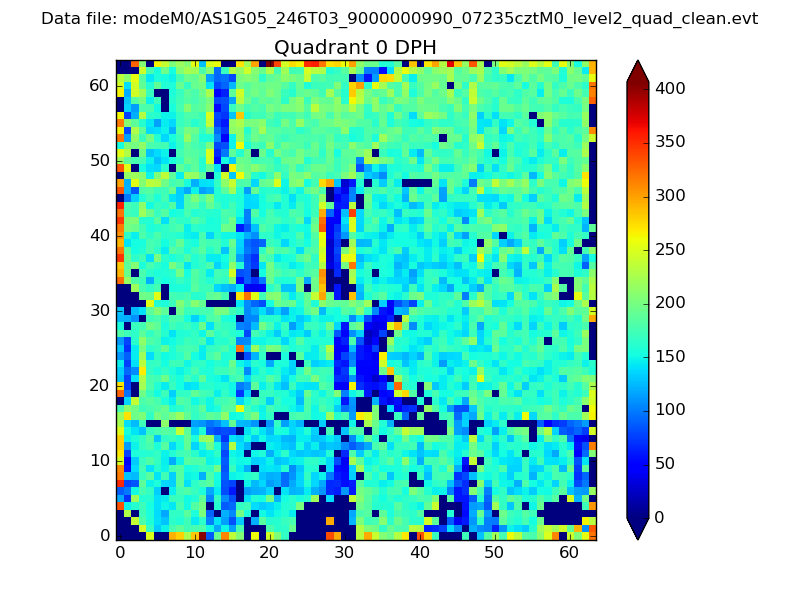 |
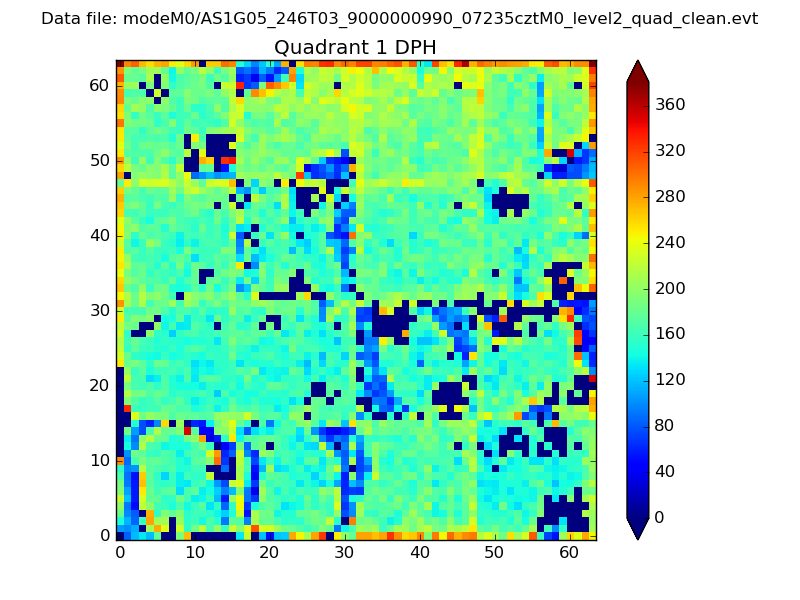 |
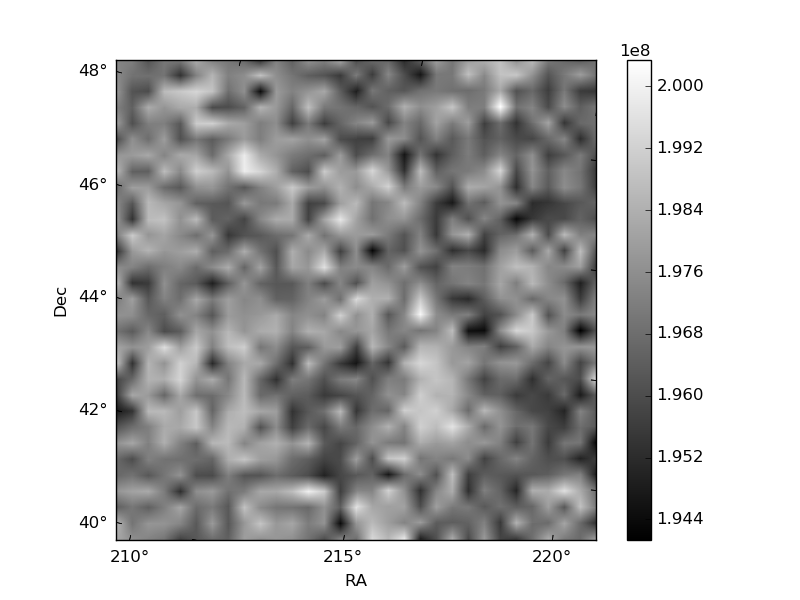
Quadrant B |
|---|---|---|---|
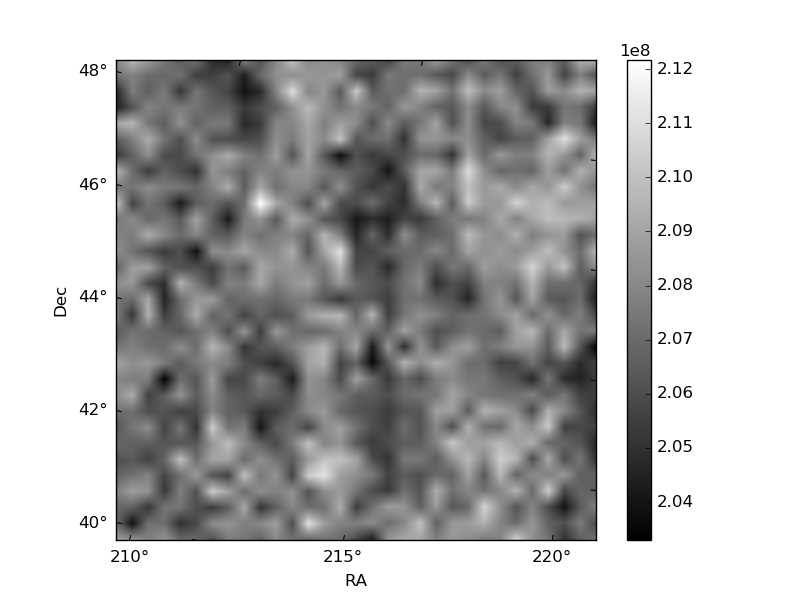
| Quadrant D | 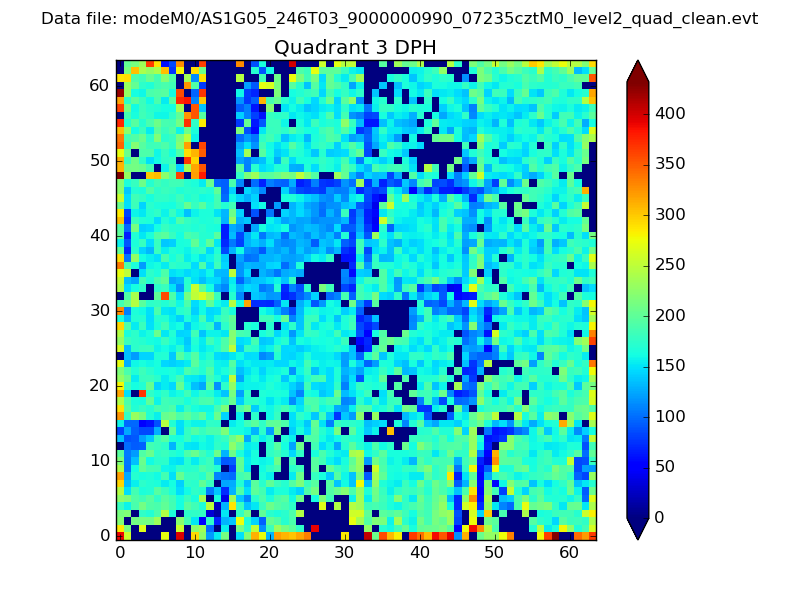 |
 |
Quadrant C |
| Plot type | Count rate plots | Images |
|---|---|---|
| Comparison with Poisson distribution Blue bars denote a histogram of data divided into 1 sec bins. Red curve is a Poisson curve with rate = median count rate of data. |
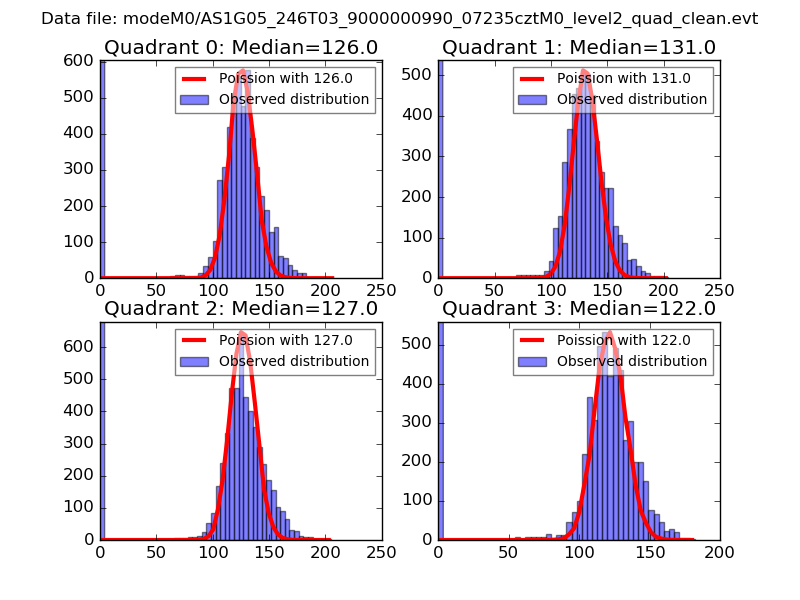 |
 |
| Quadrant-wise count rates Data is divided into 100 sec bins |
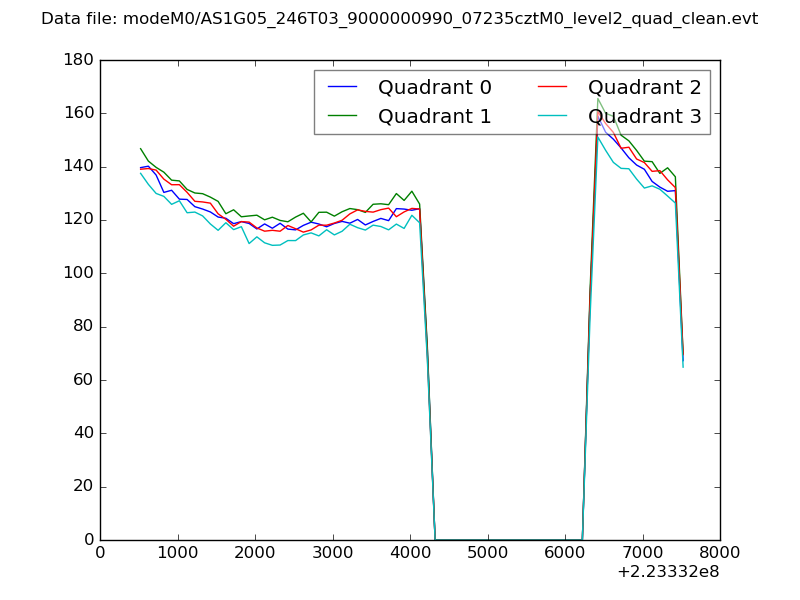 |
|
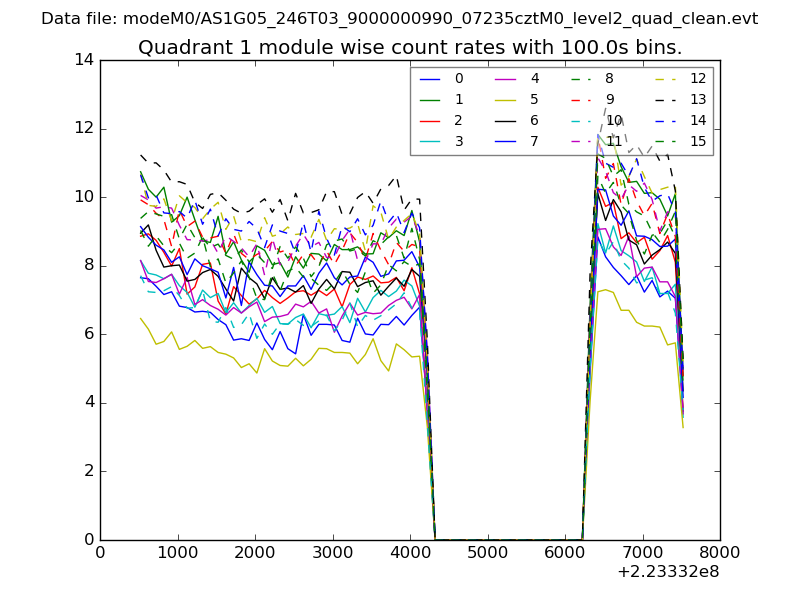
| Module-wise count rates for Quadrant A Data is divided into 100 sec bins |
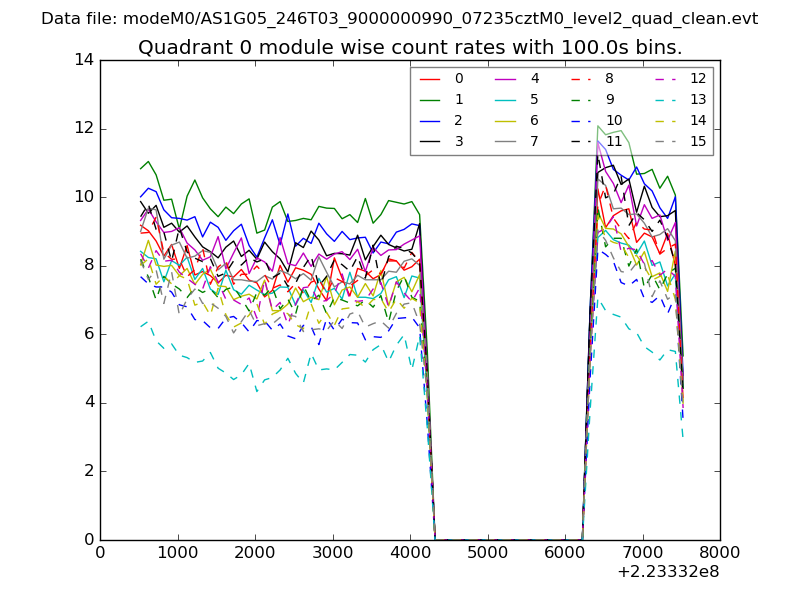 |
 |
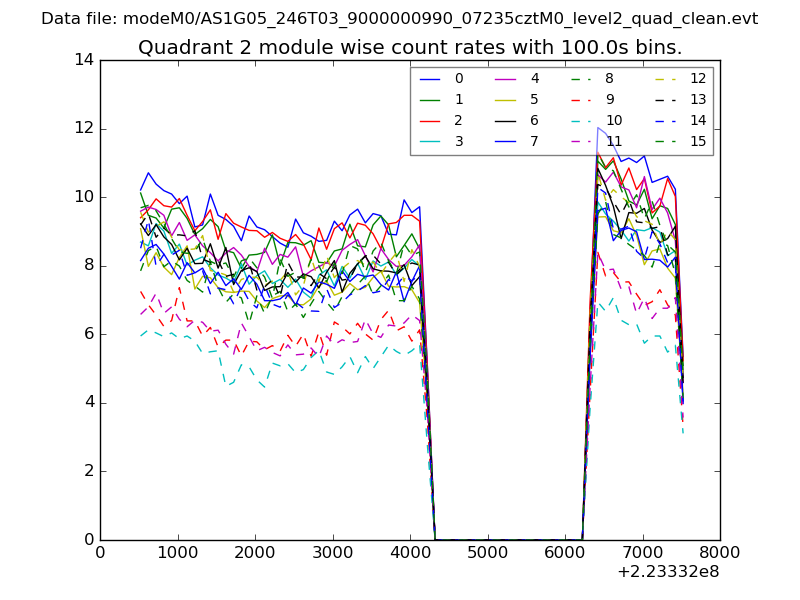
| Module-wise count rates for Quadrant B Data is divided into 100 sec bins |
 |
 |
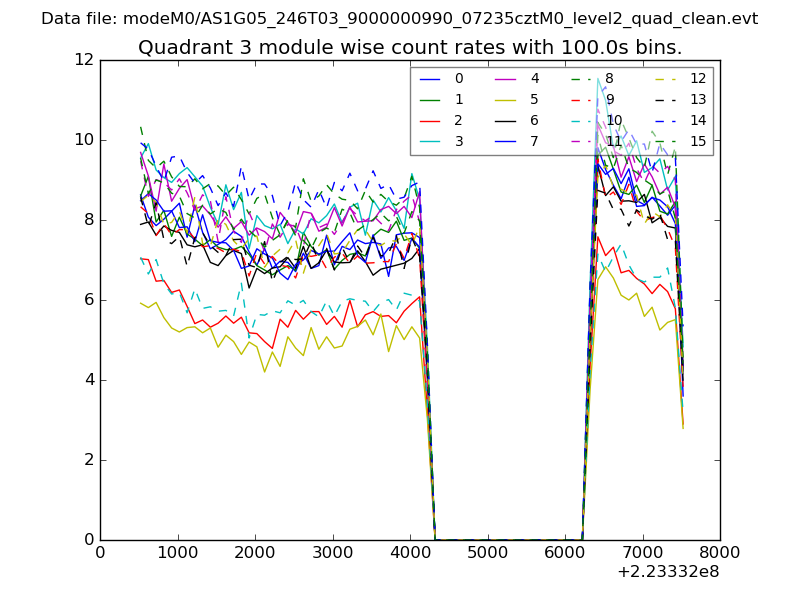
| Module-wise count rates for Quadrant C Data is divided into 100 sec bins |
 |
 |
| Module-wise count rates for Quadrant D Data is divided into 100 sec bins |
 |
 |
| Parameter | Plot |
|---|---|
| CZT HV Monitor | 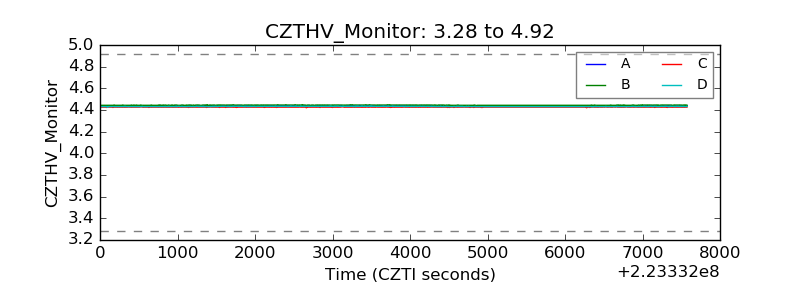 |
| D_VDD | 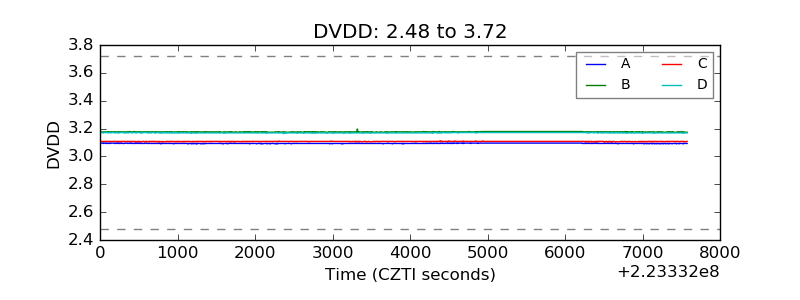 |
| Temperature 1 | 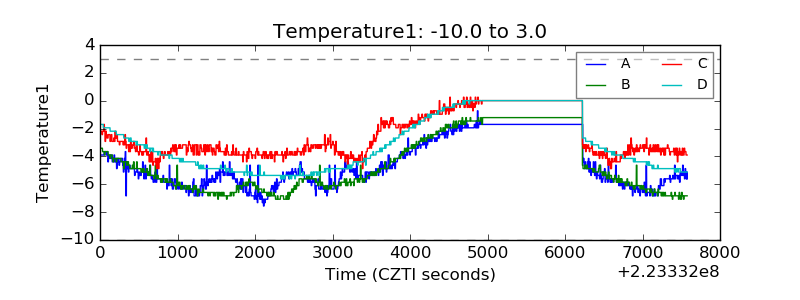 |
| Veto HV Monitor | 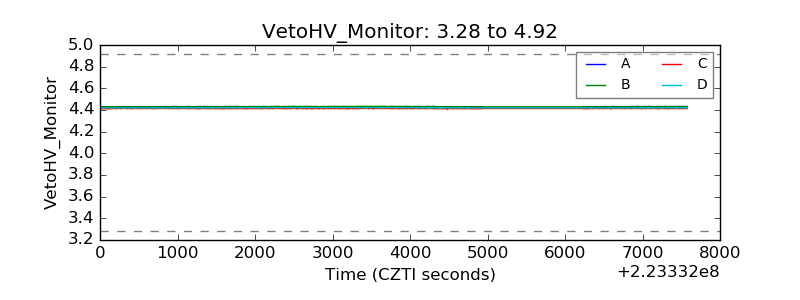 |
| Veto LLD | 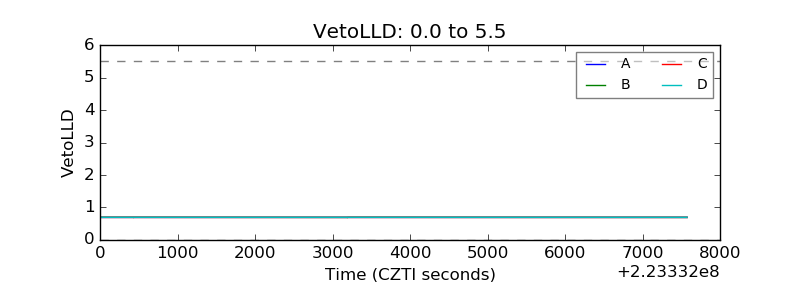 |
| Alpha Counter | 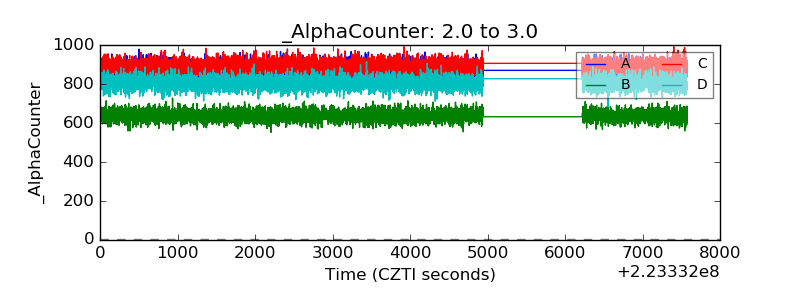 |
| _CPM_Rate | 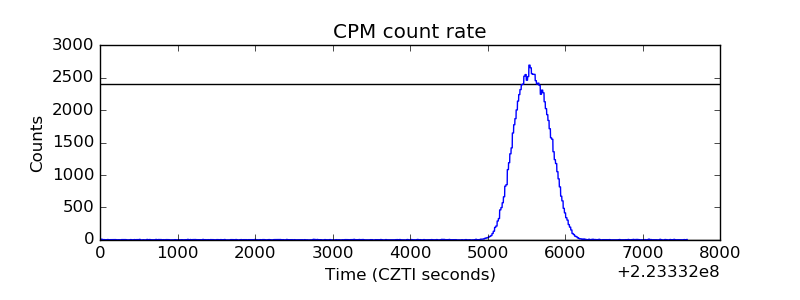 |
| CZT Counter | 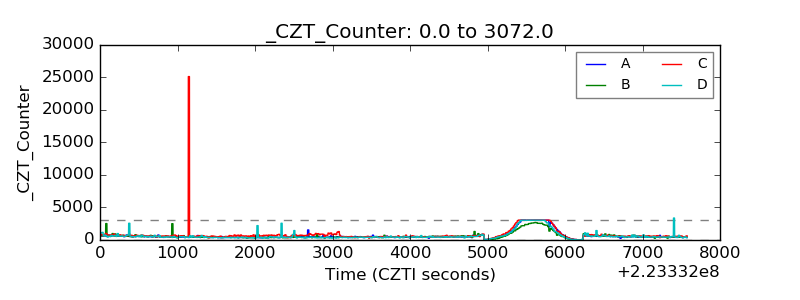 |
| +2.5 Volts monitor |  |
| +5 Volts monitor |  |
| _ROLL_ROT | 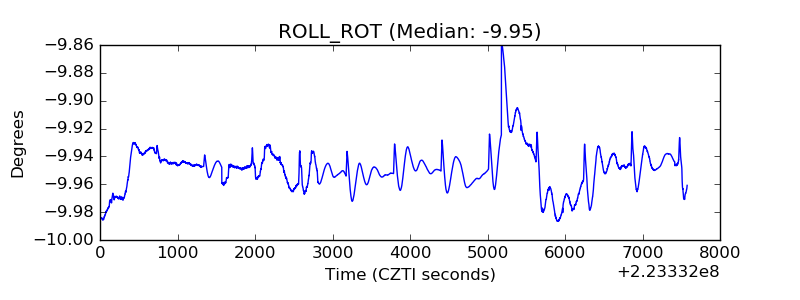 |
| _Roll_DEC | 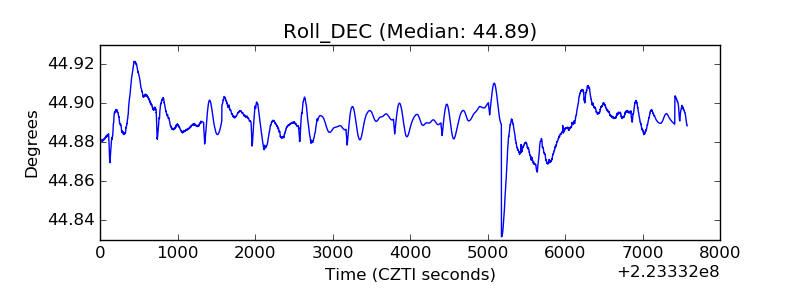 |
| _Roll_RA | 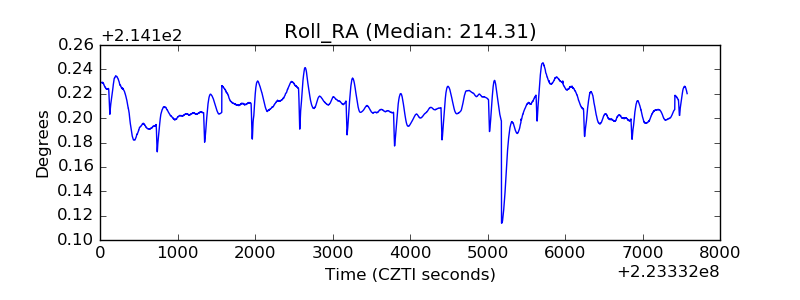 |
| Veto Counter | 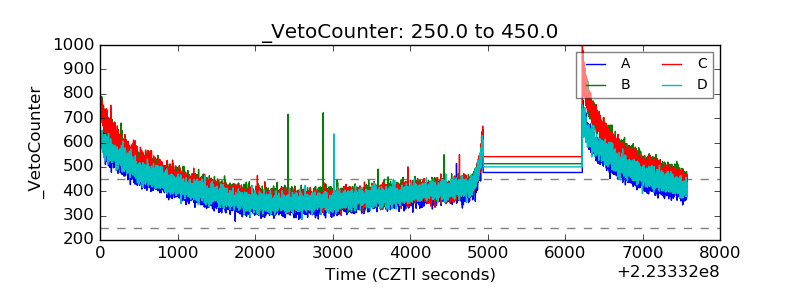 |