| Param | Original file | Final file |
|---|---|---|
| Filename | modeM0/AS1G05_246T03_9000000990_07236cztM0_level2.evt | modeM0/AS1G05_246T03_9000000990_07236cztM0_level2_quad_clean.evt |
| Size (bytes) | 476,807,040 | 103,942,080 |
| Size | 454.7 MB | 99.1 MB |
| Events in quadrant A | 3,149,381 | 684,279 |
| Events in quadrant B | 3,327,340 | 710,407 |
| Events in quadrant C | 3,339,685 | 695,458 |
| Events in quadrant D | 4,198,355 | 620,507 |
| Mode M0 | |||
|---|---|---|---|
| Quadrant | BADHDUFLAG | Total packets | Discarded packets |
| A | 0 | 13449 | 3 |
| B | 0 | 14063 | 2 |
| C | 0 | 14054 | 2 |
| D | 0 | 16829 | 2 |
| Mode M9 | |||
|---|---|---|---|
| Quadrant | BADHDUFLAG | Total packets | Discarded packets |
| A | 0 | 16 | 0 |
| B | 0 | 16 | 0 |
| C | 0 | 16 | 0 |
| D | 0 | 17 | 0 |
| Mode SS | |||
|---|---|---|---|
| Quadrant | BADHDUFLAG | Total packets | Discarded packets |
| A | 0 | 128 | 0 |
| B | 0 | 128 | 0 |
| C | 0 | 128 | 0 |
| D | 0 | 128 | 0 |
| Quadrant | Total seconds | Saturated seconds | Saturation percentage |
|---|---|---|---|
| A | 6261 | 24 | 0.383325% |
| B | 6261 | 45 | 0.718735% |
| C | 6261 | 23 | 0.367353% |
| D | 6261 | 363 | 5.797796% |
Noise dominated data is calculated using 1-second bins in cleaned event files. If a bin has >2000 counts, and if more than 50% of those come from <1% of pixels, then it is considered to be noise-dominated and hence unusable.
| Quadrant | # 1 sec bins | Bins with >0 counts | Bins with >2000 counts | High rate bins dominated by noise | Noise dominated (total time) | Noise dominated (detector-on time) | Marked lightcurve |
|---|---|---|---|---|---|---|---|
| A | 7586 | 6262 | 1 | 1 | 0.01% | 0.02% | 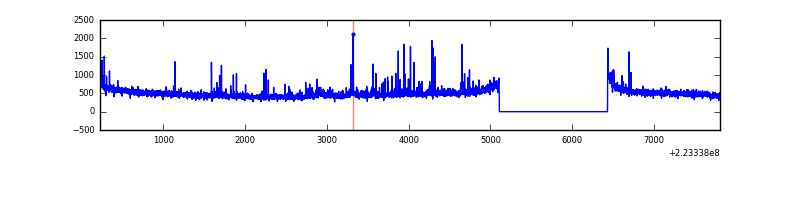 |
| B | 7586 | 6262 | 4 | 4 | 0.05% | 0.06% | 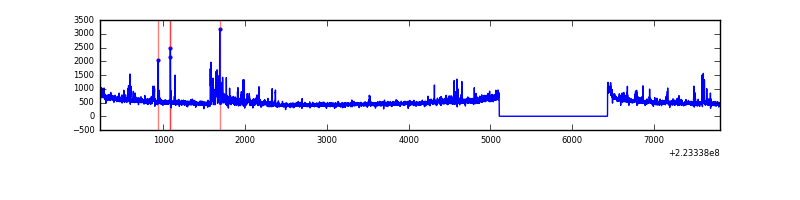 |
| C | 7586 | 6262 | 0 | 0 | 0.00% | 0.00% | 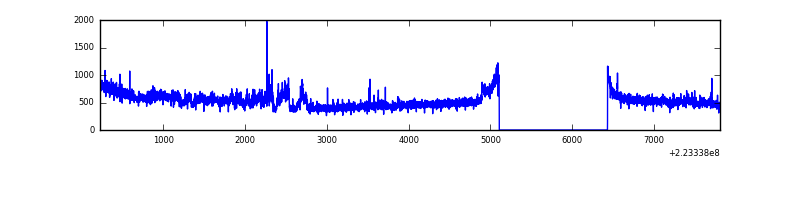 |
| D | 7586 | 6262 | 328 | 328 | 4.32% | 5.24% | 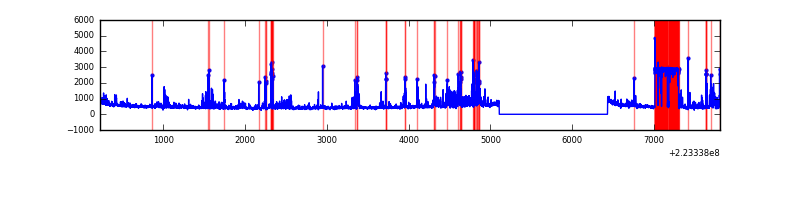 |
Top three noisy pixels from each quadrant. If the there are fewer than three noisy pixels in the level2.evt file, extra rows are filled as -1
| Pixel properties | Quadrant properties | ||||||
|---|---|---|---|---|---|---|---|
| Quadrant | DetID | PixID | Counts | Sigma | Mean | Median | Sigma |
| A | 8 | 15 | 138215 | 886.79 | 762 | 748 | 155.0 |
| A | 3 | 1 | 58334 | 371.48 | 762 | 748 | 155.0 |
| A | 14 | 238 | 11711 | 70.72 | 762 | 748 | 155.0 |
| B | 10 | 16 | 151081 | 1033.68 | 778 | 761 | 145.4 |
| B | 0 | 214 | 78704 | 535.98 | 778 | 761 | 145.4 |
| B | 4 | 81 | 40245 | 271.51 | 778 | 761 | 145.4 |
| C | 9 | 68 | 402599 | 2331.66 | 750 | 754 | 172.3 |
| C | 12 | 4 | 7891 | 41.41 | 750 | 754 | 172.3 |
| C | 13 | 61 | 5999 | 30.43 | 750 | 754 | 172.3 |
| D | 13 | 105 | 744604 | 4240.28 | 712 | 690 | 175.4 |
| D | 2 | 216 | 435521 | 2478.52 | 712 | 690 | 175.4 |
| D | 2 | 14 | 204973 | 1164.4 | 712 | 690 | 175.4 |
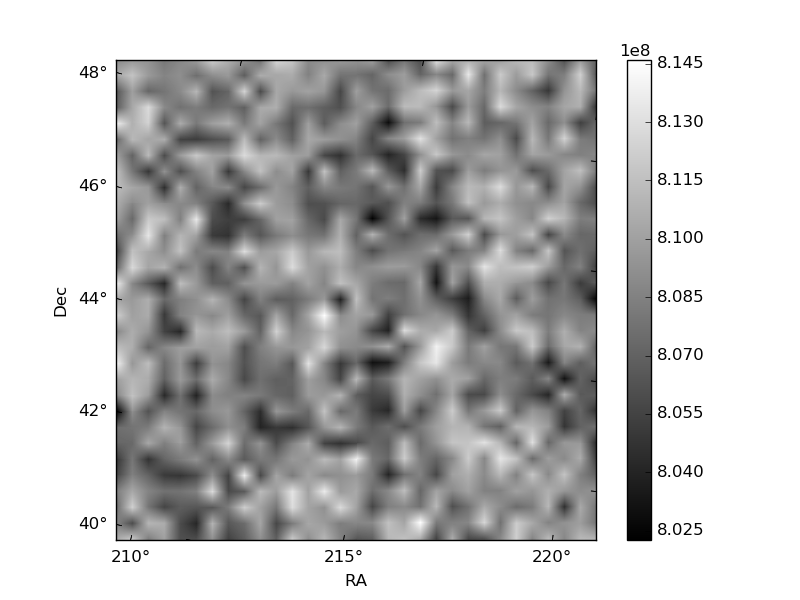
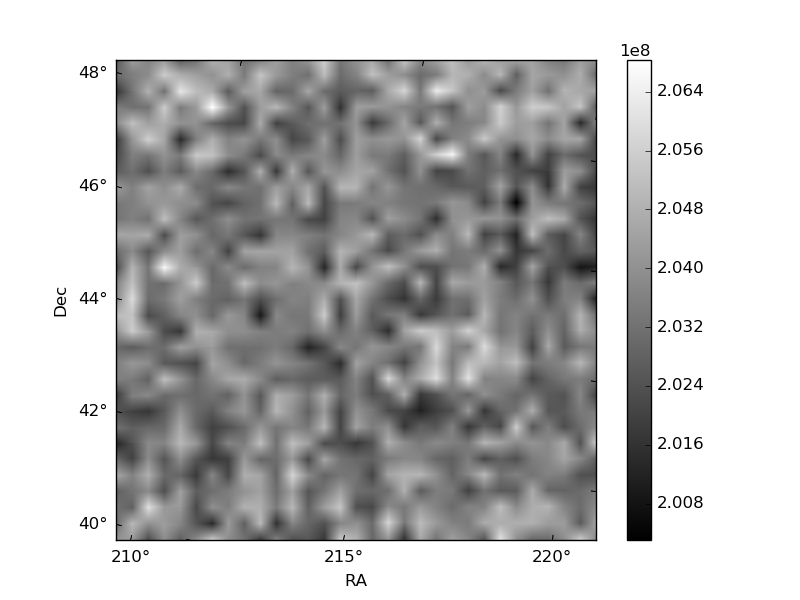
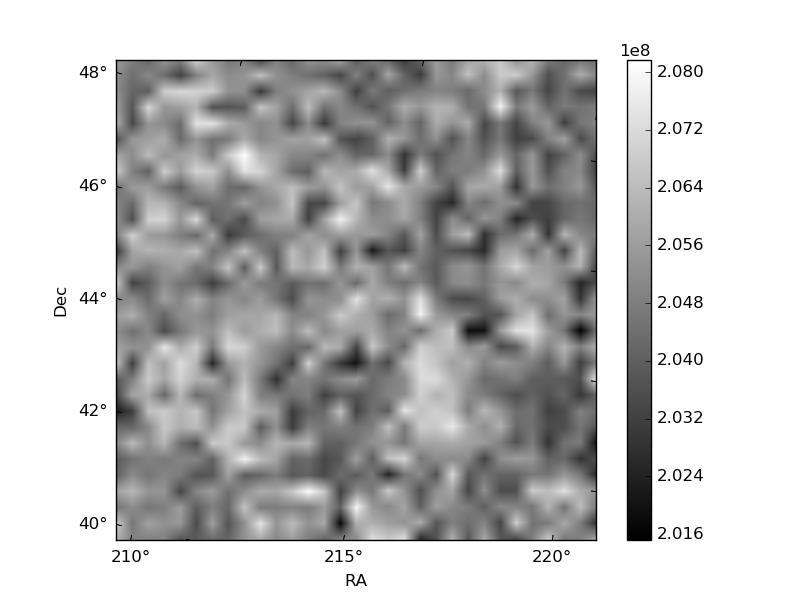
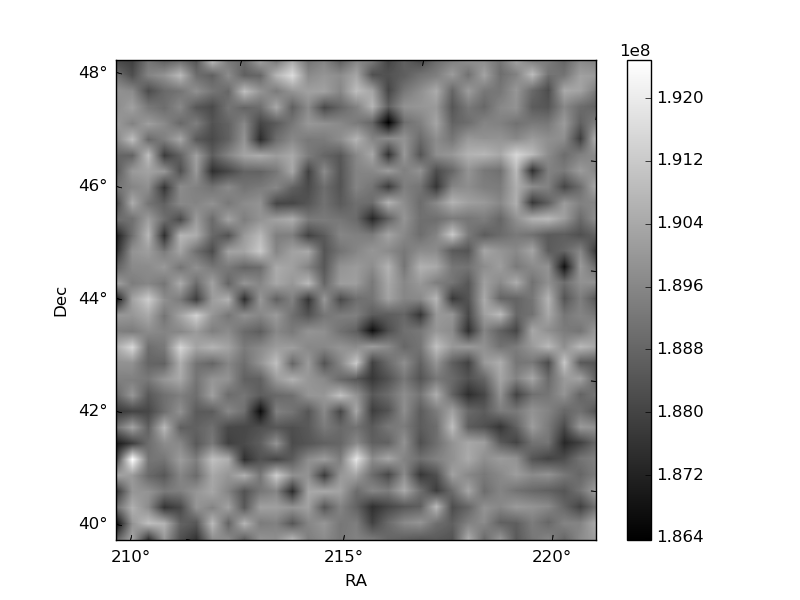
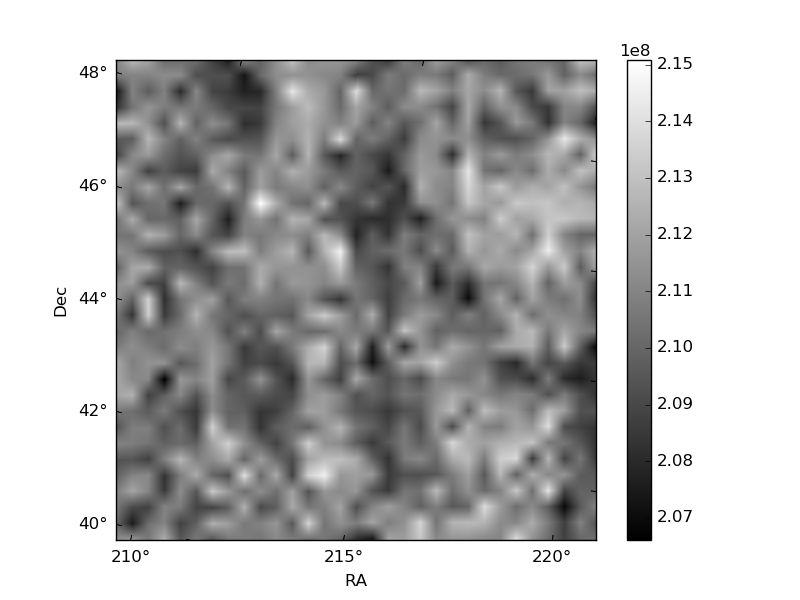
Histogram calculated using DETX and DETY for each event in the final _common_clean file
| Quadrant A | 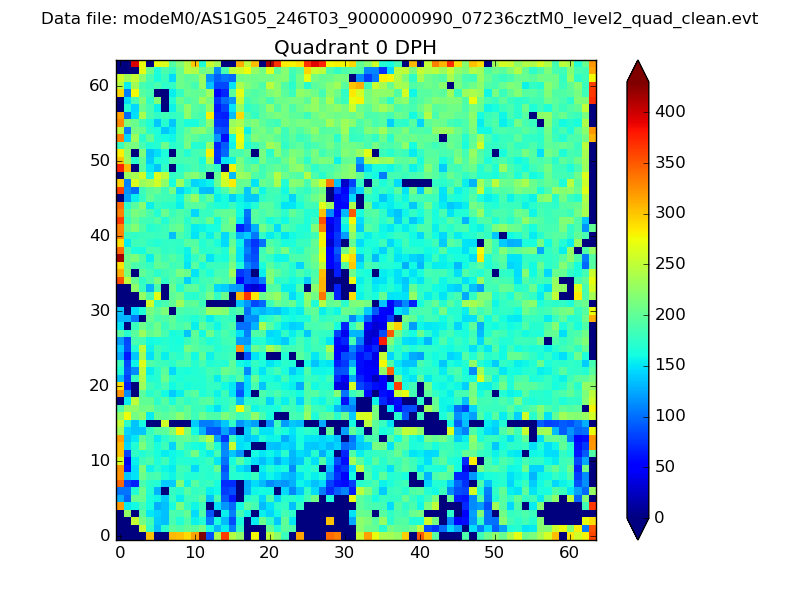 |
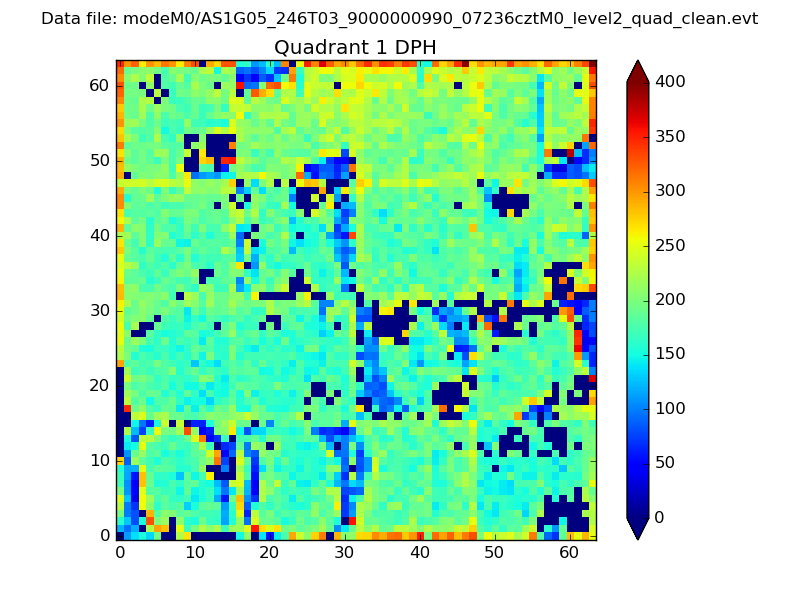 |
Quadrant B |
|---|---|---|---|
| Quadrant D | 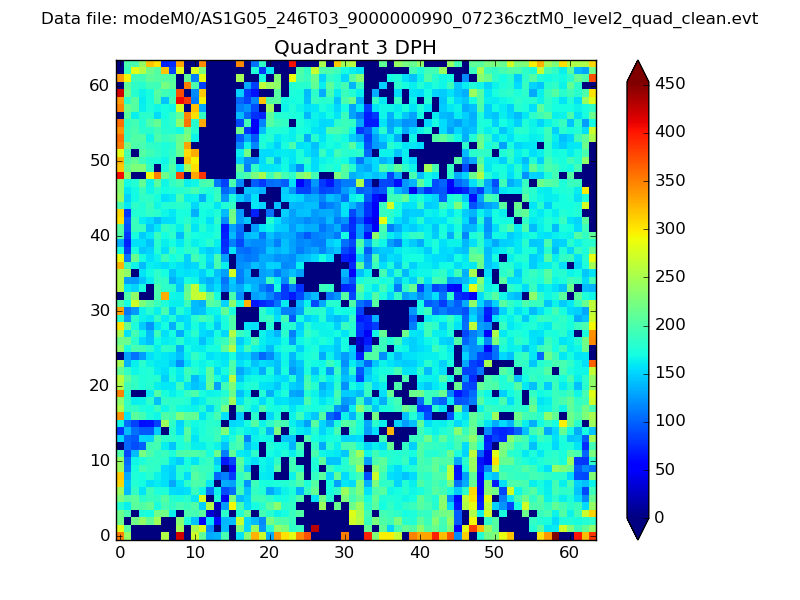 |
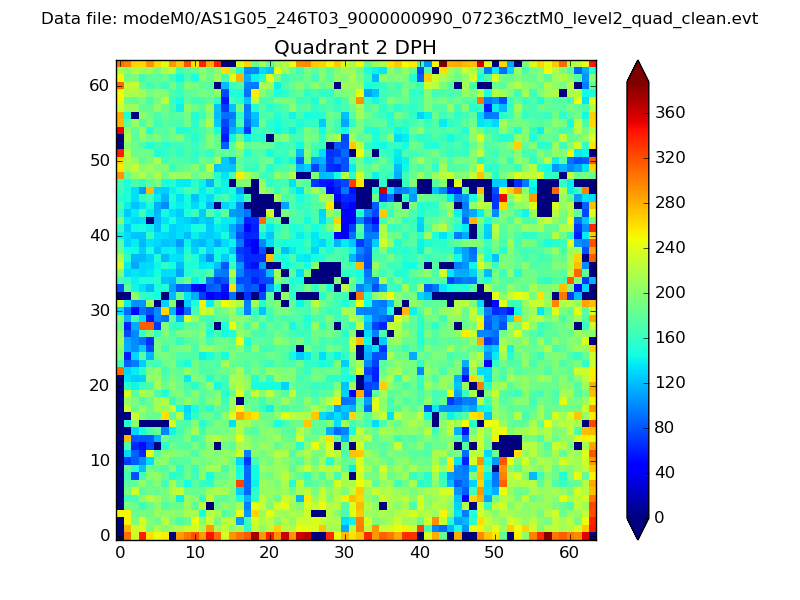 |
Quadrant C |
| Plot type | Count rate plots | Images |
|---|---|---|
| Comparison with Poisson distribution Blue bars denote a histogram of data divided into 1 sec bins. Red curve is a Poisson curve with rate = median count rate of data. |
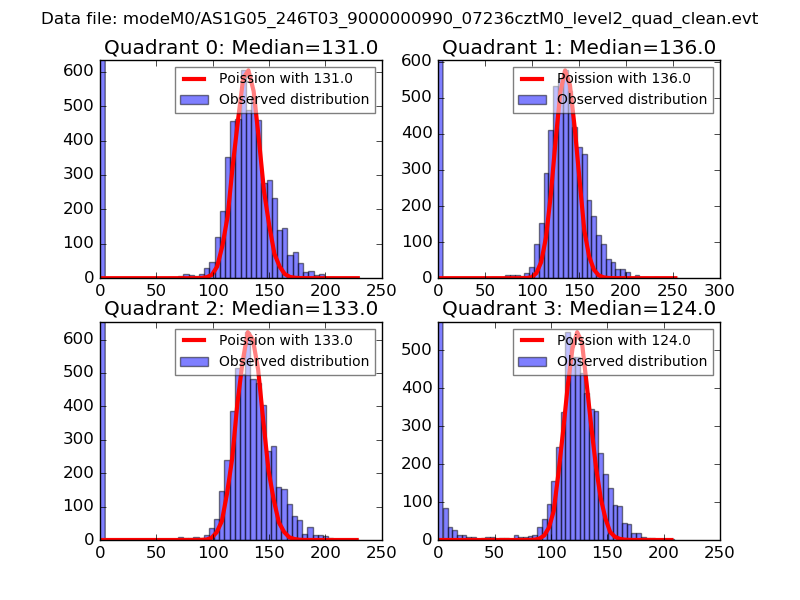 |
 |
| Quadrant-wise count rates Data is divided into 100 sec bins |
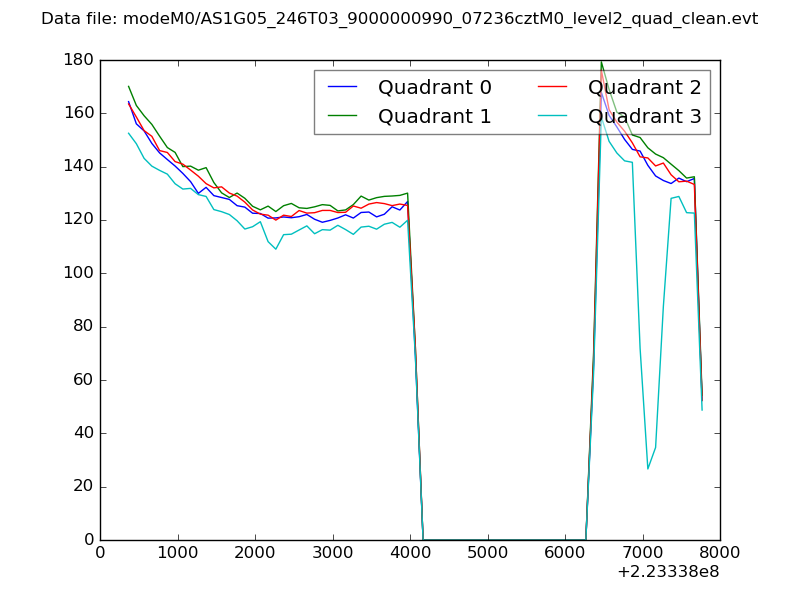 |
|
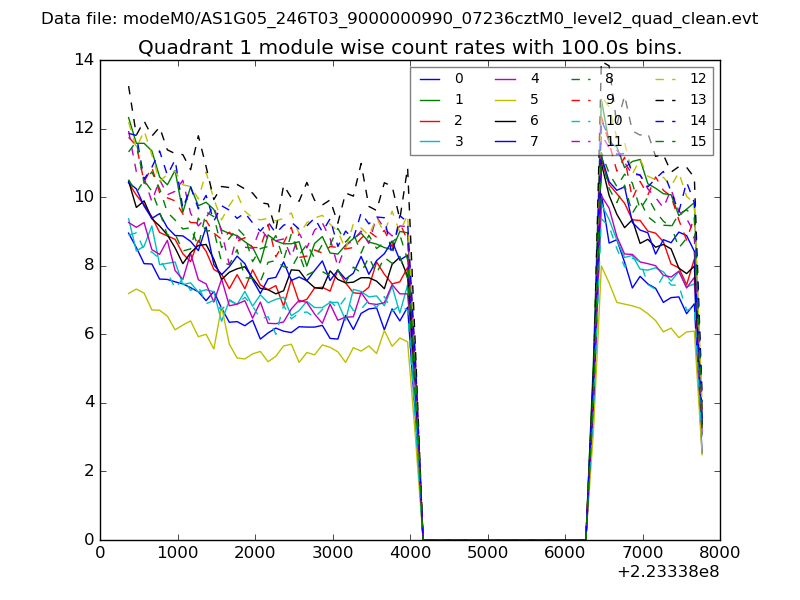
| Module-wise count rates for Quadrant A Data is divided into 100 sec bins |
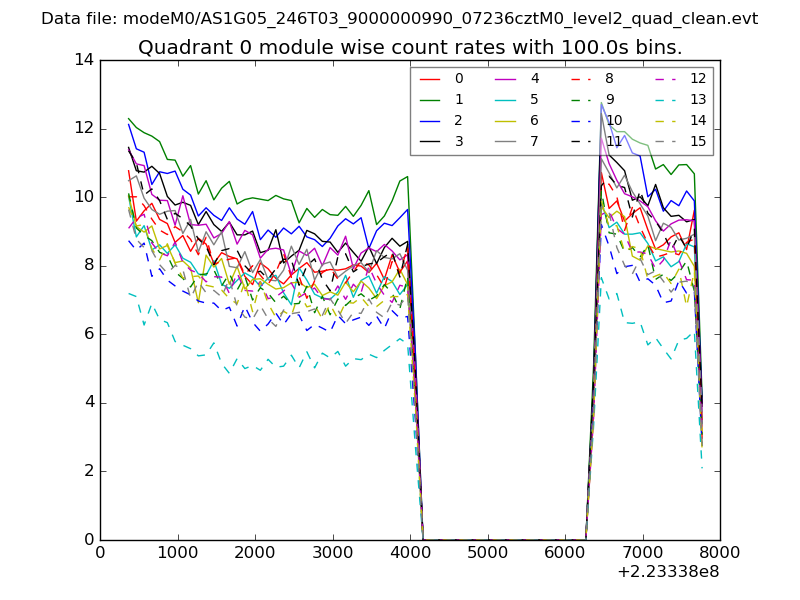 |
 |
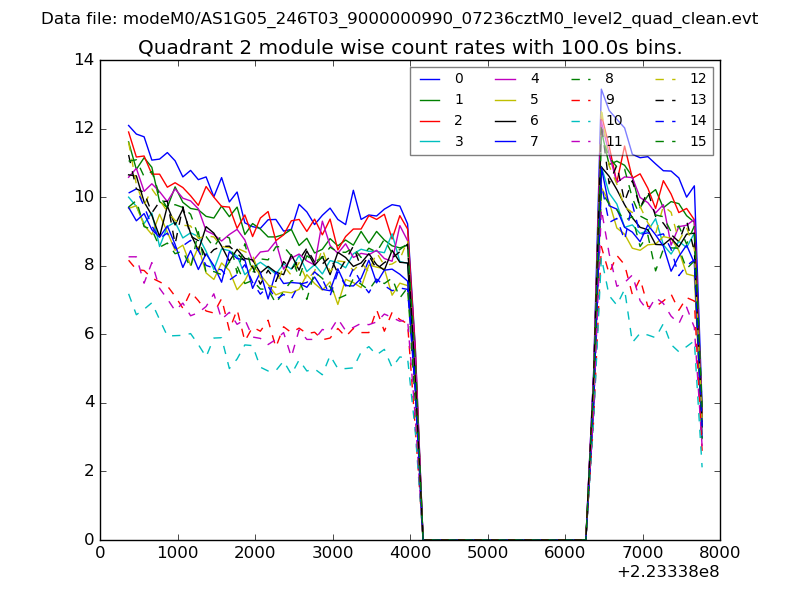
| Module-wise count rates for Quadrant B Data is divided into 100 sec bins |
 |
 |
| Module-wise count rates for Quadrant C Data is divided into 100 sec bins |
 |
 |
| Module-wise count rates for Quadrant D Data is divided into 100 sec bins |
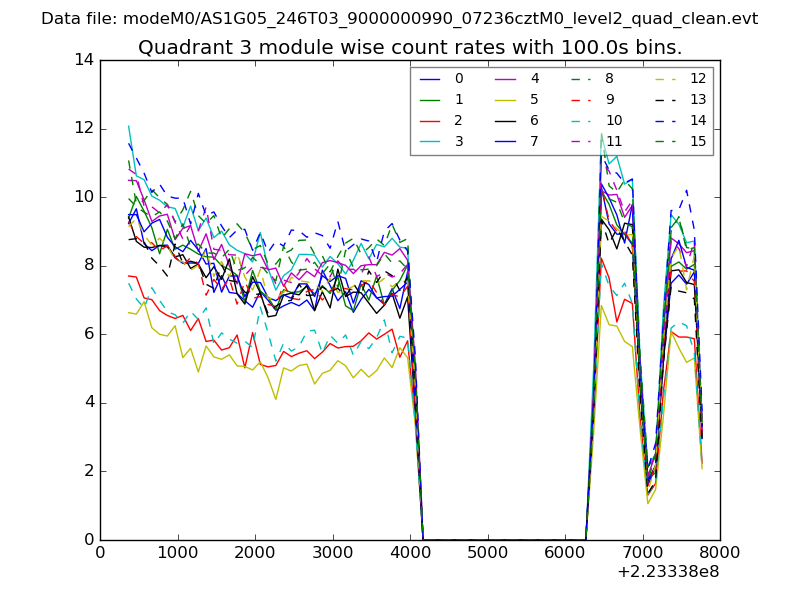 |
 |
| Parameter | Plot |
|---|---|
| CZT HV Monitor | 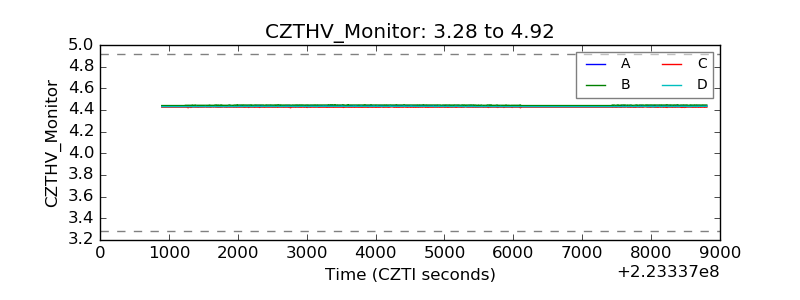 |
| D_VDD | 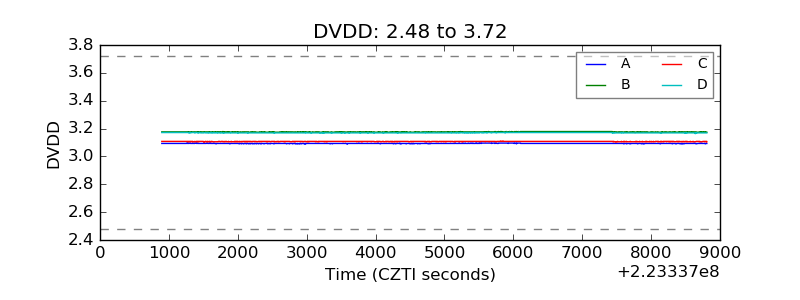 |
| Temperature 1 | 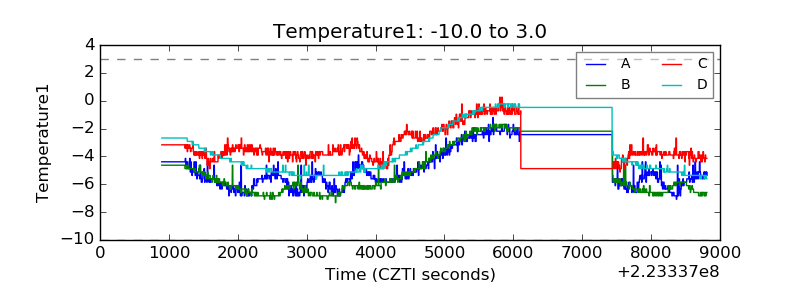 |
| Veto HV Monitor | 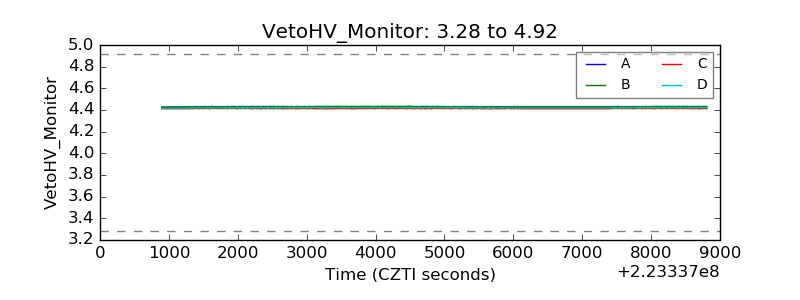 |
| Veto LLD | 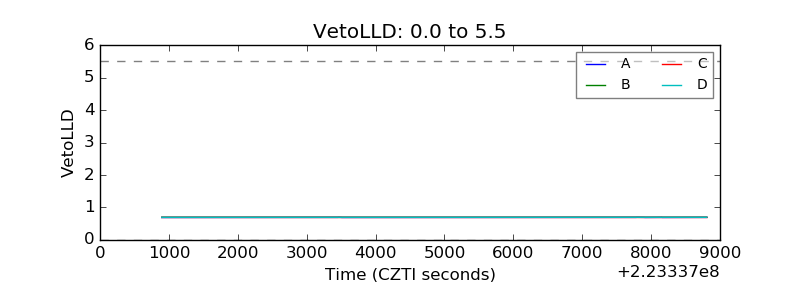 |
| Alpha Counter | 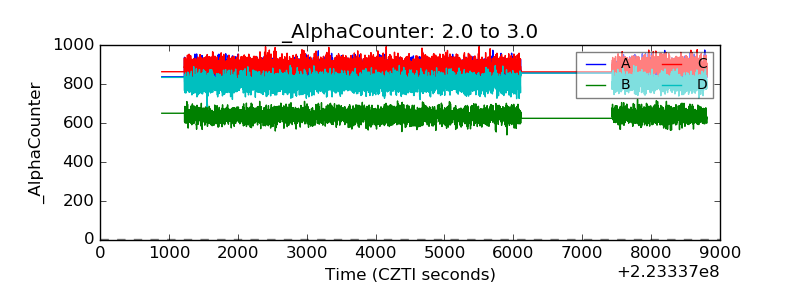 |
| _CPM_Rate | 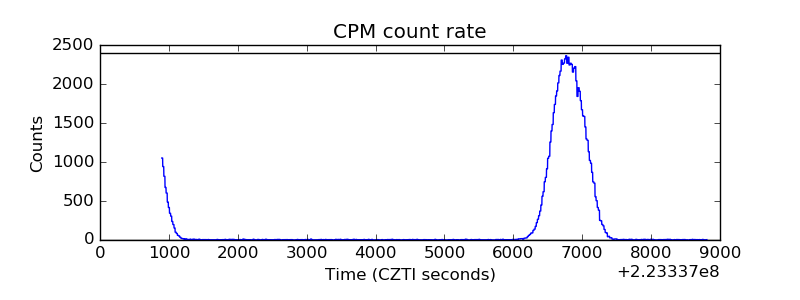 |
| CZT Counter | 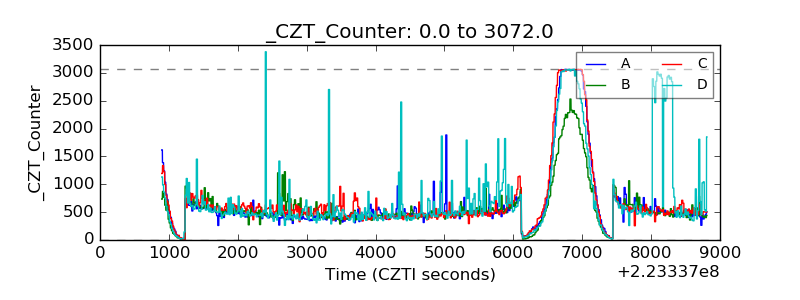 |
| +2.5 Volts monitor |  |
| +5 Volts monitor |  |
| _ROLL_ROT | 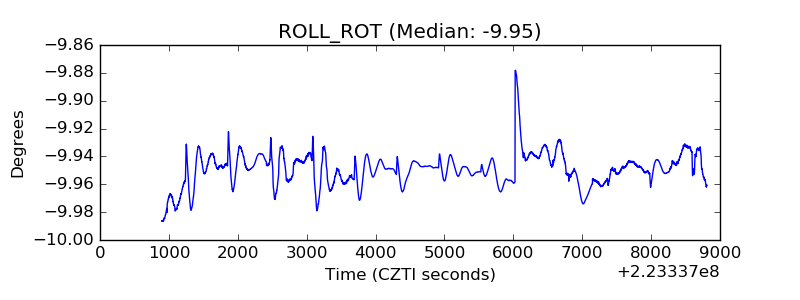 |
| _Roll_DEC | 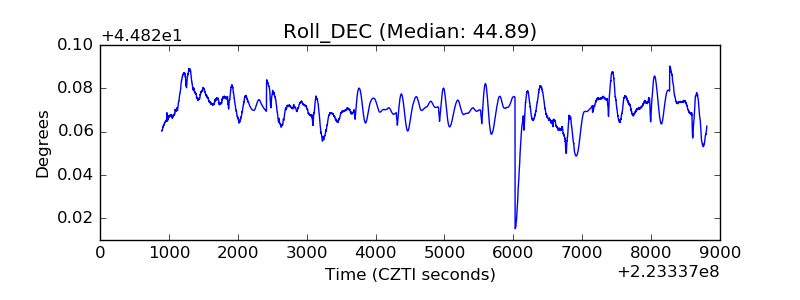 |
| _Roll_RA | 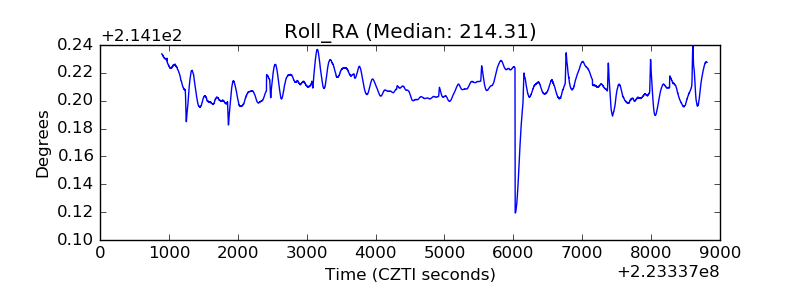 |
| Veto Counter | 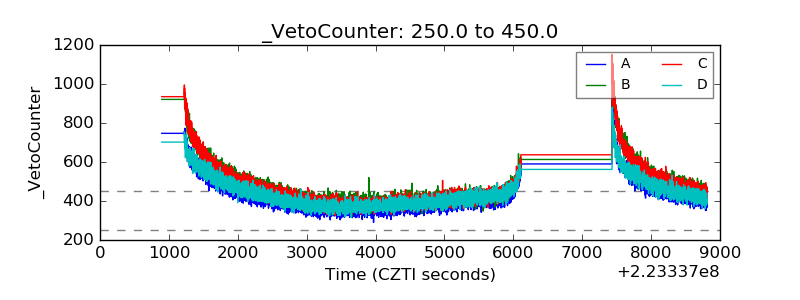 |