| Param | Original file | Final file |
|---|---|---|
| Filename | modeM0/AS1G05_246T03_9000000990_07238cztM0_level2.evt | modeM0/AS1G05_246T03_9000000990_07238cztM0_level2_quad_clean.evt |
| Size (bytes) | 481,985,280 | 92,600,640 |
| Size | 459.7 MB | 88.3 MB |
| Events in quadrant A | 3,110,573 | 591,222 |
| Events in quadrant B | 3,687,516 | 604,581 |
| Events in quadrant C | 4,113,742 | 589,768 |
| Events in quadrant D | 3,239,855 | 561,208 |
| Mode M0 | |||
|---|---|---|---|
| Quadrant | BADHDUFLAG | Total packets | Discarded packets |
| A | 0 | 13648 | 3 |
| B | 0 | 15411 | 2 |
| C | 0 | 16785 | 2 |
| D | 0 | 14580 | 2 |
| Mode M9 | |||
|---|---|---|---|
| Quadrant | BADHDUFLAG | Total packets | Discarded packets |
| A | 0 | 15 | 0 |
| B | 0 | 15 | 0 |
| C | 0 | 15 | 0 |
| D | 0 | 16 | 0 |
| Mode SS | |||
|---|---|---|---|
| Quadrant | BADHDUFLAG | Total packets | Discarded packets |
| A | 0 | 132 | 0 |
| B | 0 | 132 | 0 |
| C | 0 | 132 | 0 |
| D | 0 | 132 | 0 |
| Quadrant | Total seconds | Saturated seconds | Saturation percentage |
|---|---|---|---|
| A | 6565 | 14 | 0.213252% |
| B | 6565 | 102 | 1.553694% |
| C | 6565 | 38 | 0.578827% |
| D | 6565 | 91 | 1.386139% |
Noise dominated data is calculated using 1-second bins in cleaned event files. If a bin has >2000 counts, and if more than 50% of those come from <1% of pixels, then it is considered to be noise-dominated and hence unusable.
| Quadrant | # 1 sec bins | Bins with >0 counts | Bins with >2000 counts | High rate bins dominated by noise | Noise dominated (total time) | Noise dominated (detector-on time) | Marked lightcurve |
|---|---|---|---|---|---|---|---|
| A | 7850 | 6566 | 1 | 1 | 0.01% | 0.02% |  |
| B | 7850 | 6566 | 85 | 85 | 1.08% | 1.29% |  |
| C | 7850 | 6566 | 16 | 16 | 0.20% | 0.24% | 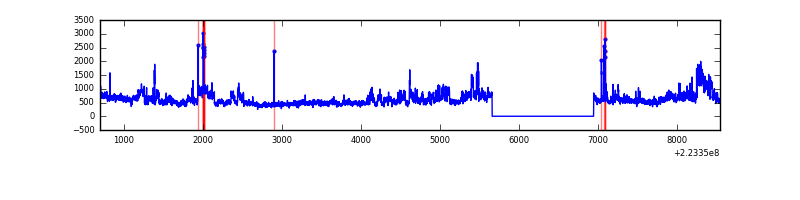 |
| D | 7850 | 6566 | 62 | 62 | 0.79% | 0.94% |  |
Top three noisy pixels from each quadrant. If the there are fewer than three noisy pixels in the level2.evt file, extra rows are filled as -1
| Pixel properties | Quadrant properties | ||||||
|---|---|---|---|---|---|---|---|
| Quadrant | DetID | PixID | Counts | Sigma | Mean | Median | Sigma |
| A | 8 | 15 | 110164 | 701.1 | 765 | 749 | 156.1 |
| A | 14 | 238 | 23112 | 143.3 | 765 | 749 | 156.1 |
| A | 3 | 1 | 21767 | 134.68 | 765 | 749 | 156.1 |
| B | 10 | 16 | 514828 | 3498.19 | 773 | 754 | 147.0 |
| B | 4 | 81 | 70348 | 473.58 | 773 | 754 | 147.0 |
| B | 0 | 214 | 70018 | 471.33 | 773 | 754 | 147.0 |
| C | 9 | 68 | 1206032 | 7034.77 | 742 | 747 | 171.3 |
| C | 12 | 4 | 6826 | 35.48 | 742 | 747 | 171.3 |
| C | 13 | 61 | 5832 | 29.68 | 742 | 747 | 171.3 |
| D | 2 | 14 | 159592 | 890.14 | 731 | 707 | 178.5 |
| D | 12 | 233 | 121294 | 675.57 | 731 | 707 | 178.5 |
| D | 2 | 33 | 82152 | 456.29 | 731 | 707 | 178.5 |
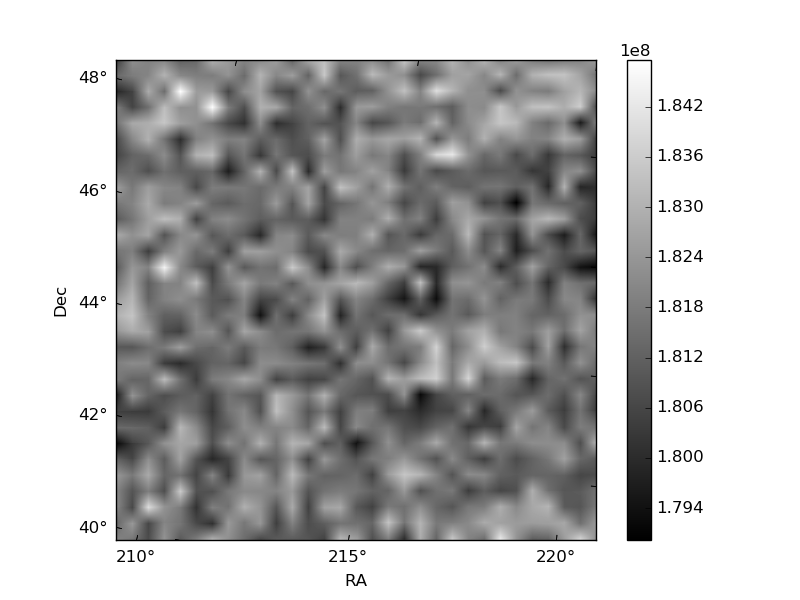
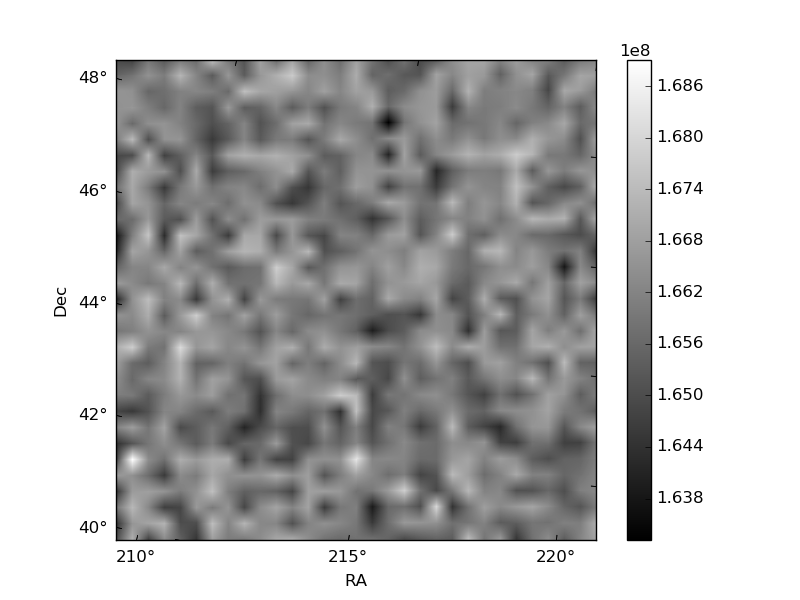
Histogram calculated using DETX and DETY for each event in the final _common_clean file
| Quadrant A | 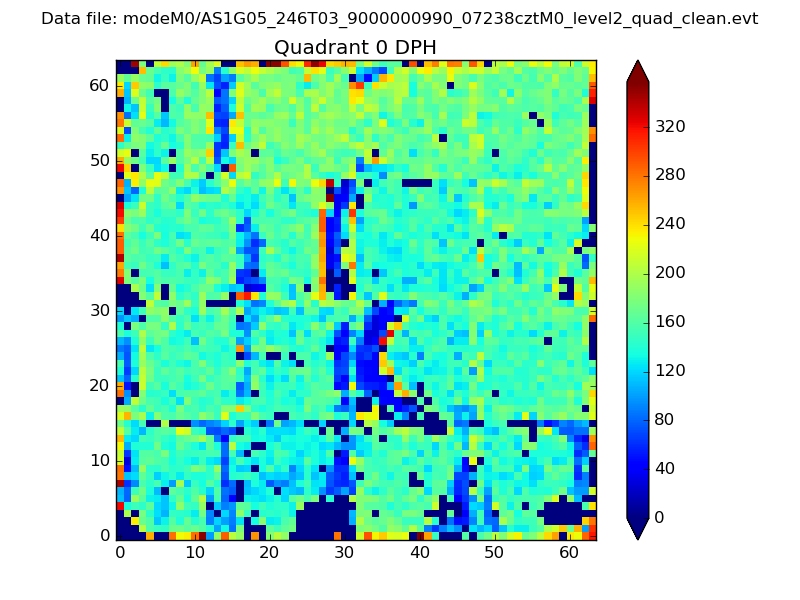 |
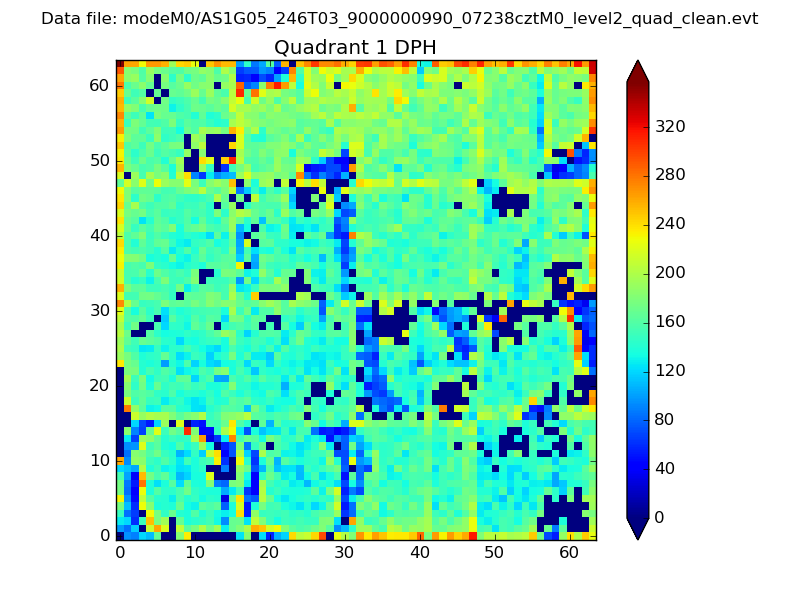 |
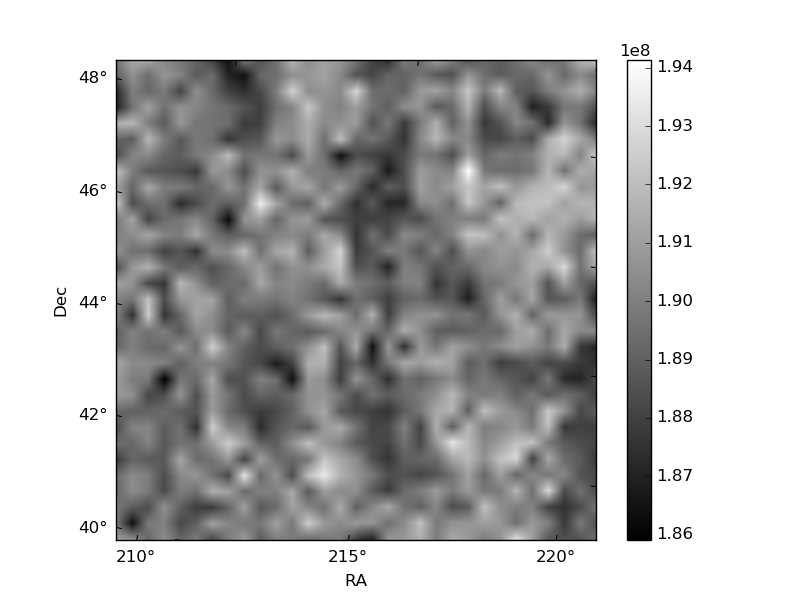
Quadrant B |
|---|---|---|---|
| Quadrant D | 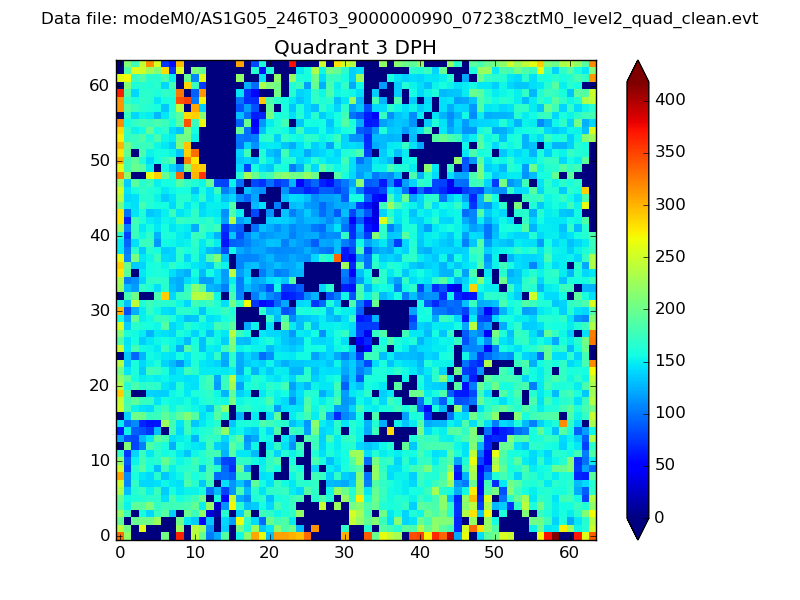 |
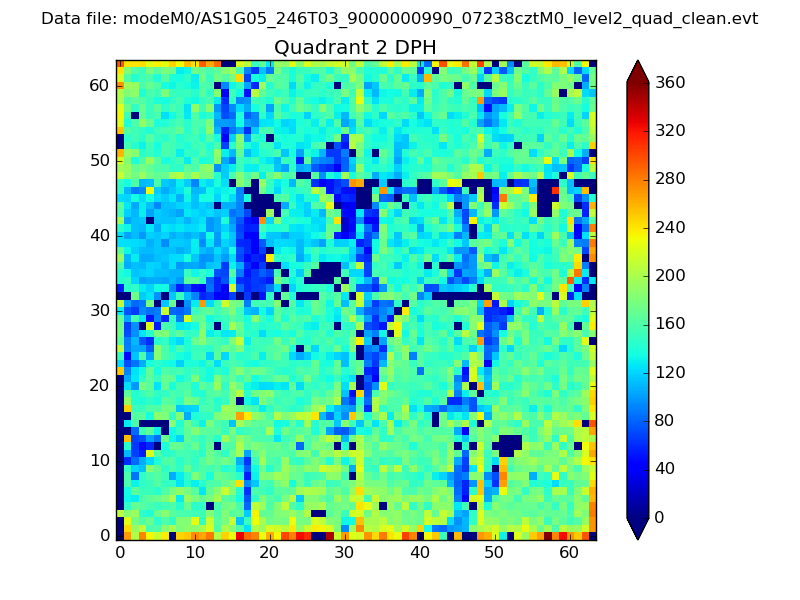 |
Quadrant C |
| Plot type | Count rate plots | Images |
|---|---|---|
| Comparison with Poisson distribution Blue bars denote a histogram of data divided into 1 sec bins. Red curve is a Poisson curve with rate = median count rate of data. |
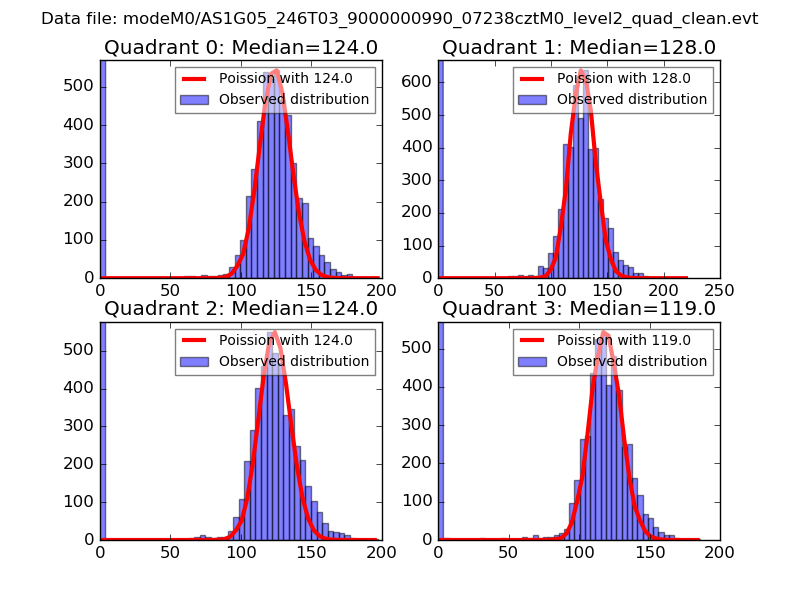 |
 |
| Quadrant-wise count rates Data is divided into 100 sec bins |
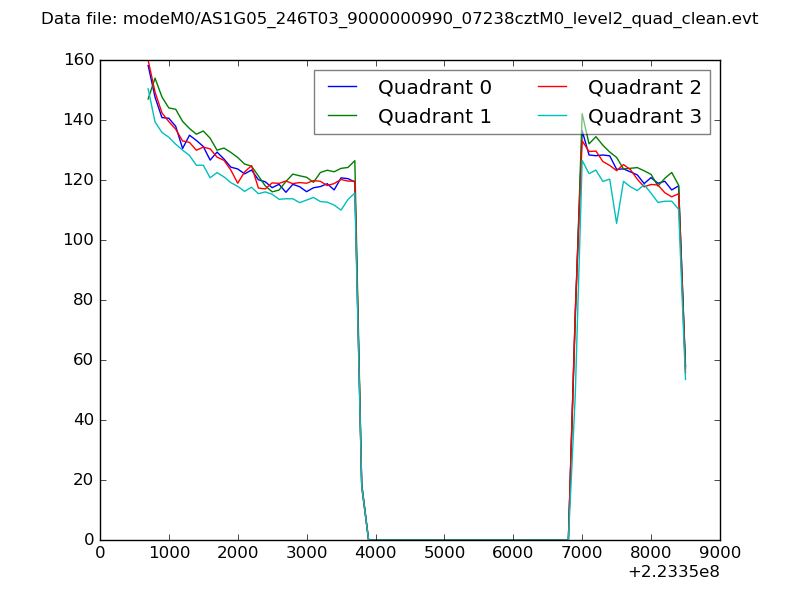 |
|
| Module-wise count rates for Quadrant A Data is divided into 100 sec bins |
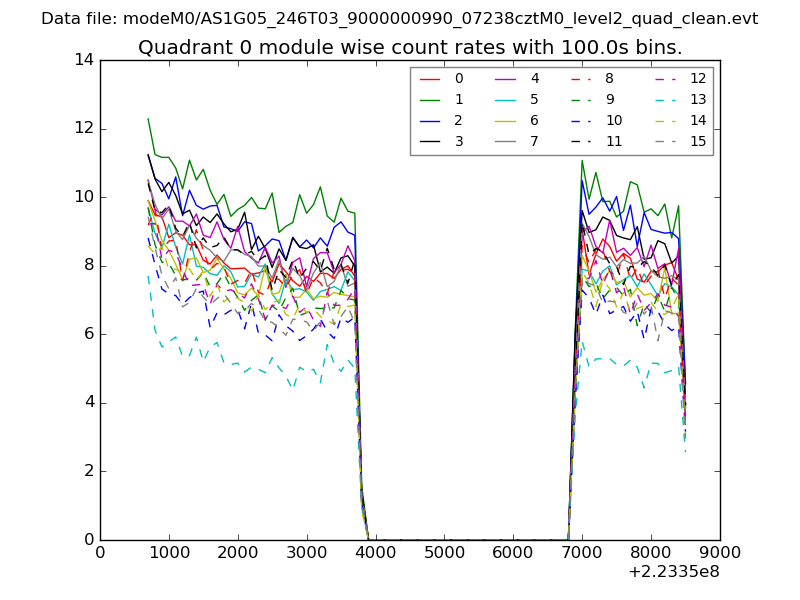 |
 |
| Module-wise count rates for Quadrant B Data is divided into 100 sec bins |
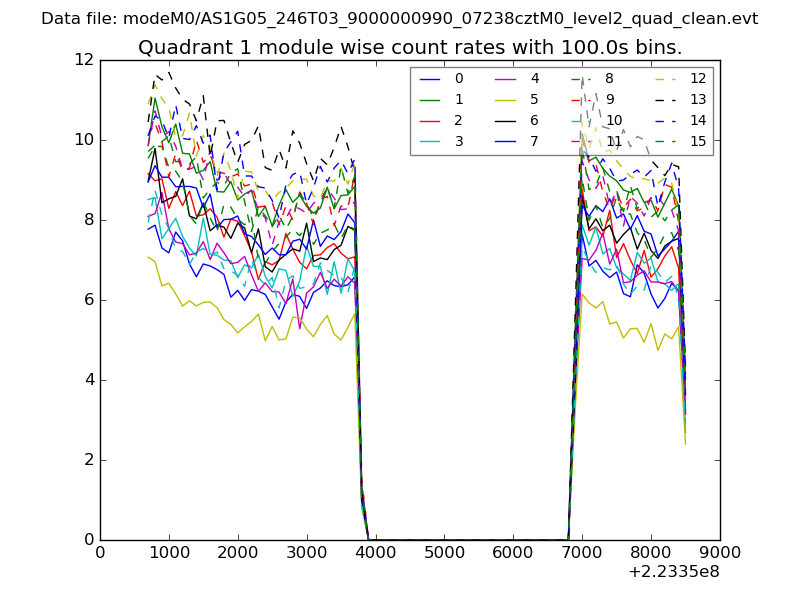 |
 |
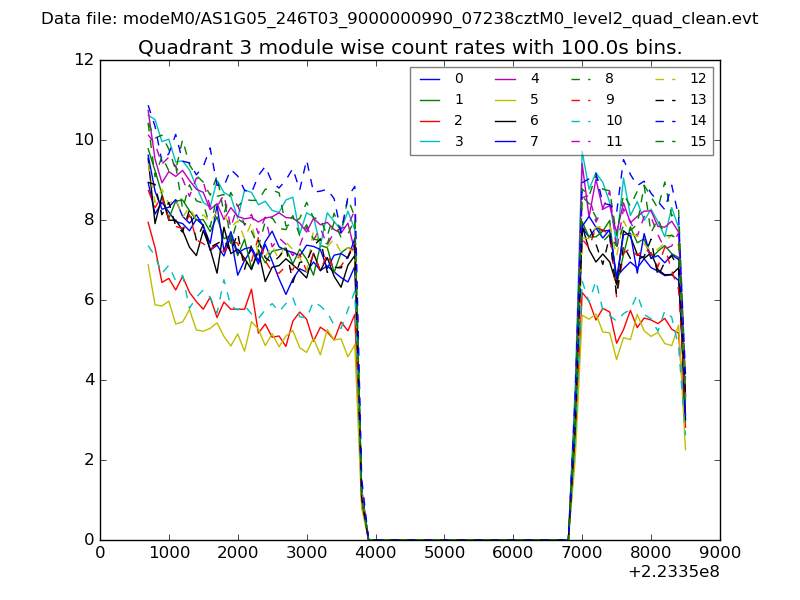
| Module-wise count rates for Quadrant C Data is divided into 100 sec bins |
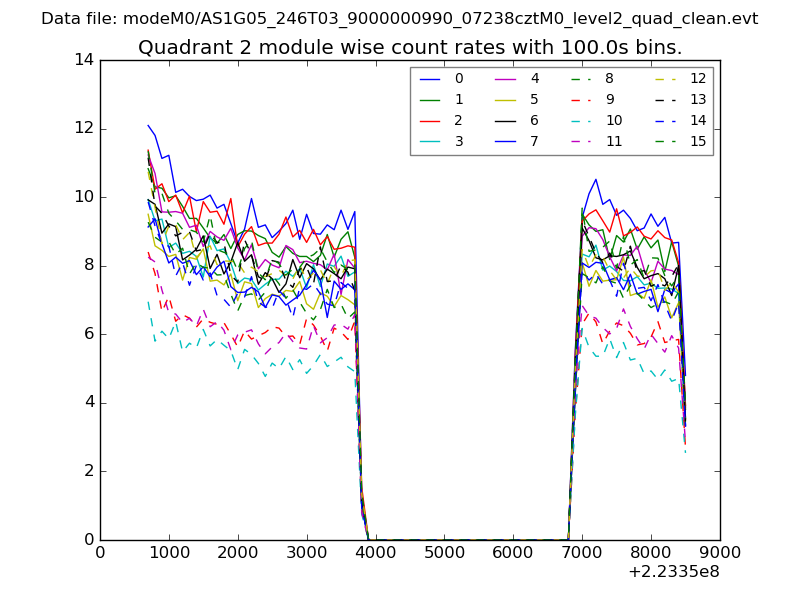 |
 |
| Module-wise count rates for Quadrant D Data is divided into 100 sec bins |
 |
 |
| Parameter | Plot |
|---|---|
| CZT HV Monitor | 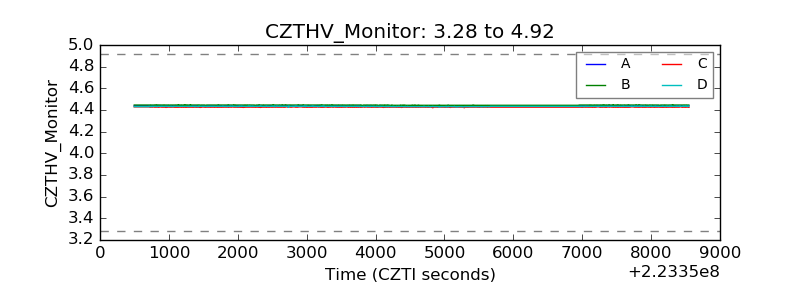 |
| D_VDD | 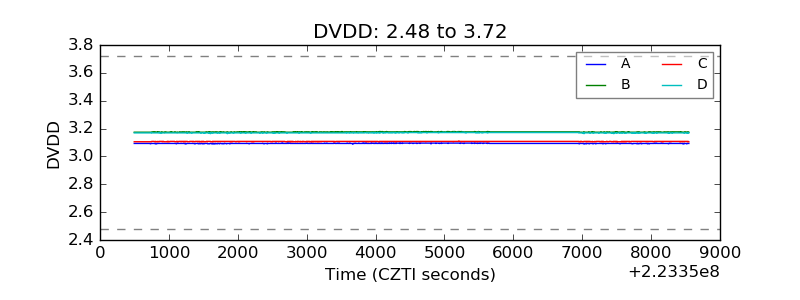 |
| Temperature 1 | 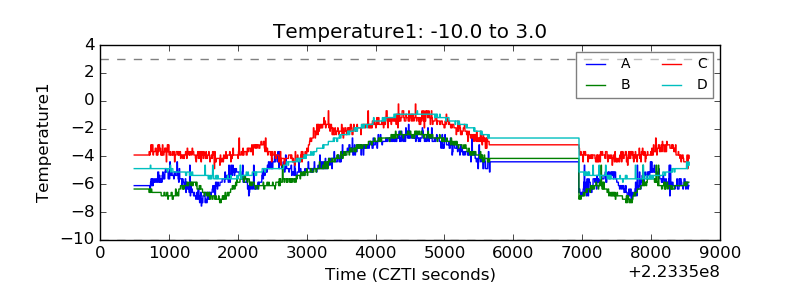 |
| Veto HV Monitor | 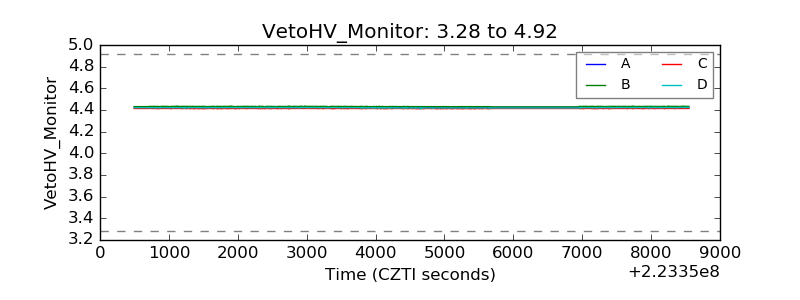 |
| Veto LLD | 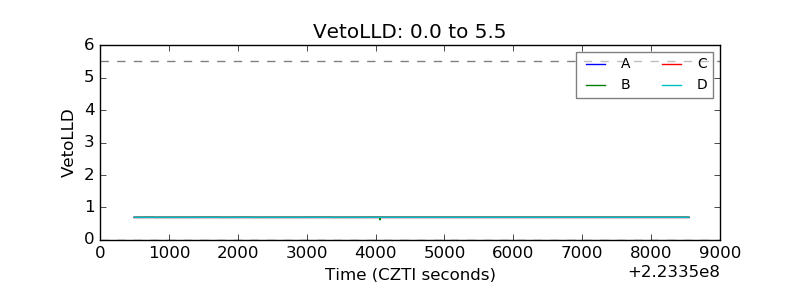 |
| Alpha Counter | 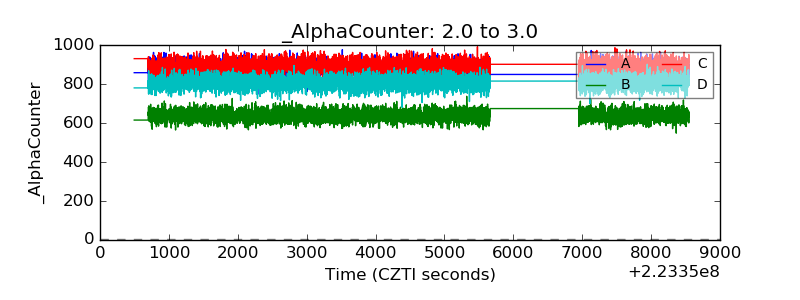 |
| _CPM_Rate | 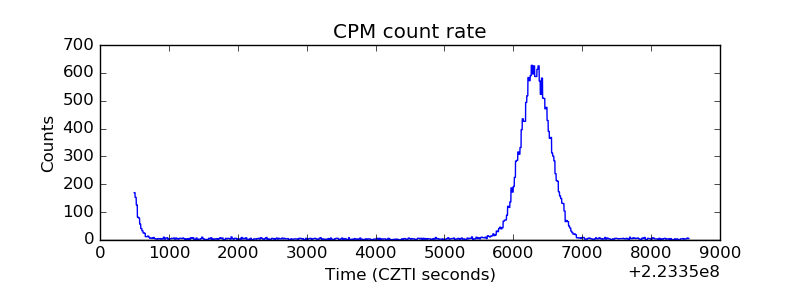 |
| CZT Counter | 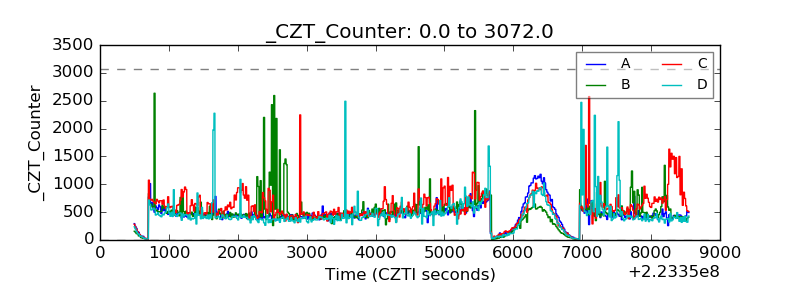 |
| +2.5 Volts monitor |  |
| +5 Volts monitor |  |
| _ROLL_ROT | 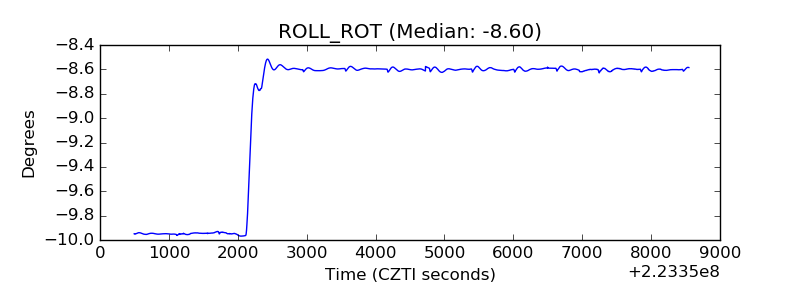 |
| _Roll_DEC | 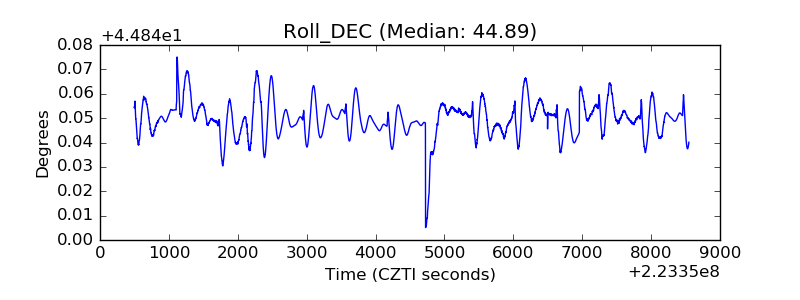 |
| _Roll_RA | 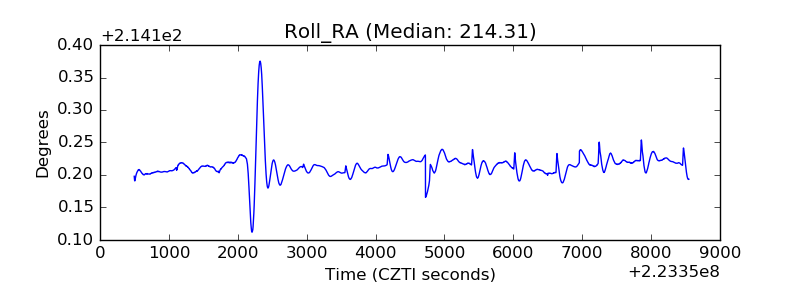 |
| Veto Counter | 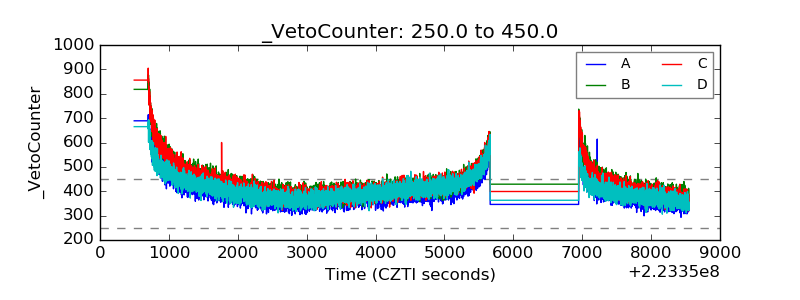 |