| Param | Original file | Final file |
|---|---|---|
| Filename | modeM0/AS1G05_246T03_9000000990_07239cztM0_level2.evt | modeM0/AS1G05_246T03_9000000990_07239cztM0_level2_quad_clean.evt |
| Size (bytes) | 490,991,040 | 91,506,240 |
| Size | 468.2 MB | 87.3 MB |
| Events in quadrant A | 3,231,937 | 577,086 |
| Events in quadrant B | 3,801,302 | 585,883 |
| Events in quadrant C | 4,018,487 | 577,834 |
| Events in quadrant D | 3,351,922 | 551,943 |
| Mode M0 | |||
|---|---|---|---|
| Quadrant | BADHDUFLAG | Total packets | Discarded packets |
| A | 0 | 14285 | 3 |
| B | 0 | 15835 | 2 |
| C | 0 | 16434 | 2 |
| D | 0 | 15065 | 2 |
| Mode M9 | |||
|---|---|---|---|
| Quadrant | BADHDUFLAG | Total packets | Discarded packets |
| A | 0 | 13 | 0 |
| B | 0 | 13 | 0 |
| C | 0 | 13 | 0 |
| D | 0 | 14 | 0 |
| Mode SS | |||
|---|---|---|---|
| Quadrant | BADHDUFLAG | Total packets | Discarded packets |
| A | 0 | 140 | 0 |
| B | 0 | 140 | 0 |
| C | 0 | 140 | 0 |
| D | 0 | 140 | 0 |
| Quadrant | Total seconds | Saturated seconds | Saturation percentage |
|---|---|---|---|
| A | 6860 | 74 | 1.078717% |
| B | 6860 | 158 | 2.303207% |
| C | 6860 | 39 | 0.568513% |
| D | 6860 | 100 | 1.457726% |
Noise dominated data is calculated using 1-second bins in cleaned event files. If a bin has >2000 counts, and if more than 50% of those come from <1% of pixels, then it is considered to be noise-dominated and hence unusable.
| Quadrant | # 1 sec bins | Bins with >0 counts | Bins with >2000 counts | High rate bins dominated by noise | Noise dominated (total time) | Noise dominated (detector-on time) | Marked lightcurve |
|---|---|---|---|---|---|---|---|
| A | 7775 | 6862 | 21 | 21 | 0.27% | 0.31% | 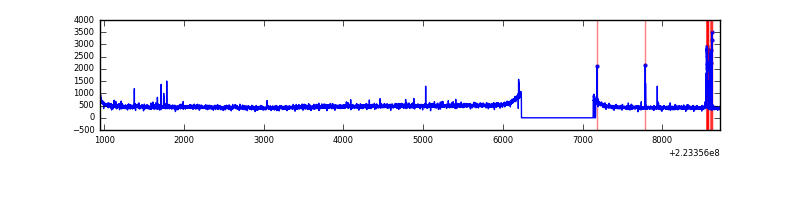 |
| B | 7775 | 6861 | 92 | 92 | 1.18% | 1.34% | 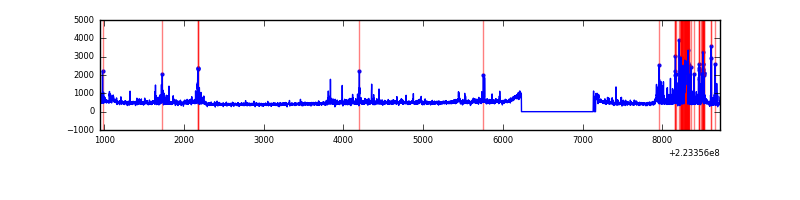 |
| C | 7775 | 6862 | 7 | 7 | 0.09% | 0.10% | 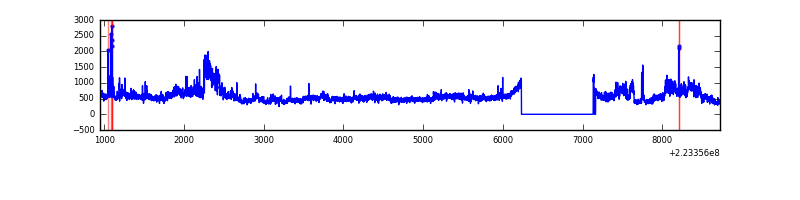 |
| D | 7775 | 6862 | 69 | 69 | 0.89% | 1.01% | 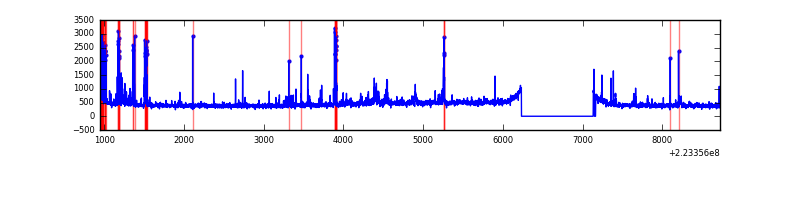 |
Top three noisy pixels from each quadrant. If the there are fewer than three noisy pixels in the level2.evt file, extra rows are filled as -1
| Pixel properties | Quadrant properties | ||||||
|---|---|---|---|---|---|---|---|
| Quadrant | DetID | PixID | Counts | Sigma | Mean | Median | Sigma |
| A | 8 | 15 | 75226 | 456.33 | 793 | 775 | 163.2 |
| A | 13 | 248 | 72856 | 441.8 | 793 | 775 | 163.2 |
| A | 14 | 238 | 19313 | 113.62 | 793 | 775 | 163.2 |
| B | 10 | 16 | 484341 | 3163.95 | 799 | 781 | 152.8 |
| B | 4 | 81 | 93334 | 605.58 | 799 | 781 | 152.8 |
| B | 0 | 214 | 76421 | 494.92 | 799 | 781 | 152.8 |
| C | 9 | 68 | 1014554 | 5706.79 | 768 | 771 | 177.6 |
| C | 13 | 61 | 5919 | 28.98 | 768 | 771 | 177.6 |
| C | 12 | 4 | 5845 | 28.56 | 768 | 771 | 177.6 |
| D | 2 | 14 | 148018 | 788.55 | 762 | 738 | 186.8 |
| D | 12 | 233 | 147380 | 785.14 | 762 | 738 | 186.8 |
| D | 13 | 169 | 73335 | 388.69 | 762 | 738 | 186.8 |
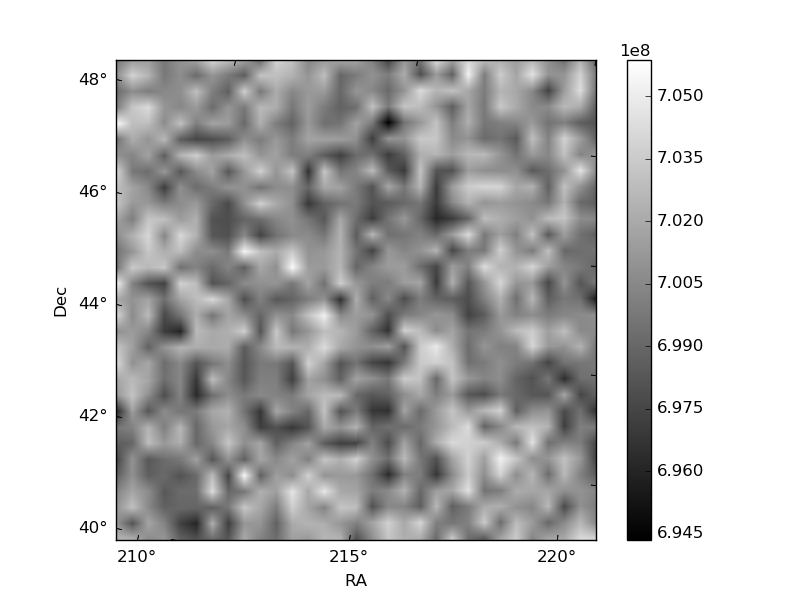
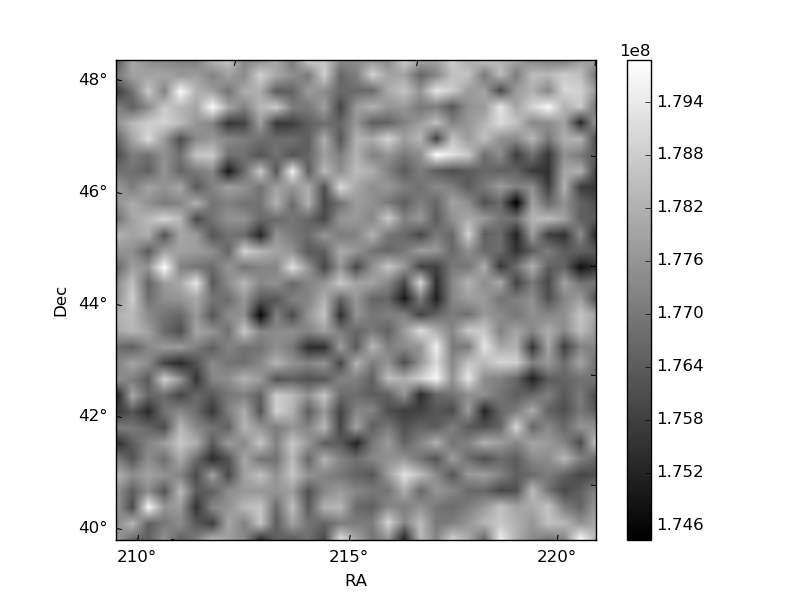
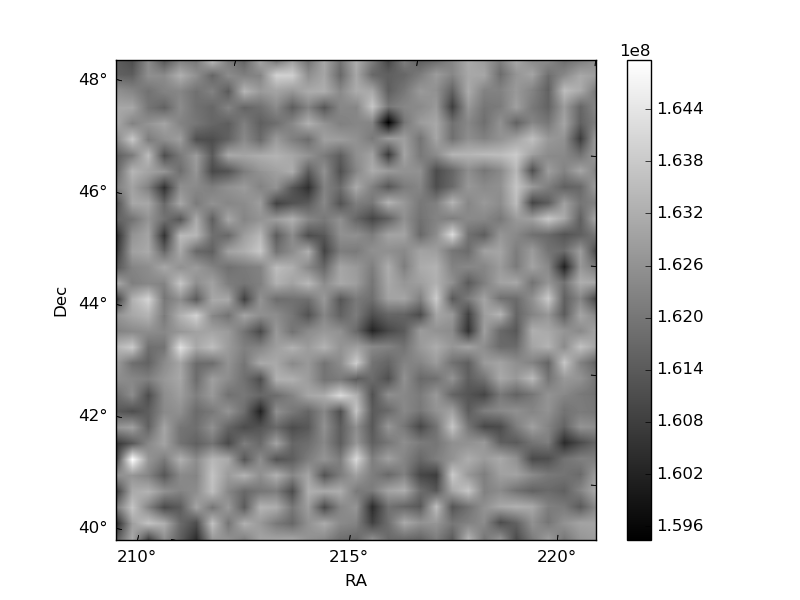
Histogram calculated using DETX and DETY for each event in the final _common_clean file
| Quadrant A | 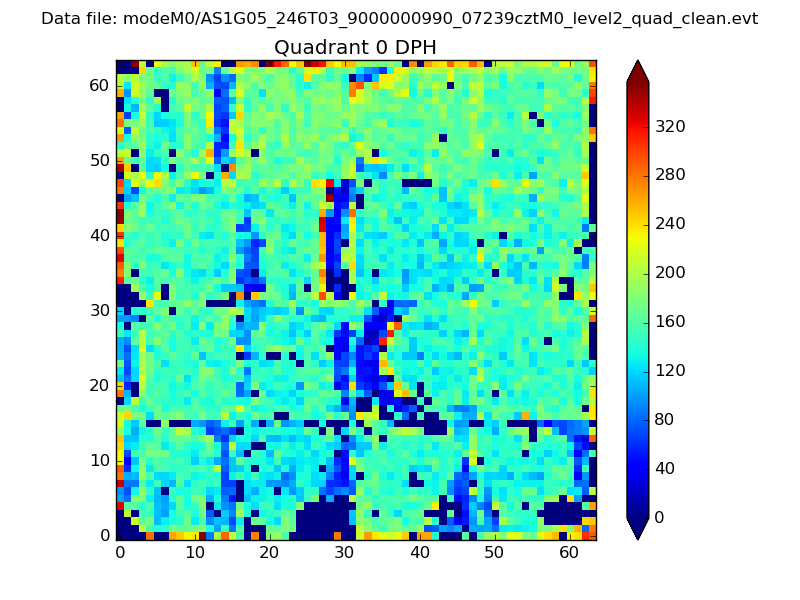 |
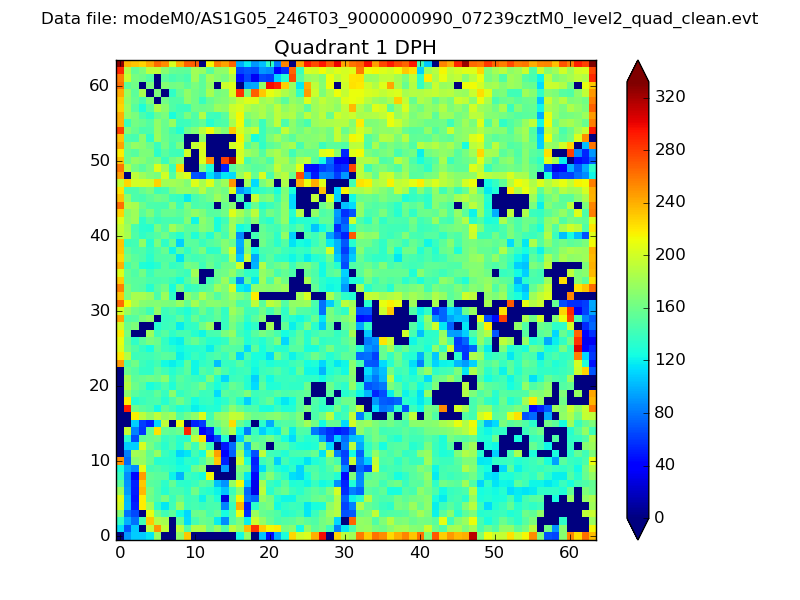 |
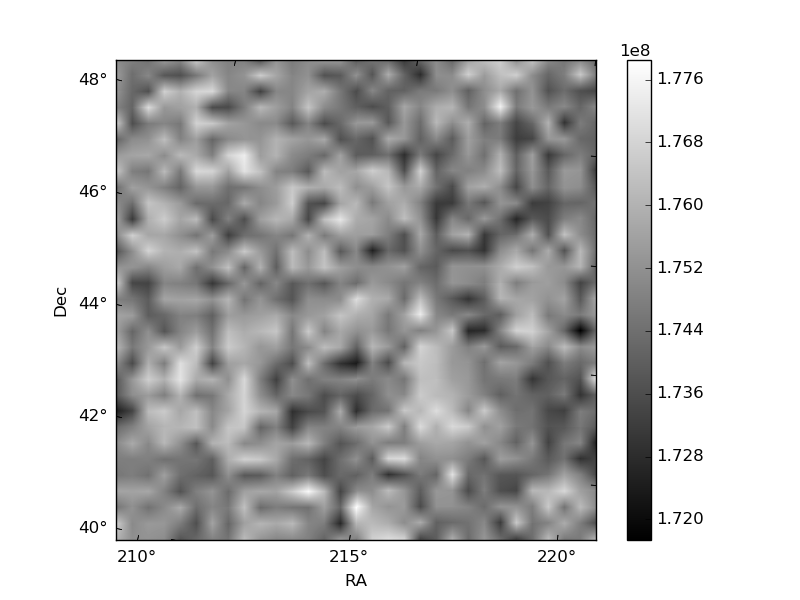
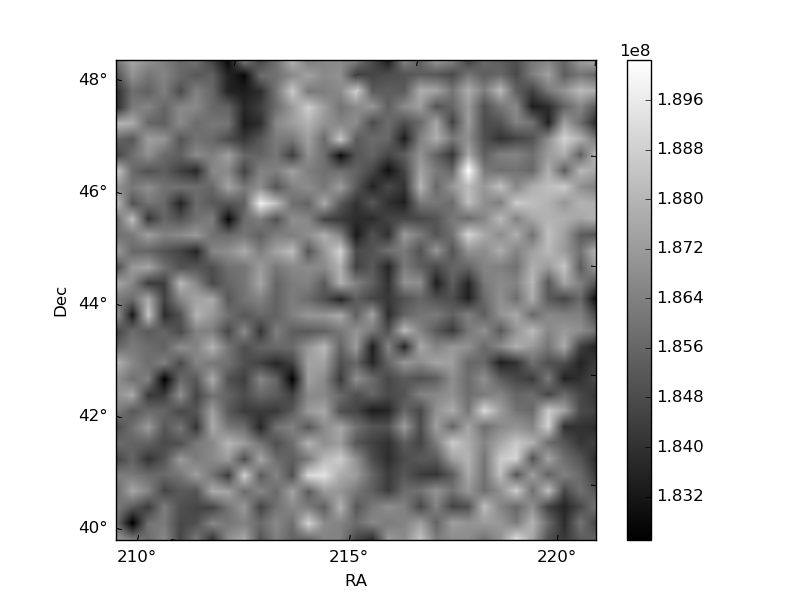
Quadrant B |
|---|---|---|---|
| Quadrant D | 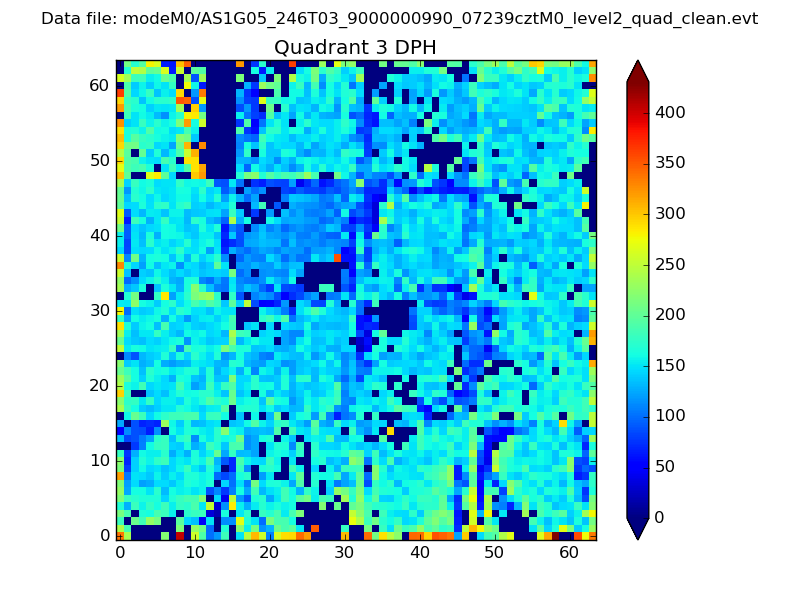 |
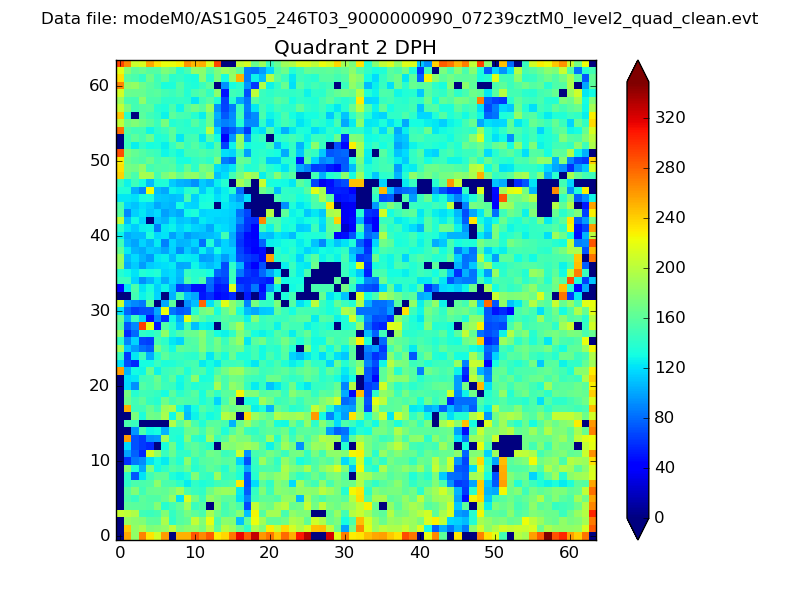 |
Quadrant C |
| Plot type | Count rate plots | Images |
|---|---|---|
| Comparison with Poisson distribution Blue bars denote a histogram of data divided into 1 sec bins. Red curve is a Poisson curve with rate = median count rate of data. |
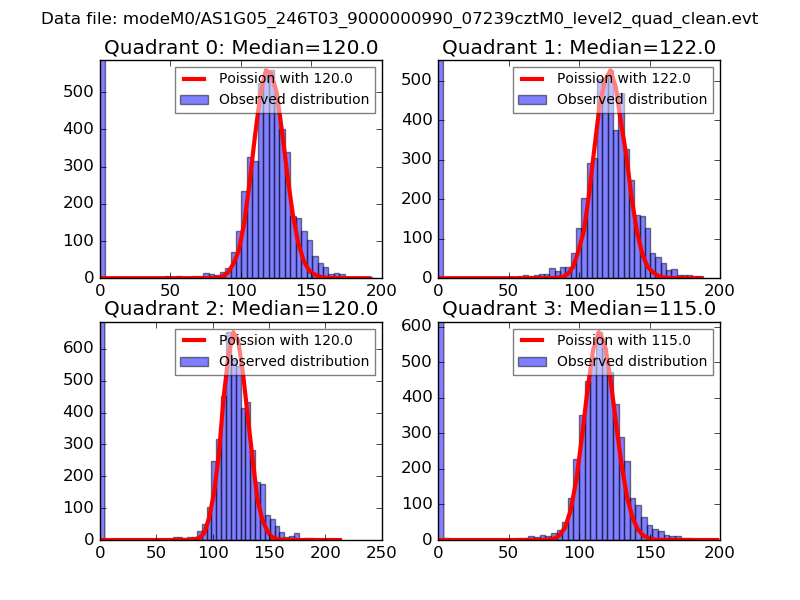 |
 |
| Quadrant-wise count rates Data is divided into 100 sec bins |
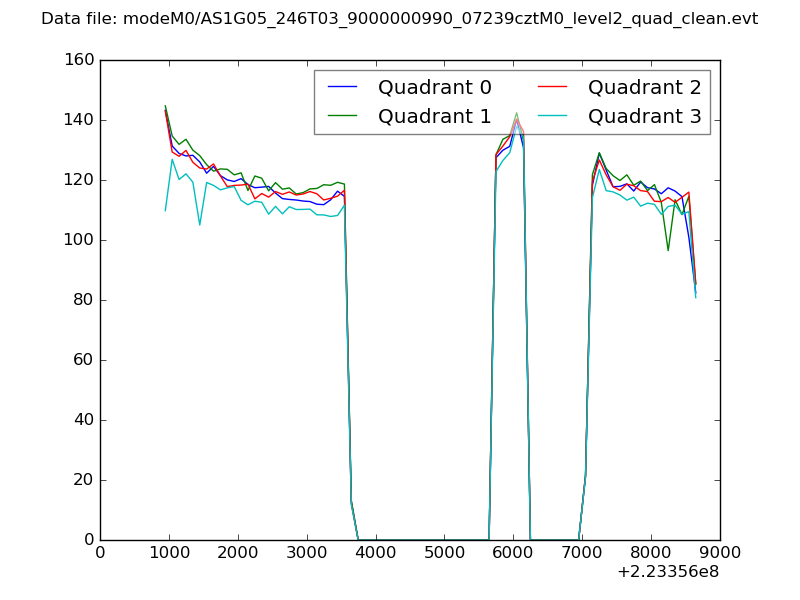 |
|
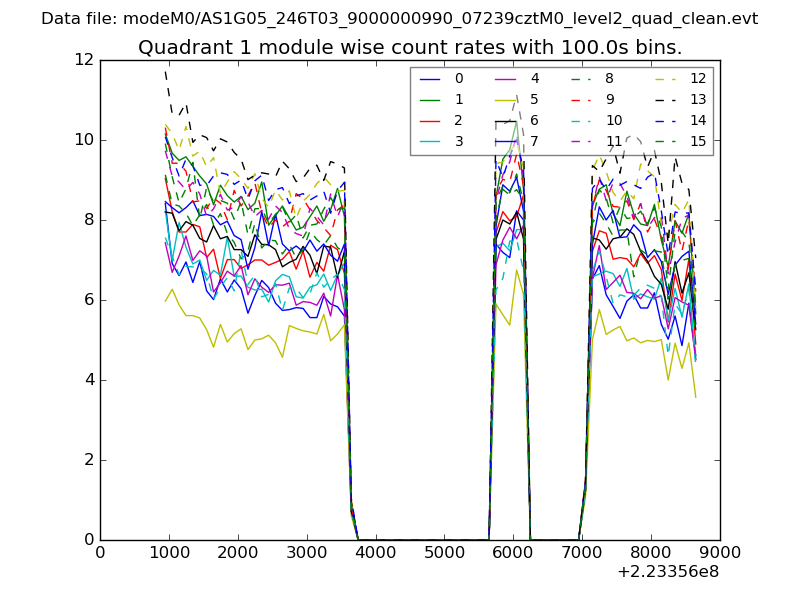
| Module-wise count rates for Quadrant A Data is divided into 100 sec bins |
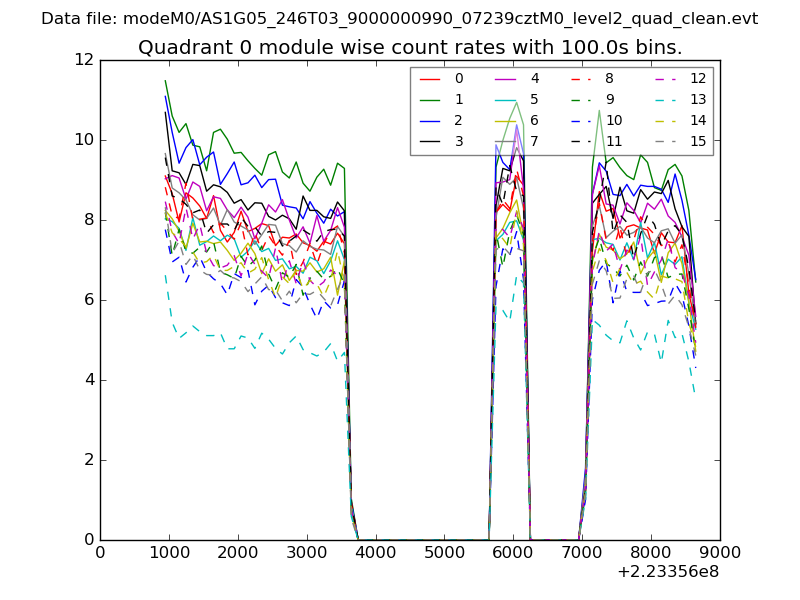 |
 |
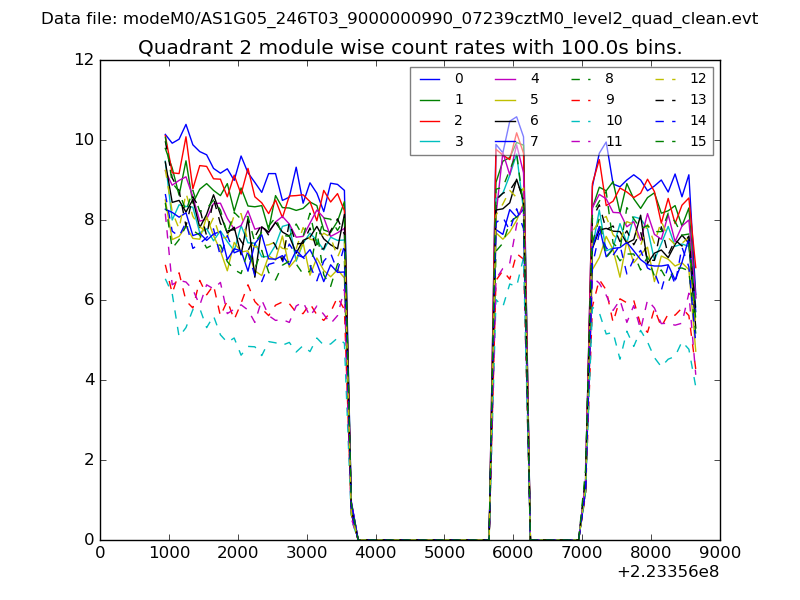
| Module-wise count rates for Quadrant B Data is divided into 100 sec bins |
 |
 |
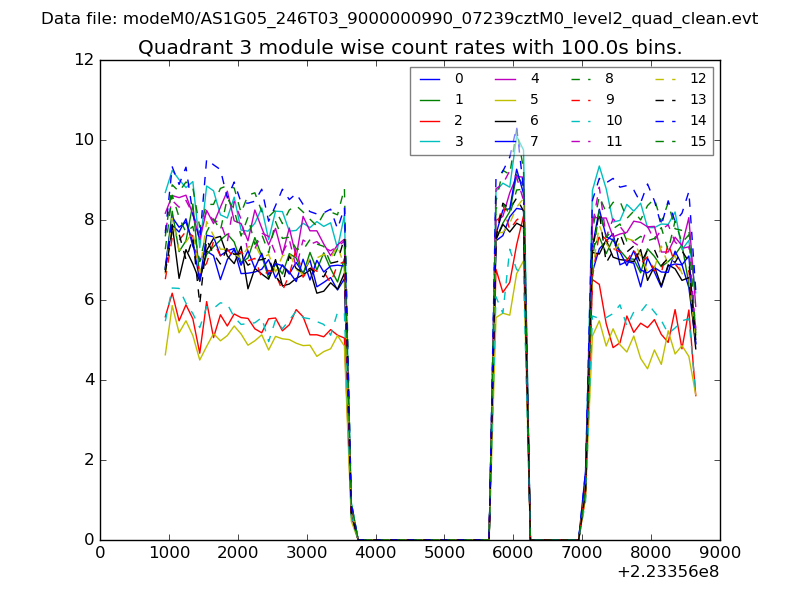
| Module-wise count rates for Quadrant C Data is divided into 100 sec bins |
 |
 |
| Module-wise count rates for Quadrant D Data is divided into 100 sec bins |
 |
 |
| Parameter | Plot |
|---|---|
| CZT HV Monitor | 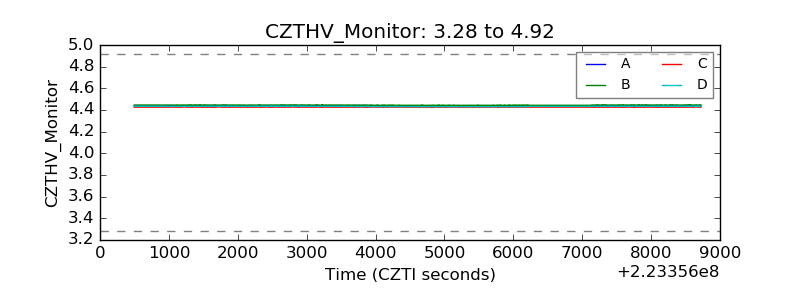 |
| D_VDD | 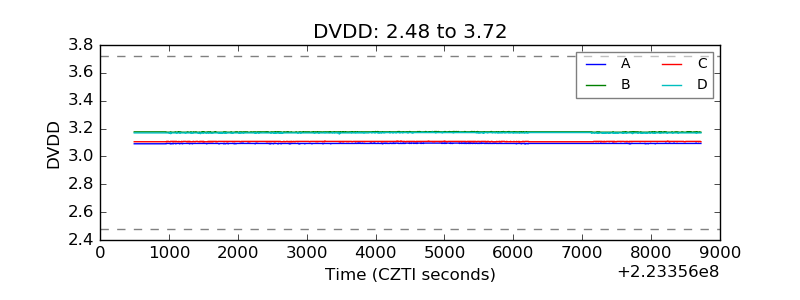 |
| Temperature 1 | 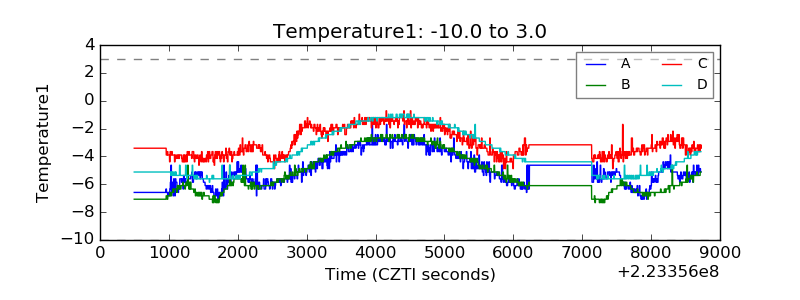 |
| Veto HV Monitor | 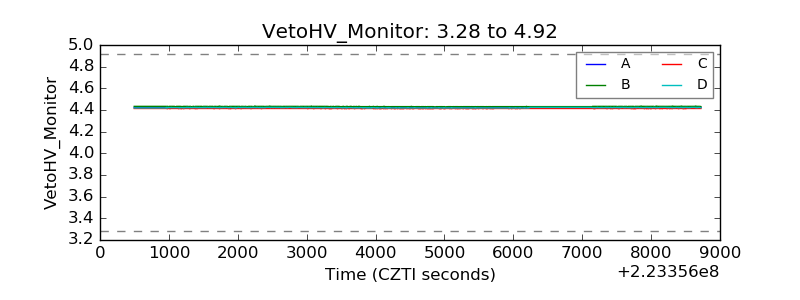 |
| Veto LLD | 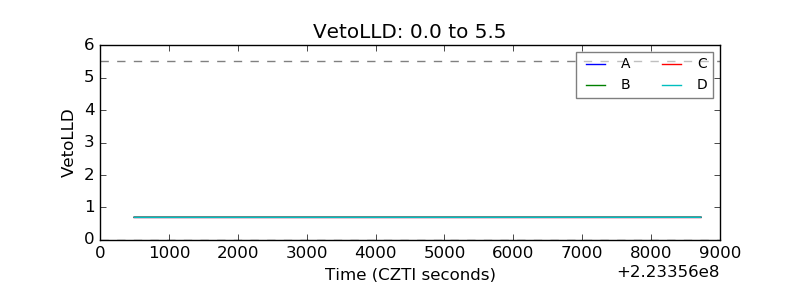 |
| Alpha Counter | 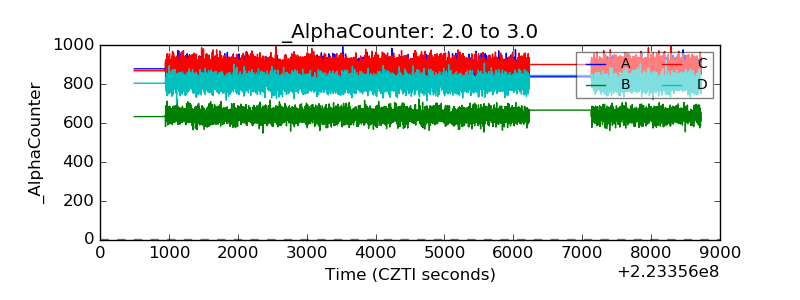 |
| _CPM_Rate | 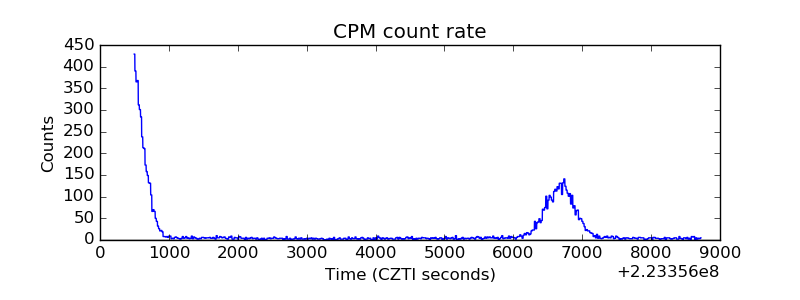 |
| CZT Counter | 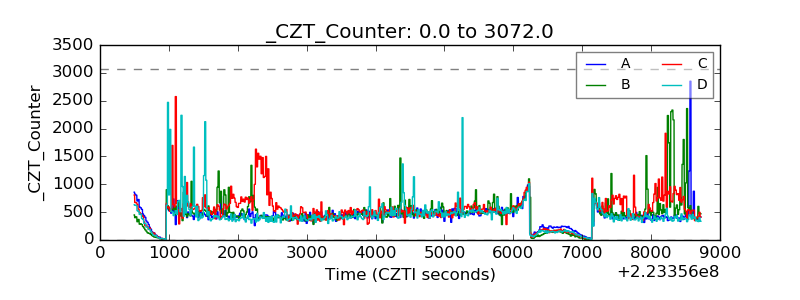 |
| +2.5 Volts monitor |  |
| +5 Volts monitor |  |
| _ROLL_ROT | 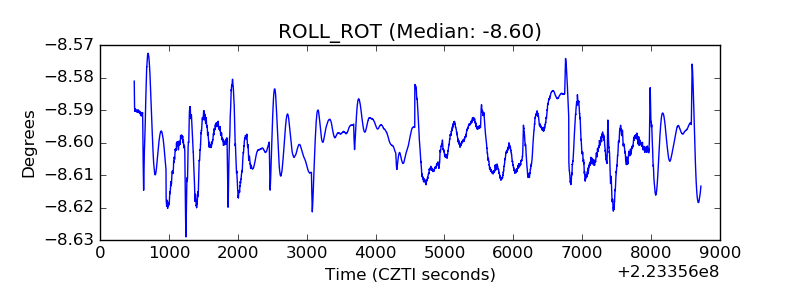 |
| _Roll_DEC | 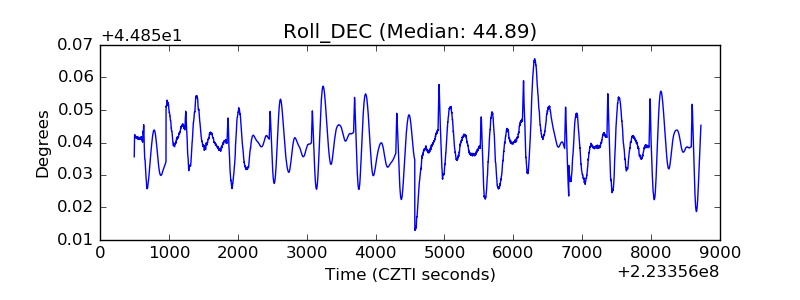 |
| _Roll_RA | 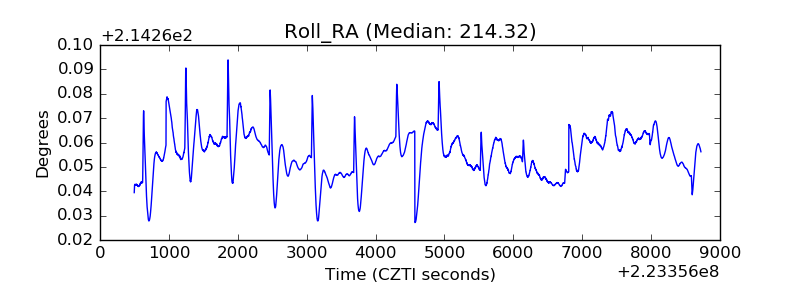 |
| Veto Counter | 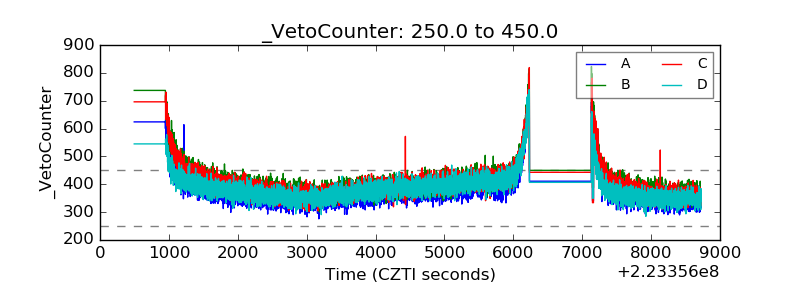 |