| Param | Original file | Final file |
|---|---|---|
| Filename | modeM0/AS1G05_246T03_9000000990_07241cztM0_level2.evt | modeM0/AS1G05_246T03_9000000990_07241cztM0_level2_quad_clean.evt |
| Size (bytes) | 490,821,120 | 97,819,200 |
| Size | 468.1 MB | 93.3 MB |
| Events in quadrant A | 3,427,827 | 614,783 |
| Events in quadrant B | 3,633,534 | 628,257 |
| Events in quadrant C | 3,309,496 | 620,516 |
| Events in quadrant D | 3,992,822 | 585,863 |
| Mode M0 | |||
|---|---|---|---|
| Quadrant | BADHDUFLAG | Total packets | Discarded packets |
| A | 0 | 15355 | 2 |
| B | 0 | 15817 | 1 |
| C | 0 | 15136 | 1 |
| D | 0 | 16838 | 1 |
| Mode SS | |||
|---|---|---|---|
| Quadrant | BADHDUFLAG | Total packets | Discarded packets |
| A | 0 | 148 | 0 |
| B | 0 | 148 | 0 |
| C | 0 | 148 | 0 |
| D | 0 | 148 | 0 |
| Quadrant | Total seconds | Saturated seconds | Saturation percentage |
|---|---|---|---|
| A | 7364 | 173 | 2.349267% |
| B | 7364 | 160 | 2.172732% |
| C | 7364 | 49 | 0.665399% |
| D | 7364 | 244 | 3.313417% |
Noise dominated data is calculated using 1-second bins in cleaned event files. If a bin has >2000 counts, and if more than 50% of those come from <1% of pixels, then it is considered to be noise-dominated and hence unusable.
| Quadrant | # 1 sec bins | Bins with >0 counts | Bins with >2000 counts | High rate bins dominated by noise | Noise dominated (total time) | Noise dominated (detector-on time) | Marked lightcurve |
|---|---|---|---|---|---|---|---|
| A | 7389 | 7365 | 32 | 32 | 0.43% | 0.43% | 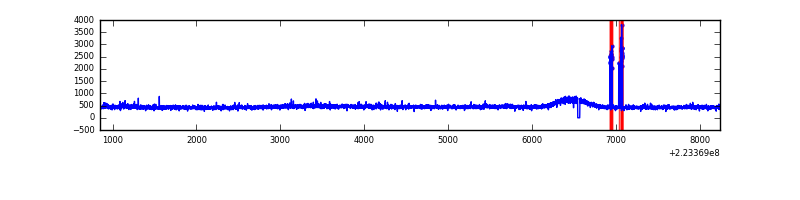 |
| B | 7389 | 7364 | 33 | 33 | 0.45% | 0.45% | 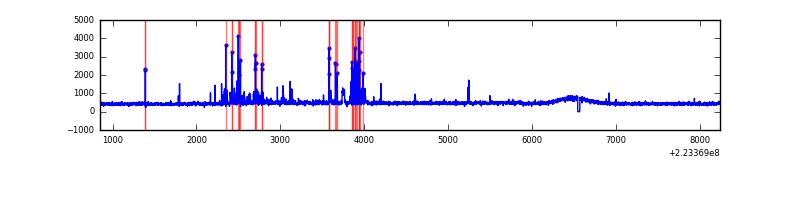 |
| C | 7389 | 7365 | 0 | 0 | 0.00% | 0.00% | 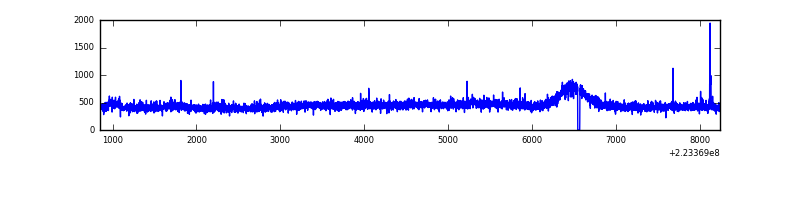 |
| D | 7389 | 7365 | 91 | 91 | 1.23% | 1.24% | 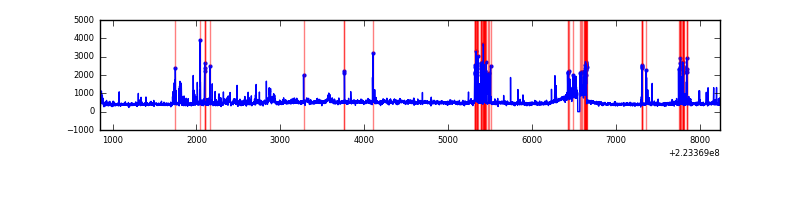 |
Top three noisy pixels from each quadrant. If the there are fewer than three noisy pixels in the level2.evt file, extra rows are filled as -1
| Pixel properties | Quadrant properties | ||||||
|---|---|---|---|---|---|---|---|
| Quadrant | DetID | PixID | Counts | Sigma | Mean | Median | Sigma |
| A | 0 | 23 | 81475 | 459.38 | 848 | 827 | 175.6 |
| A | 8 | 15 | 64113 | 360.49 | 848 | 827 | 175.6 |
| A | 0 | 226 | 13779 | 73.78 | 848 | 827 | 175.6 |
| B | 10 | 16 | 155536 | 945.46 | 851 | 830 | 163.6 |
| B | 0 | 214 | 80459 | 486.64 | 851 | 830 | 163.6 |
| B | 4 | 81 | 41467 | 248.35 | 851 | 830 | 163.6 |
| C | 9 | 68 | 74325 | 385.68 | 821 | 821 | 190.6 |
| C | 10 | 22 | 21315 | 107.53 | 821 | 821 | 190.6 |
| C | 13 | 61 | 6310 | 28.8 | 821 | 821 | 190.6 |
| D | 2 | 14 | 358317 | 1779.91 | 813 | 786 | 200.9 |
| D | 2 | 216 | 139461 | 690.37 | 813 | 786 | 200.9 |
| D | 1 | 20 | 119642 | 591.7 | 813 | 786 | 200.9 |
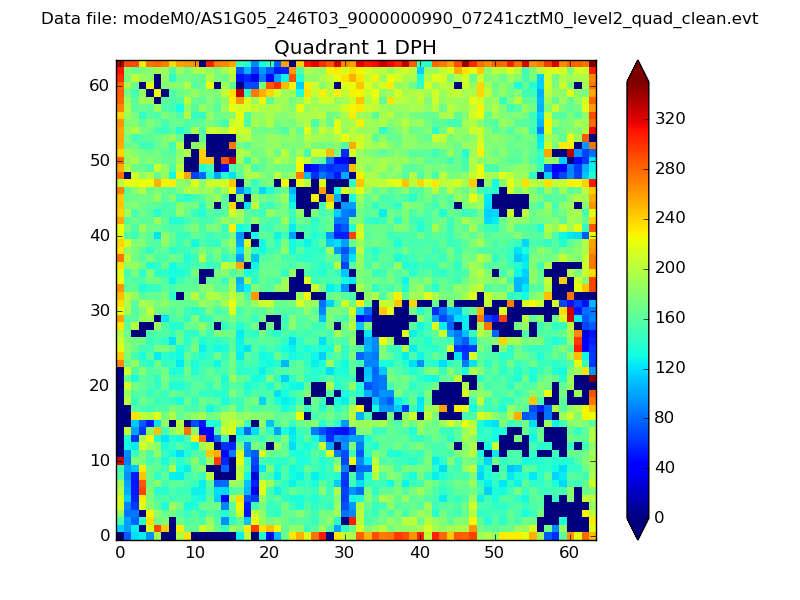
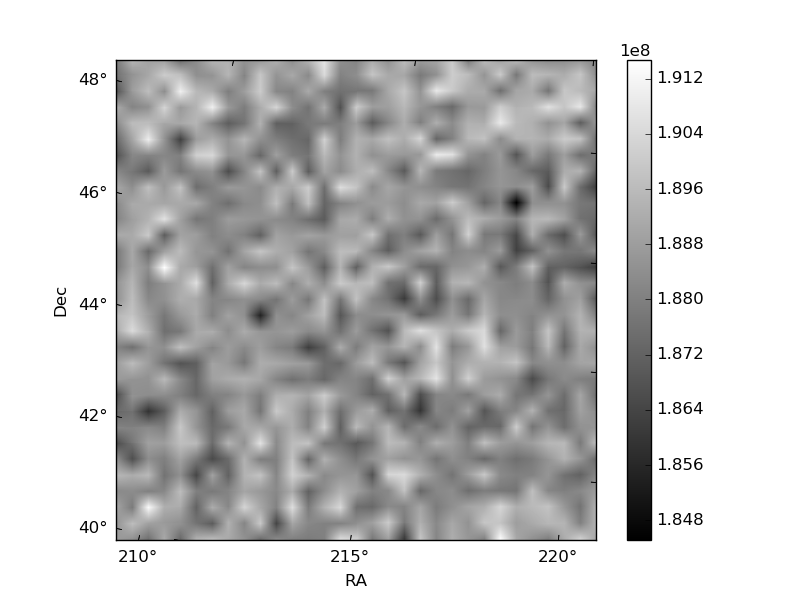
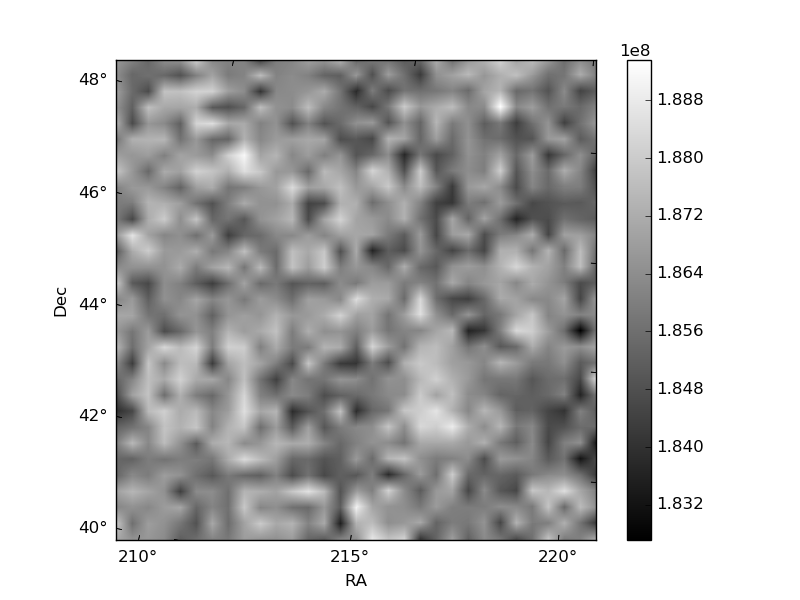
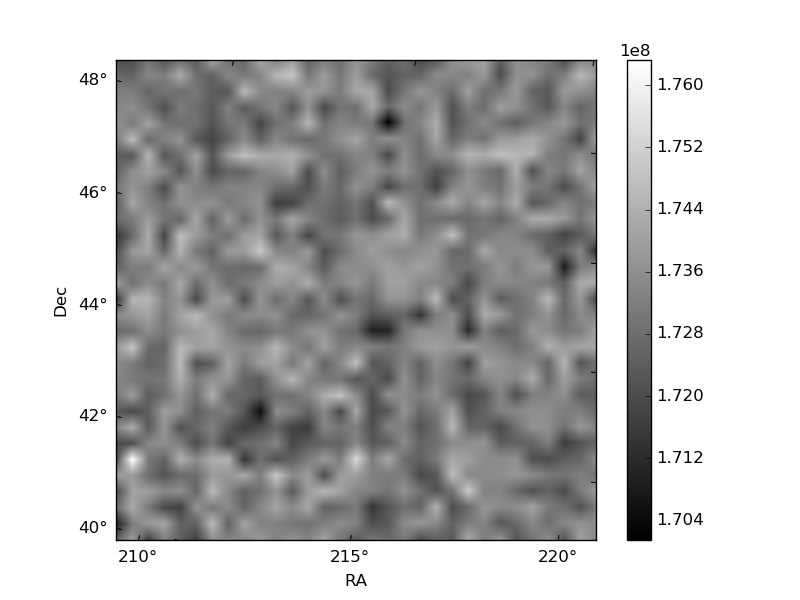
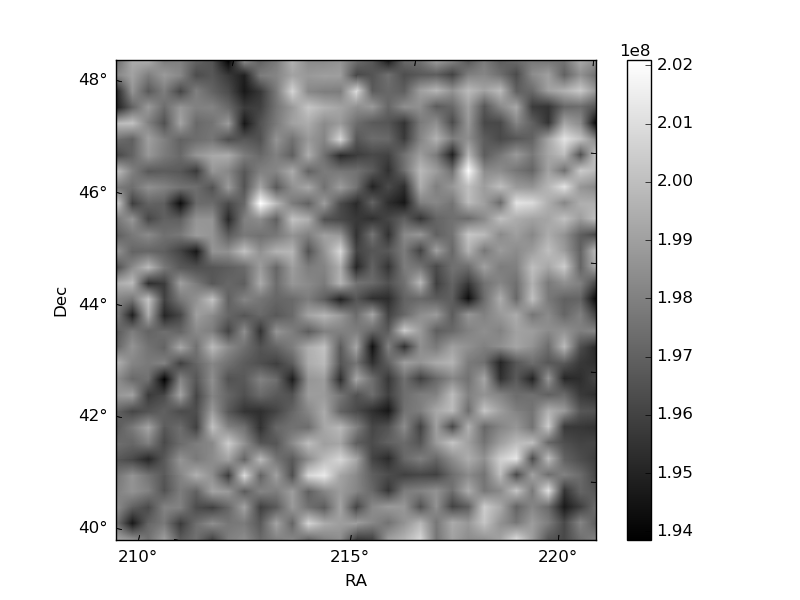
Histogram calculated using DETX and DETY for each event in the final _common_clean file
| Quadrant A |  |
 |
Quadrant B |
|---|---|---|---|
| Quadrant D | 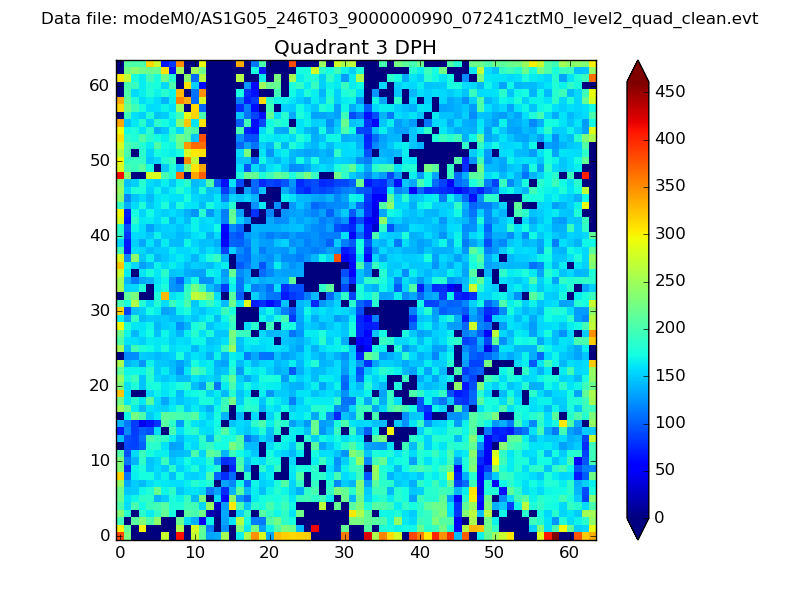 |
 |
Quadrant C |
| Plot type | Count rate plots | Images |
|---|---|---|
| Comparison with Poisson distribution Blue bars denote a histogram of data divided into 1 sec bins. Red curve is a Poisson curve with rate = median count rate of data. |
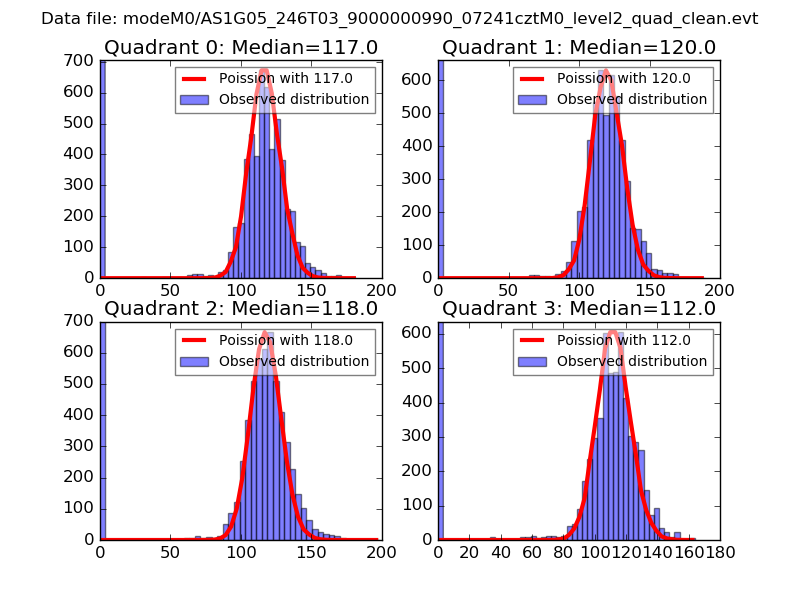 |
 |
| Quadrant-wise count rates Data is divided into 100 sec bins |
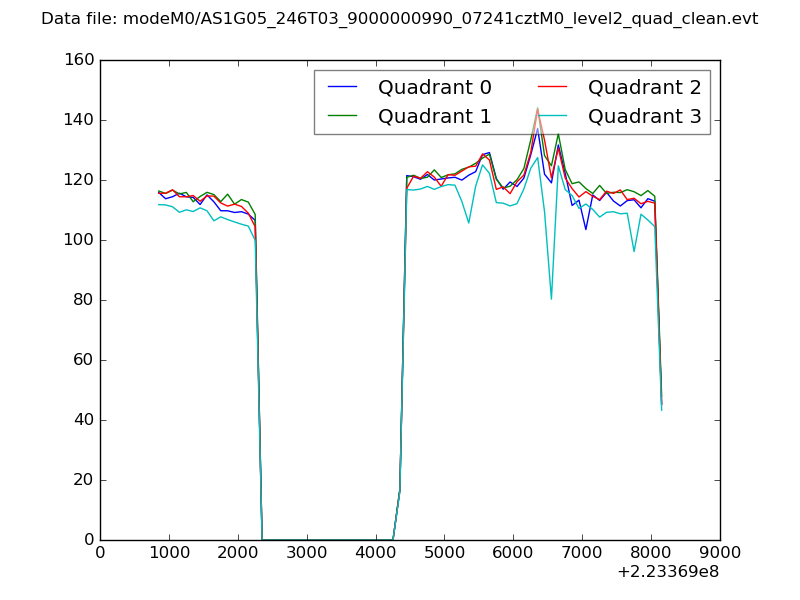 |
|
| Module-wise count rates for Quadrant A Data is divided into 100 sec bins |
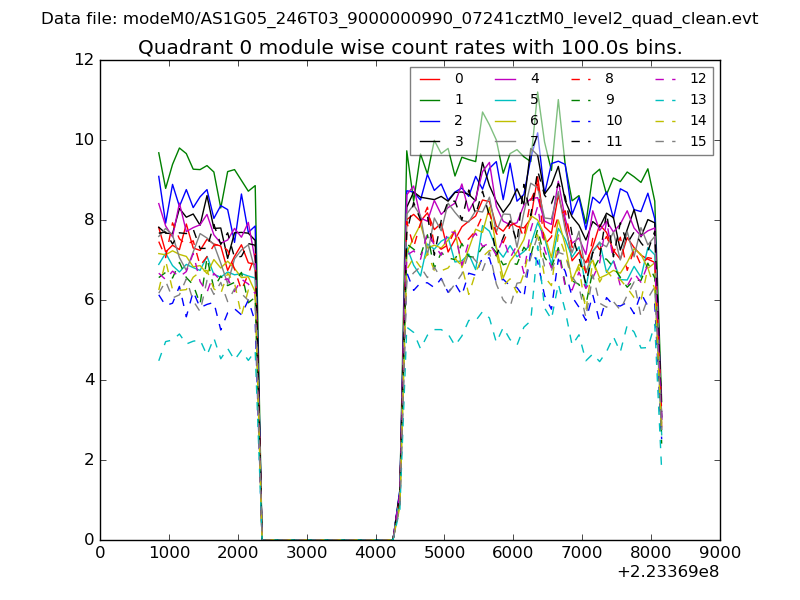 |
 |
| Module-wise count rates for Quadrant B Data is divided into 100 sec bins |
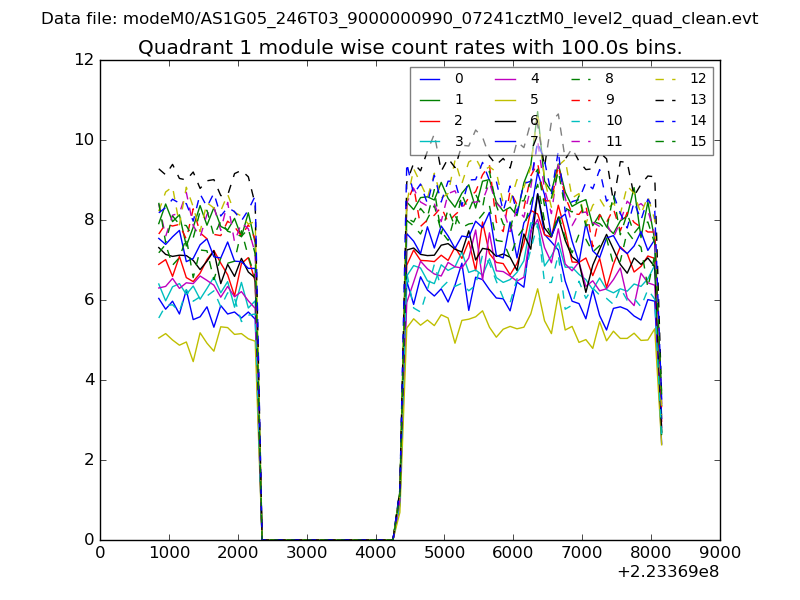 |
 |
| Module-wise count rates for Quadrant C Data is divided into 100 sec bins |
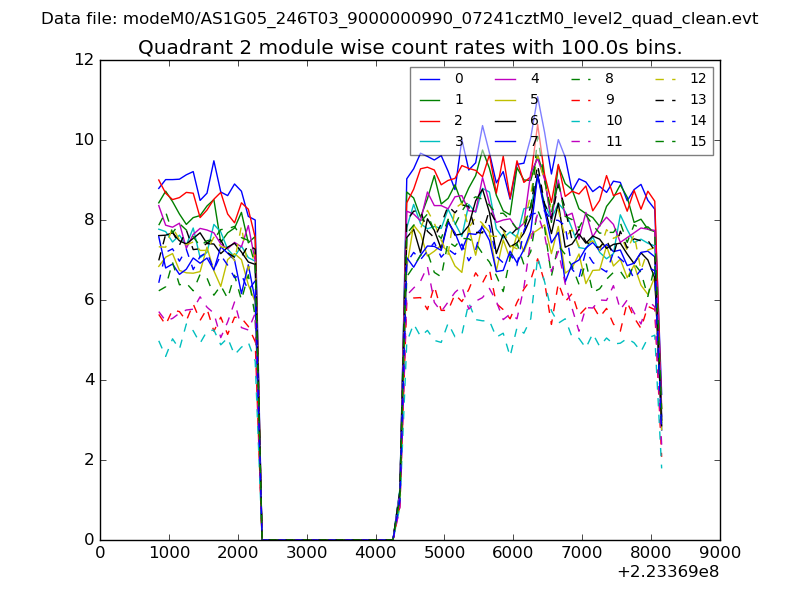 |
 |
| Module-wise count rates for Quadrant D Data is divided into 100 sec bins |
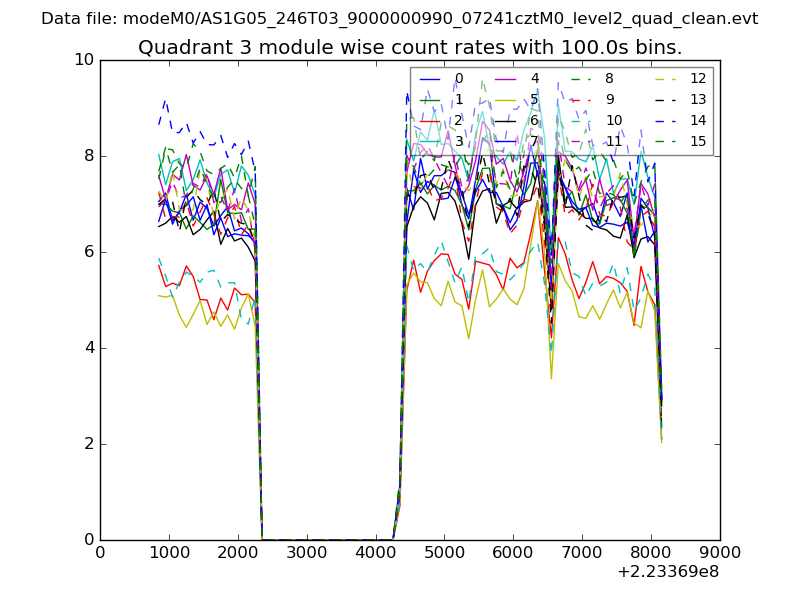 |
 |
| Parameter | Plot |
|---|---|
| CZT HV Monitor | 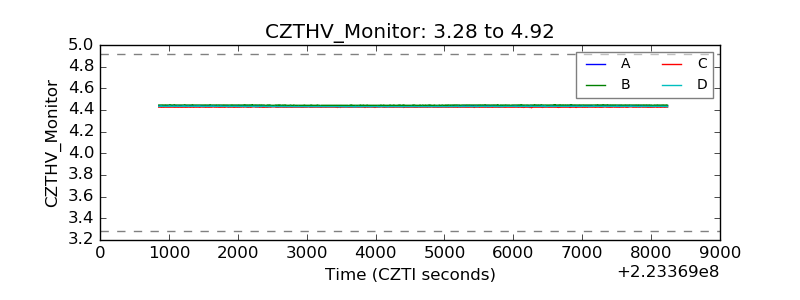 |
| D_VDD | 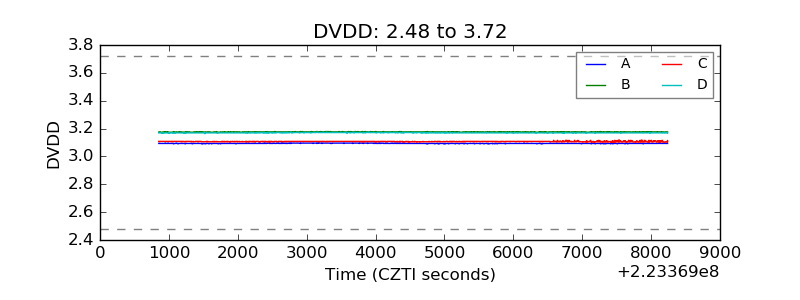 |
| Temperature 1 | 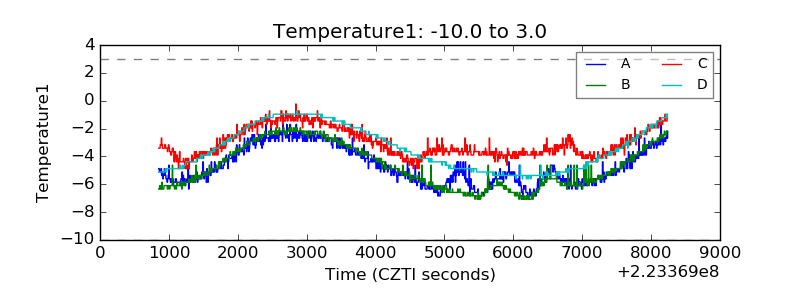 |
| Veto HV Monitor | 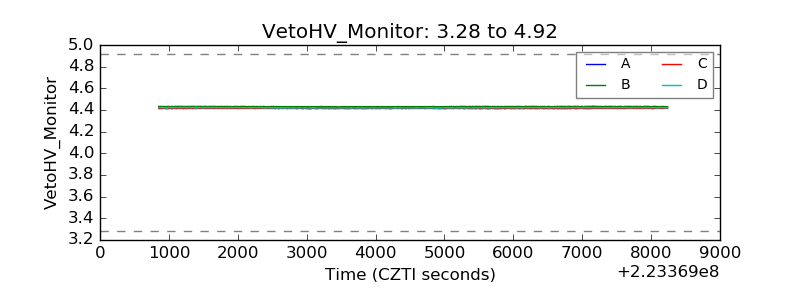 |
| Veto LLD | 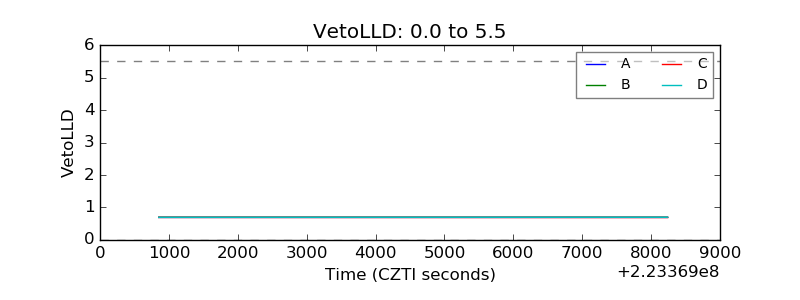 |
| Alpha Counter | 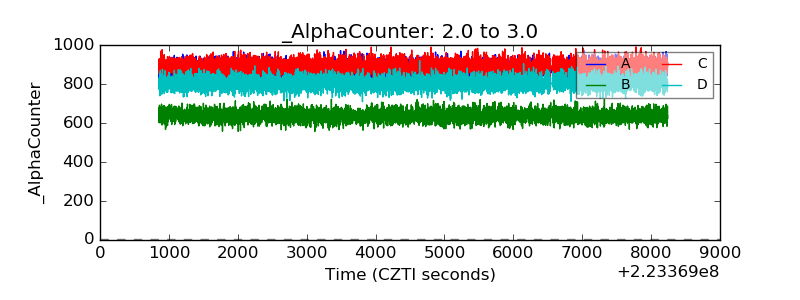 |
| _CPM_Rate | 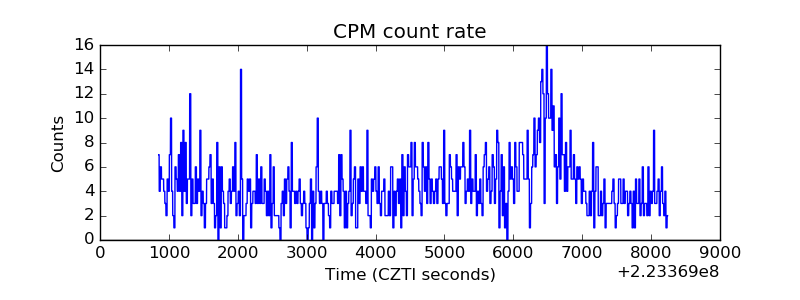 |
| CZT Counter | 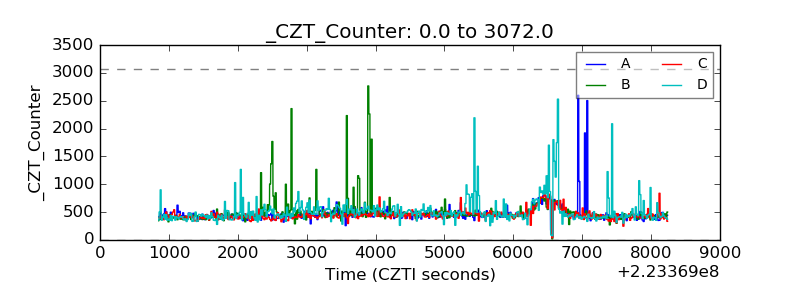 |
| +2.5 Volts monitor |  |
| +5 Volts monitor |  |
| _ROLL_ROT | 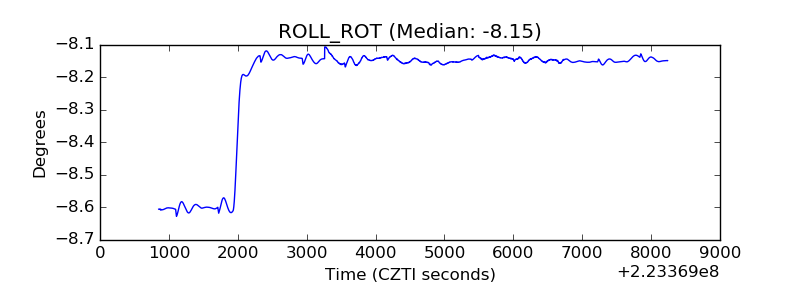 |
| _Roll_DEC | 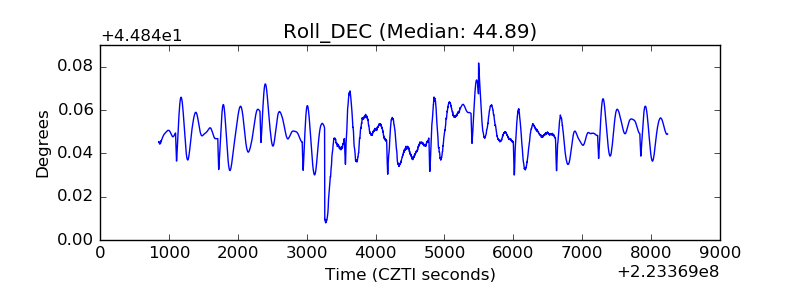 |
| _Roll_RA | 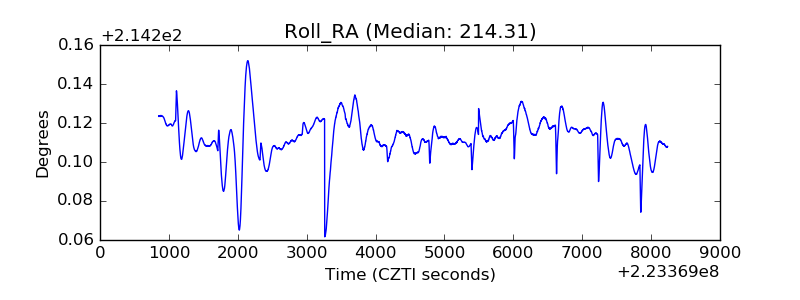 |
| Veto Counter | 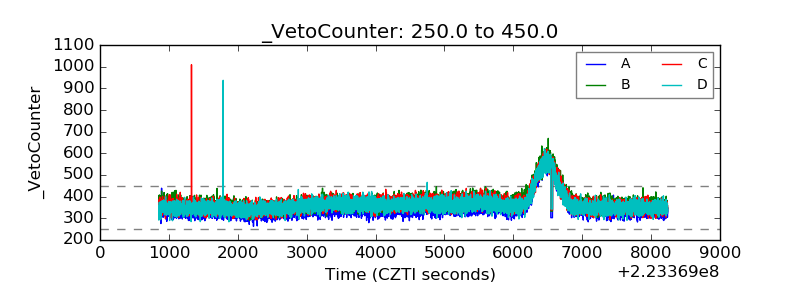 |