| Param | Original file | Final file |
|---|---|---|
| Filename | modeM0/AS1G05_246T03_9000000990_07242cztM0_level2.evt | modeM0/AS1G05_246T03_9000000990_07242cztM0_level2_quad_clean.evt |
| Size (bytes) | 518,045,760 | 96,105,600 |
| Size | 494.0 MB | 91.7 MB |
| Events in quadrant A | 3,911,240 | 591,804 |
| Events in quadrant B | 3,720,167 | 608,486 |
| Events in quadrant C | 3,542,540 | 599,435 |
| Events in quadrant D | 3,990,044 | 573,071 |
| Mode M0 | |||
|---|---|---|---|
| Quadrant | BADHDUFLAG | Total packets | Discarded packets |
| A | 0 | 17015 | 2 |
| B | 0 | 16250 | 1 |
| C | 0 | 15917 | 1 |
| D | 0 | 17353 | 1 |
| Mode M9 | |||
|---|---|---|---|
| Quadrant | BADHDUFLAG | Total packets | Discarded packets |
| A | 0 | 1 | 0 |
| B | 0 | 1 | 0 |
| C | 0 | 1 | 0 |
| D | 0 | 1 | 0 |
| Mode SS | |||
|---|---|---|---|
| Quadrant | BADHDUFLAG | Total packets | Discarded packets |
| A | 0 | 158 | 0 |
| B | 0 | 158 | 0 |
| C | 0 | 158 | 0 |
| D | 0 | 158 | 0 |
| Quadrant | Total seconds | Saturated seconds | Saturation percentage |
|---|---|---|---|
| A | 7720 | 316 | 4.093264% |
| B | 7720 | 160 | 2.072539% |
| C | 7720 | 122 | 1.580311% |
| D | 7720 | 195 | 2.525907% |
Noise dominated data is calculated using 1-second bins in cleaned event files. If a bin has >2000 counts, and if more than 50% of those come from <1% of pixels, then it is considered to be noise-dominated and hence unusable.
| Quadrant | # 1 sec bins | Bins with >0 counts | Bins with >2000 counts | High rate bins dominated by noise | Noise dominated (total time) | Noise dominated (detector-on time) | Marked lightcurve |
|---|---|---|---|---|---|---|---|
| A | 7835 | 7722 | 88 | 88 | 1.12% | 1.14% | 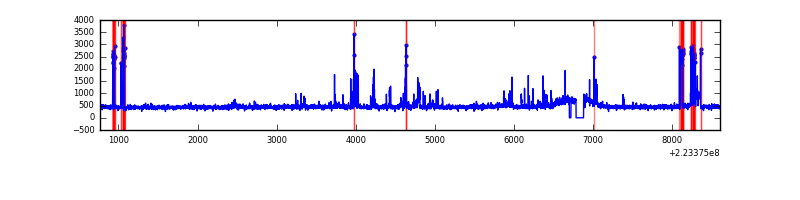 |
| B | 7835 | 7722 | 7 | 7 | 0.09% | 0.09% | 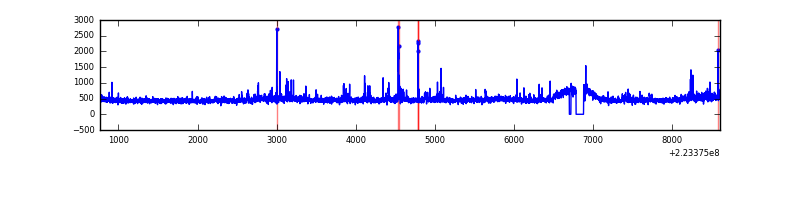 |
| C | 7835 | 7721 | 0 | 0 | 0.00% | 0.00% | 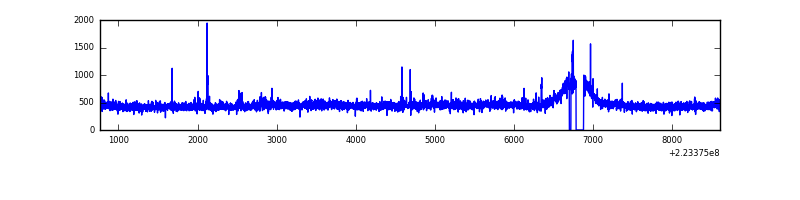 |
| D | 7835 | 7721 | 52 | 52 | 0.66% | 0.67% | 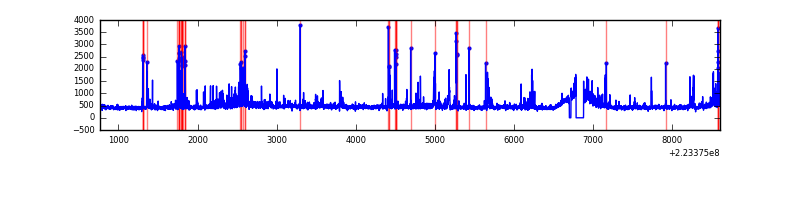 |
Top three noisy pixels from each quadrant. If the there are fewer than three noisy pixels in the level2.evt file, extra rows are filled as -1
| Pixel properties | Quadrant properties | ||||||
|---|---|---|---|---|---|---|---|
| Quadrant | DetID | PixID | Counts | Sigma | Mean | Median | Sigma |
| A | 0 | 23 | 233334 | 1275.42 | 884 | 861 | 182.3 |
| A | 14 | 111 | 219843 | 1201.41 | 884 | 861 | 182.3 |
| A | 0 | 226 | 24802 | 131.35 | 884 | 861 | 182.3 |
| B | 0 | 214 | 107363 | 618.38 | 896 | 875 | 172.2 |
| B | 4 | 81 | 53873 | 307.76 | 896 | 875 | 172.2 |
| B | 0 | 228 | 24076 | 134.73 | 896 | 875 | 172.2 |
| C | 9 | 68 | 130521 | 645.47 | 862 | 862 | 200.9 |
| C | 10 | 22 | 22636 | 108.4 | 862 | 862 | 200.9 |
| C | 8 | 128 | 13338 | 62.11 | 862 | 862 | 200.9 |
| D | 2 | 216 | 156902 | 733.51 | 860 | 831 | 212.8 |
| D | 2 | 14 | 144029 | 673.01 | 860 | 831 | 212.8 |
| D | 2 | 206 | 95025 | 442.7 | 860 | 831 | 212.8 |
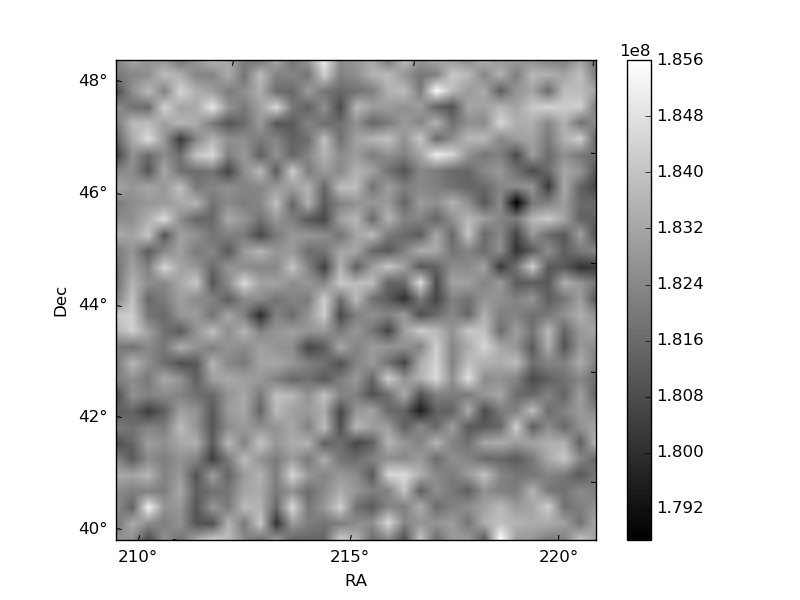
Histogram calculated using DETX and DETY for each event in the final _common_clean file
| Quadrant A | 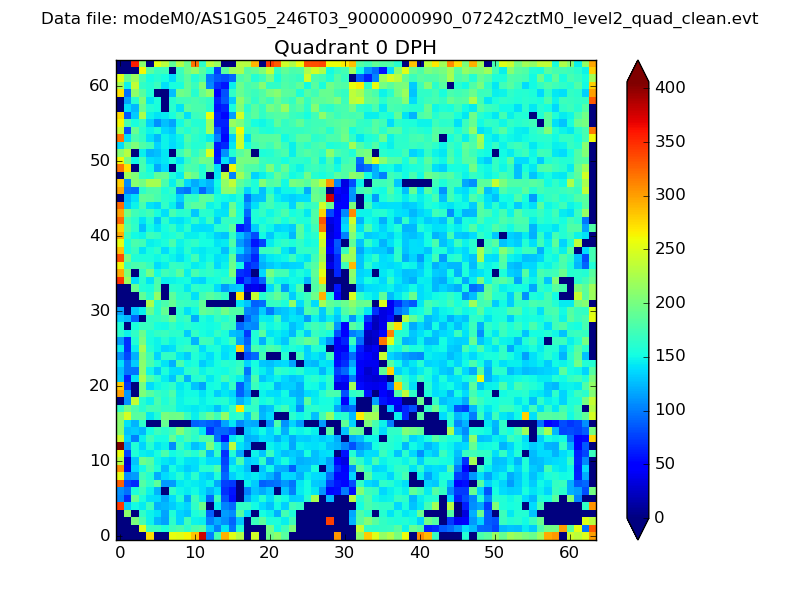 |
 |
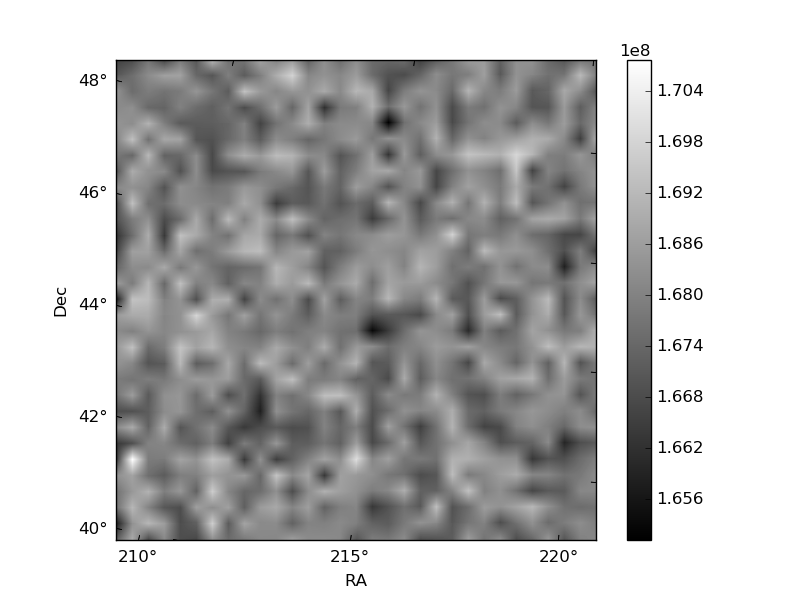
Quadrant B |
|---|---|---|---|
| Quadrant D |  |
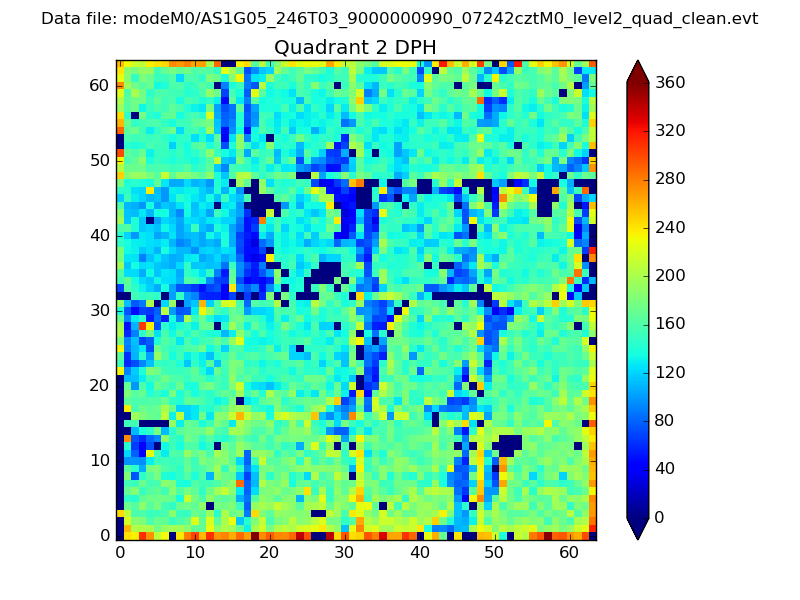 |
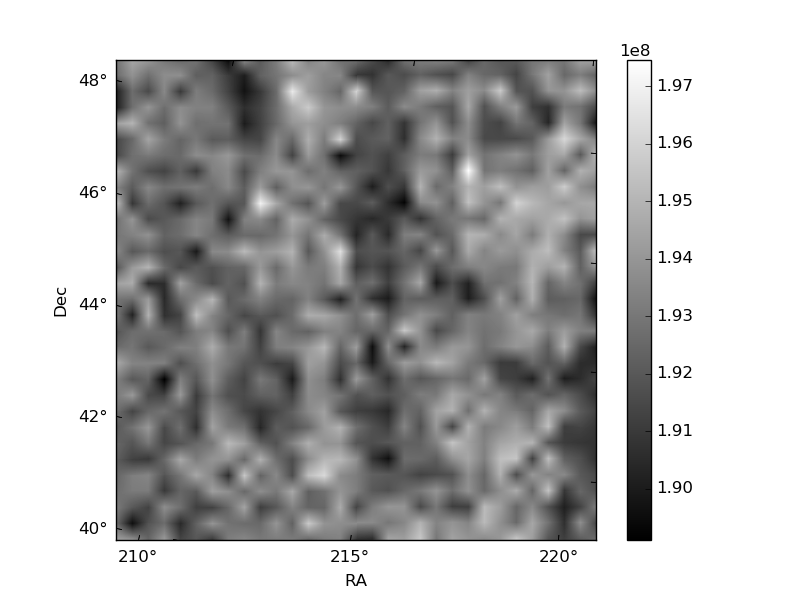
Quadrant C |
| Plot type | Count rate plots | Images |
|---|---|---|
| Comparison with Poisson distribution Blue bars denote a histogram of data divided into 1 sec bins. Red curve is a Poisson curve with rate = median count rate of data. |
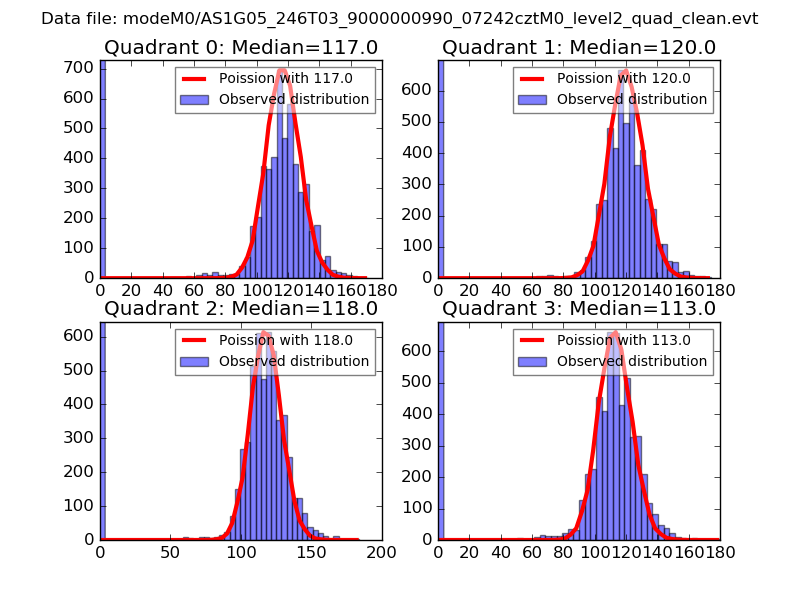 |
 |
| Quadrant-wise count rates Data is divided into 100 sec bins |
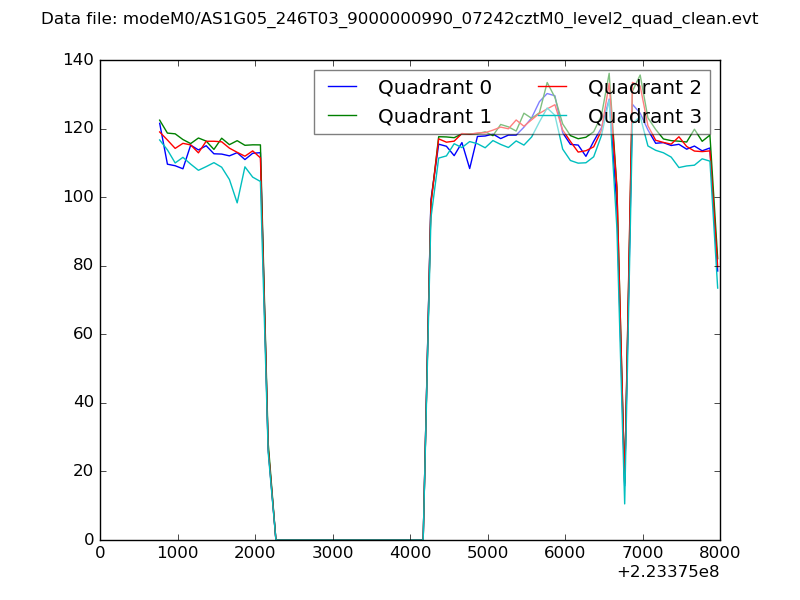 |
|
| Module-wise count rates for Quadrant A Data is divided into 100 sec bins |
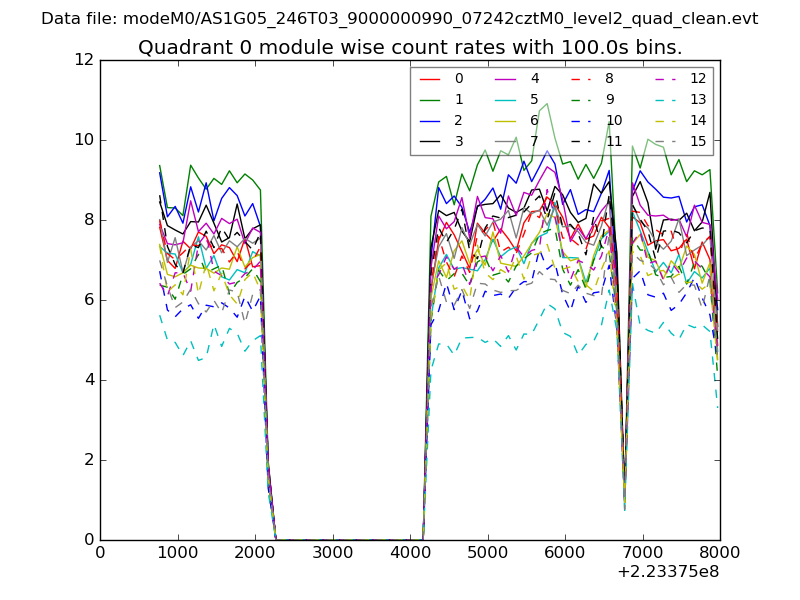 |
 |
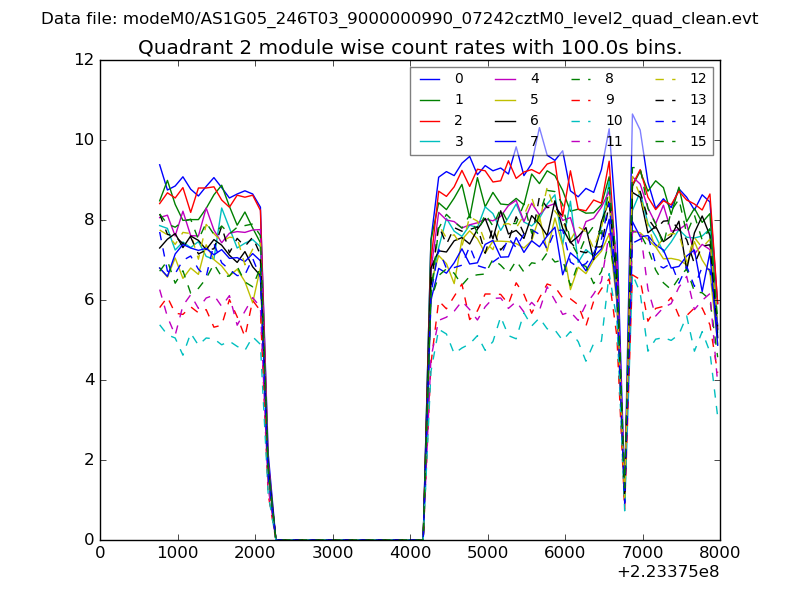
| Module-wise count rates for Quadrant B Data is divided into 100 sec bins |
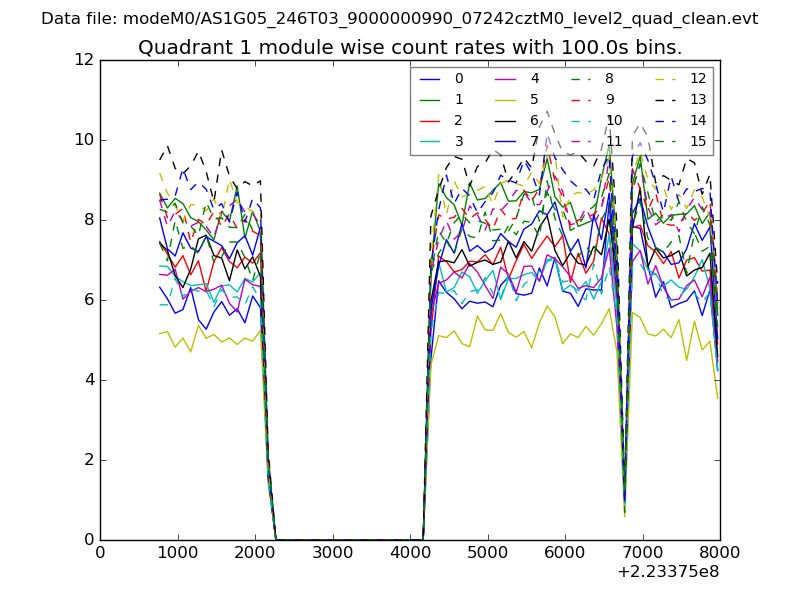 |
 |
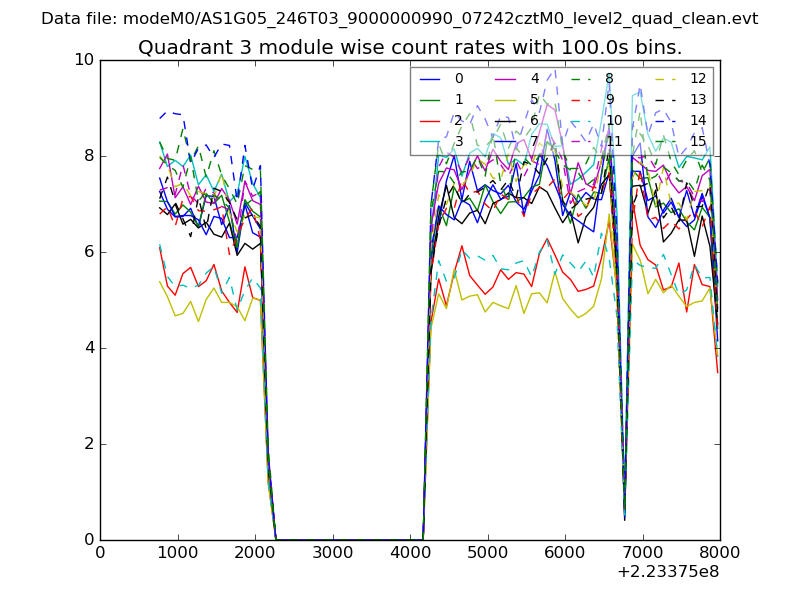
| Module-wise count rates for Quadrant C Data is divided into 100 sec bins |
 |
 |
| Module-wise count rates for Quadrant D Data is divided into 100 sec bins |
 |
 |
| Parameter | Plot |
|---|---|
| CZT HV Monitor | 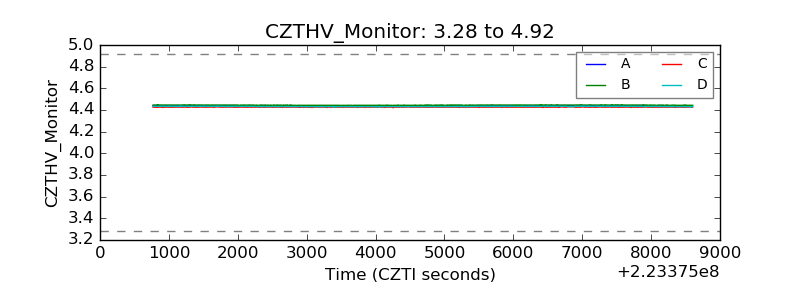 |
| D_VDD | 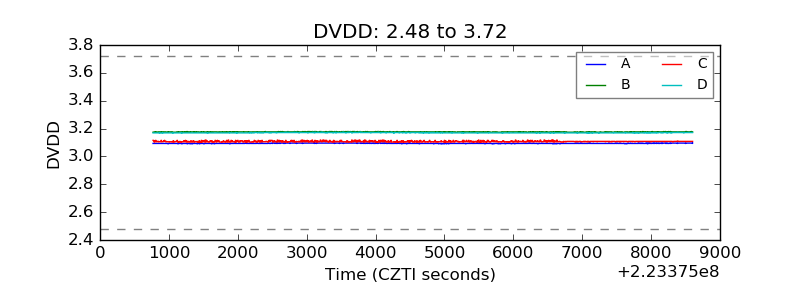 |
| Temperature 1 | 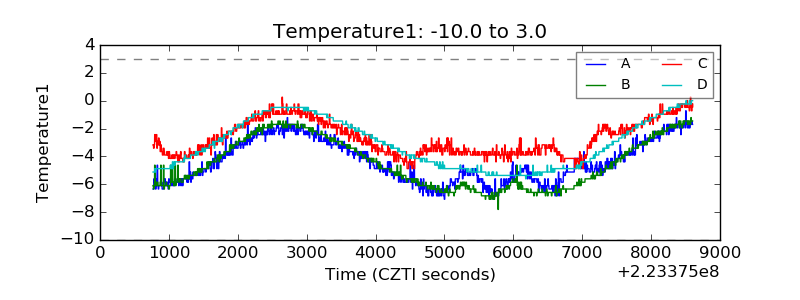 |
| Veto HV Monitor | 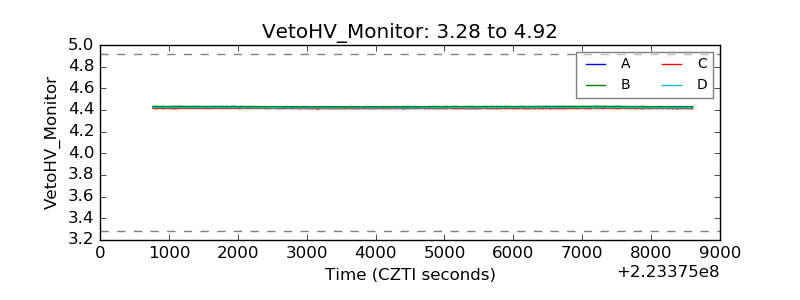 |
| Veto LLD | 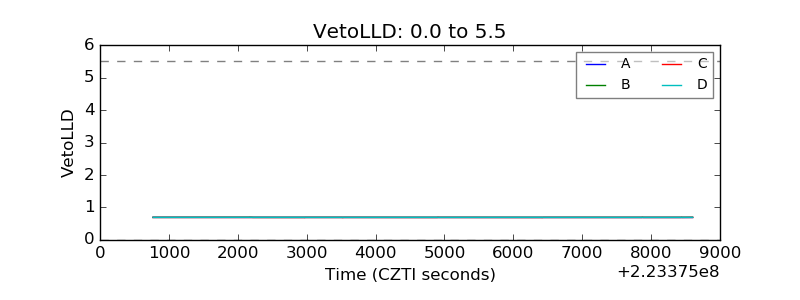 |
| Alpha Counter | 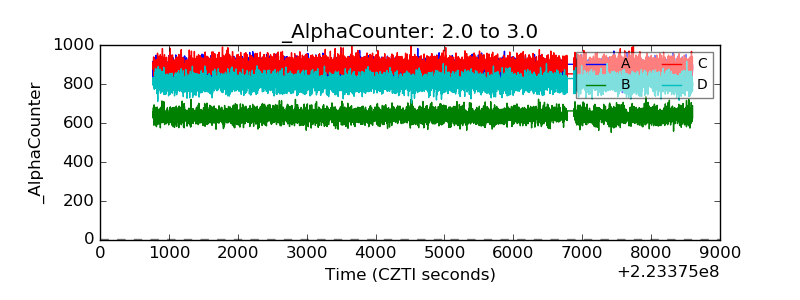 |
| _CPM_Rate | 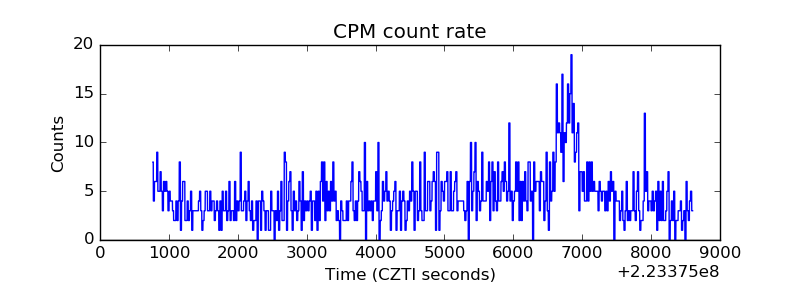 |
| CZT Counter |  |
| +2.5 Volts monitor |  |
| +5 Volts monitor |  |
| _ROLL_ROT | 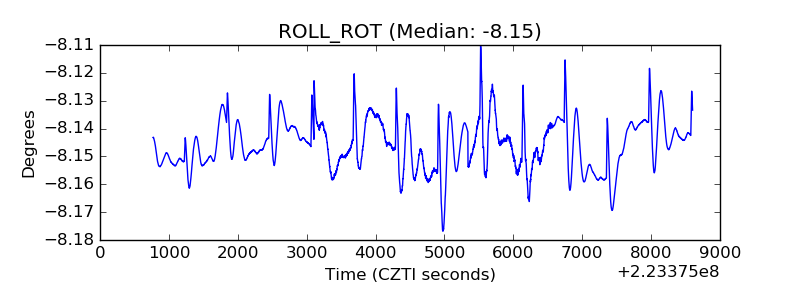 |
| _Roll_DEC | 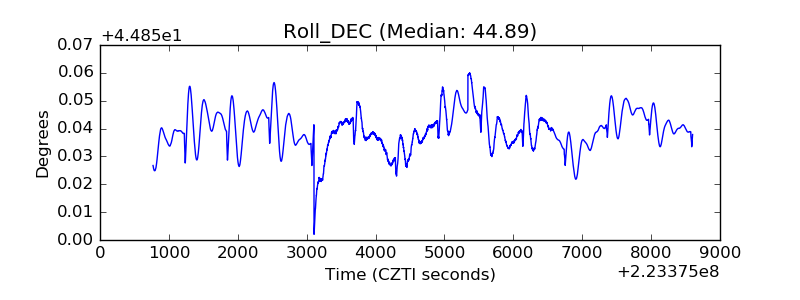 |
| _Roll_RA | 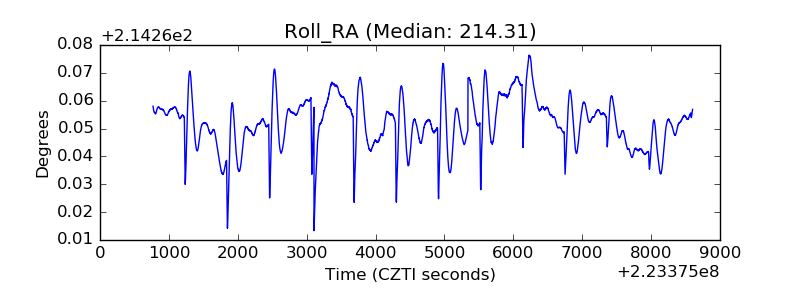 |
| Veto Counter | 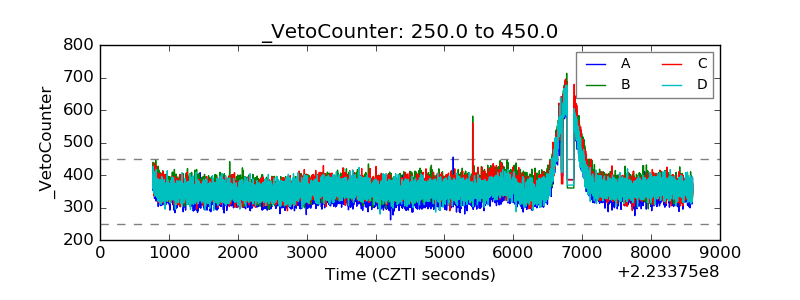 |