| Param | Original file | Final file |
|---|---|---|
| Filename | modeM0/AS1G05_246T03_9000000990_07245cztM0_level2.evt | modeM0/AS1G05_246T03_9000000990_07245cztM0_level2_quad_clean.evt |
| Size (bytes) | 1,339,804,800 | 199,699,200 |
| Size | 1.2 GB | 190.4 MB |
| Events in quadrant A | 8,681,569 | 1,216,939 |
| Events in quadrant B | 8,774,344 | 1,230,715 |
| Events in quadrant C | 10,910,860 | 1,204,787 |
| Events in quadrant D | 10,986,989 | 1,148,272 |
| Mode M0 | |||
|---|---|---|---|
| Quadrant | BADHDUFLAG | Total packets | Discarded packets |
| A | 0 | 38082 | 4 |
| B | 0 | 38185 | 3 |
| C | 0 | 45193 | 3 |
| D | 0 | 45346 | 3 |
| Mode M9 | |||
|---|---|---|---|
| Quadrant | BADHDUFLAG | Total packets | Discarded packets |
| A | 0 | 18 | 0 |
| B | 0 | 18 | 0 |
| C | 0 | 18 | 0 |
| D | 0 | 18 | 0 |
| Mode SS | |||
|---|---|---|---|
| Quadrant | BADHDUFLAG | Total packets | Discarded packets |
| A | 0 | 368 | 0 |
| B | 0 | 368 | 0 |
| C | 0 | 368 | 0 |
| D | 0 | 368 | 0 |
| Quadrant | Total seconds | Saturated seconds | Saturation percentage |
|---|---|---|---|
| A | 18094 | 307 | 1.696695% |
| B | 18094 | 238 | 1.315353% |
| C | 18094 | 199 | 1.099812% |
| D | 18094 | 700 | 3.868686% |
Noise dominated data is calculated using 1-second bins in cleaned event files. If a bin has >2000 counts, and if more than 50% of those come from <1% of pixels, then it is considered to be noise-dominated and hence unusable.
| Quadrant | # 1 sec bins | Bins with >0 counts | Bins with >2000 counts | High rate bins dominated by noise | Noise dominated (total time) | Noise dominated (detector-on time) | Marked lightcurve |
|---|---|---|---|---|---|---|---|
| A | 19894 | 18094 | 104 | 104 | 0.52% | 0.57% | 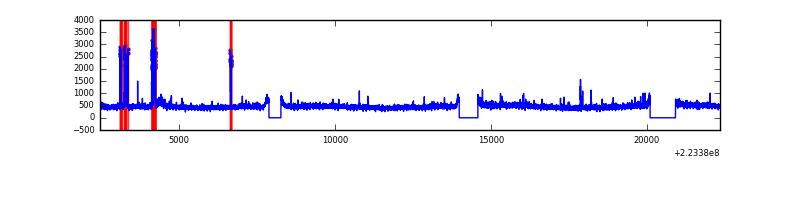 |
| B | 19894 | 18094 | 27 | 27 | 0.14% | 0.15% | 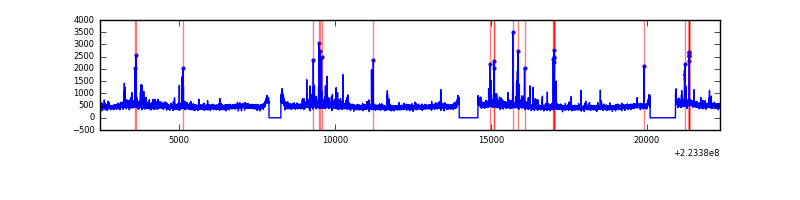 |
| C | 19894 | 18094 | 15 | 15 | 0.08% | 0.08% | 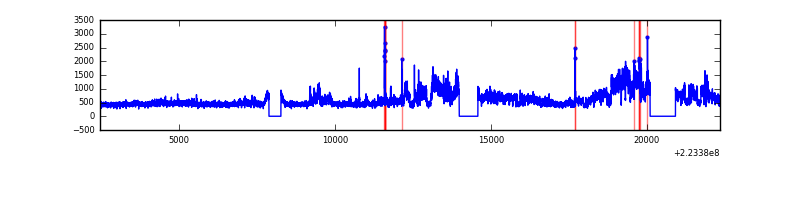 |
| D | 19894 | 18094 | 426 | 426 | 2.14% | 2.35% | 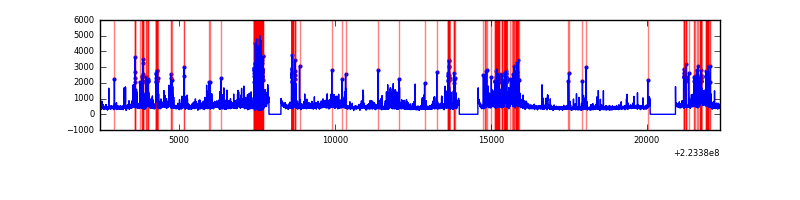 |
Top three noisy pixels from each quadrant. If the there are fewer than three noisy pixels in the level2.evt file, extra rows are filled as -1
| Pixel properties | Quadrant properties | ||||||
|---|---|---|---|---|---|---|---|
| Quadrant | DetID | PixID | Counts | Sigma | Mean | Median | Sigma |
| A | 0 | 23 | 297206 | 691.26 | 2090 | 2045 | 427.0 |
| A | 8 | 15 | 187175 | 433.57 | 2090 | 2045 | 427.0 |
| A | 14 | 111 | 77207 | 176.03 | 2090 | 2045 | 427.0 |
| B | 0 | 214 | 298185 | 735.67 | 2106 | 2054 | 402.5 |
| B | 4 | 81 | 58143 | 139.34 | 2106 | 2054 | 402.5 |
| B | 15 | 85 | 52440 | 125.17 | 2106 | 2054 | 402.5 |
| C | 9 | 68 | 2948539 | 6283.93 | 2026 | 2029 | 468.9 |
| C | 12 | 4 | 50471 | 103.31 | 2026 | 2029 | 468.9 |
| C | 13 | 61 | 15644 | 29.04 | 2026 | 2029 | 468.9 |
| D | 2 | 33 | 1100261 | 2240.74 | 2007 | 1945 | 490.2 |
| D | 2 | 216 | 926878 | 1887.01 | 2007 | 1945 | 490.2 |
| D | 13 | 137 | 531642 | 1080.67 | 2007 | 1945 | 490.2 |
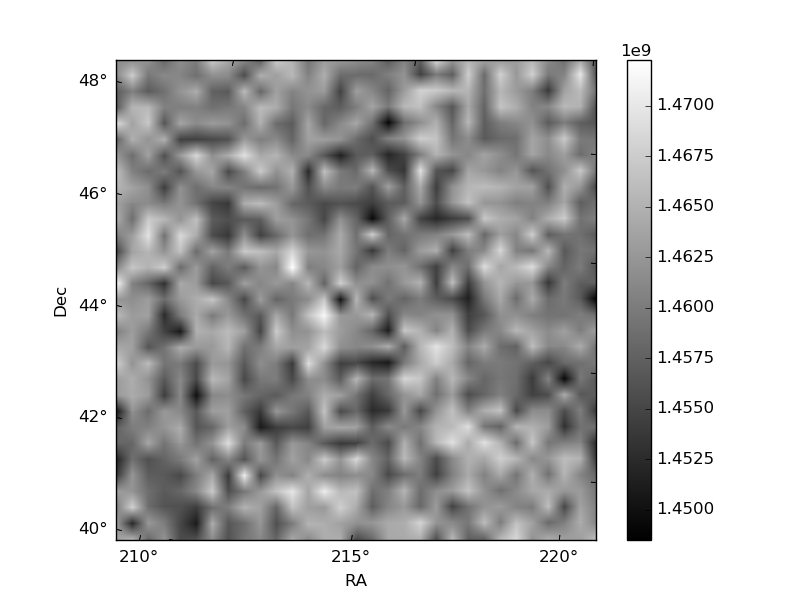
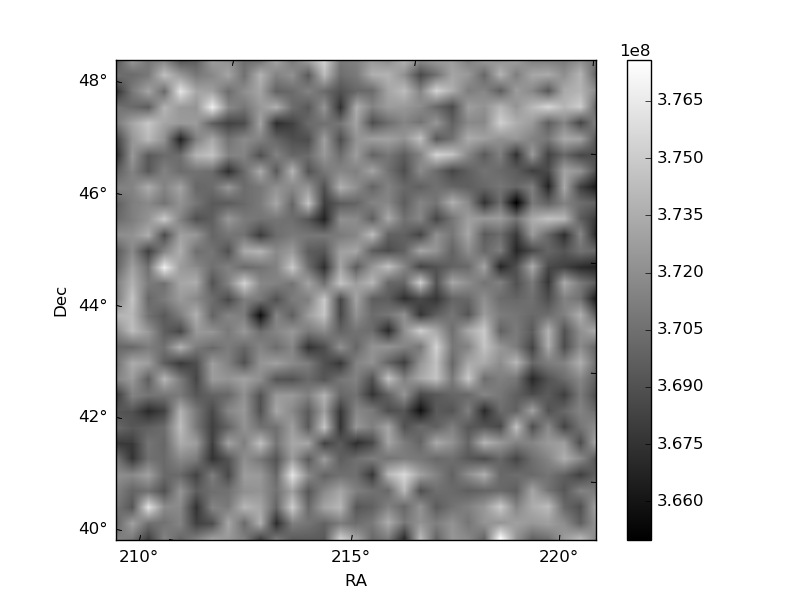
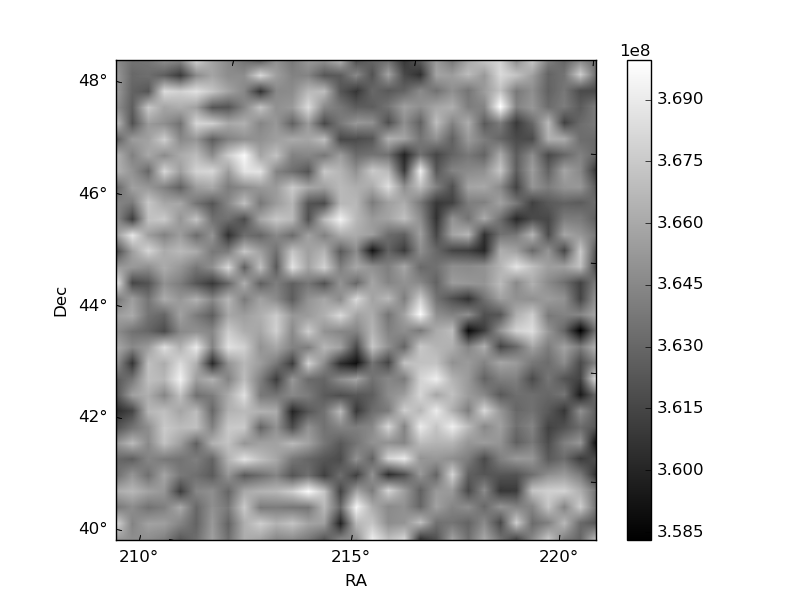
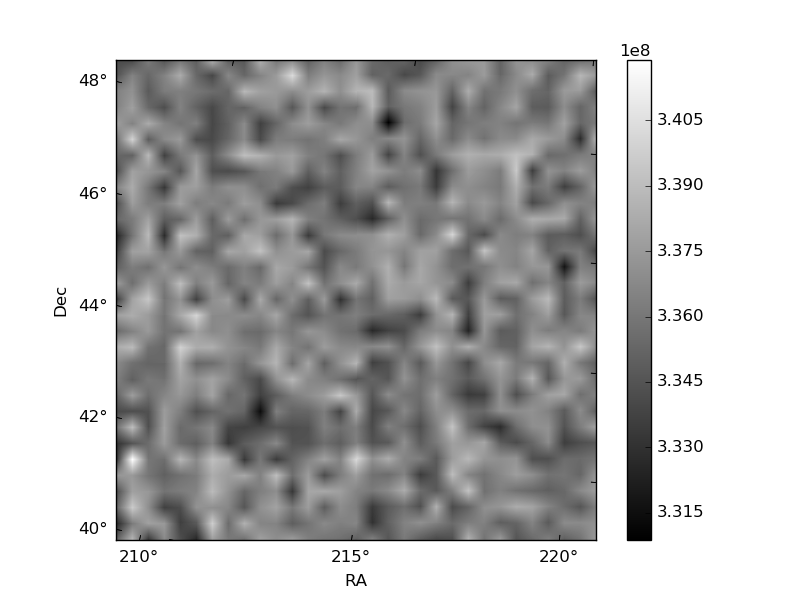
Histogram calculated using DETX and DETY for each event in the final _common_clean file
| Quadrant A | 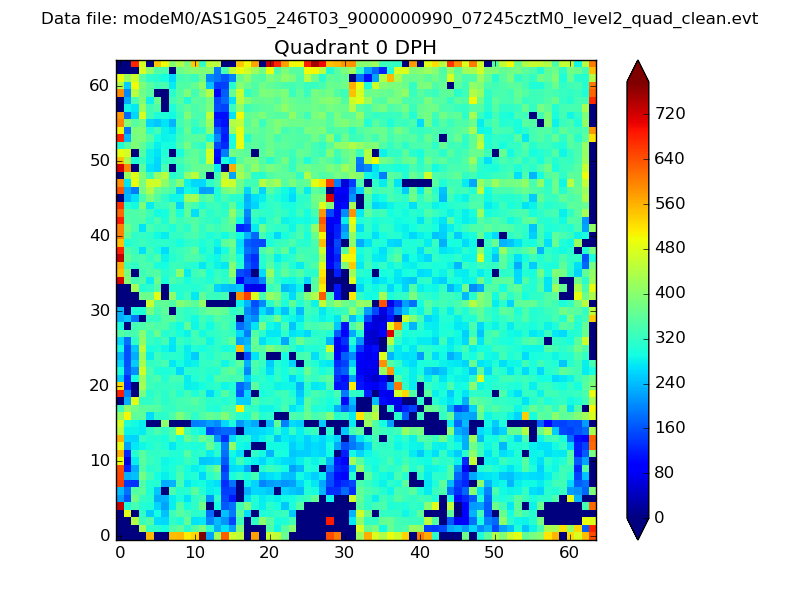 |
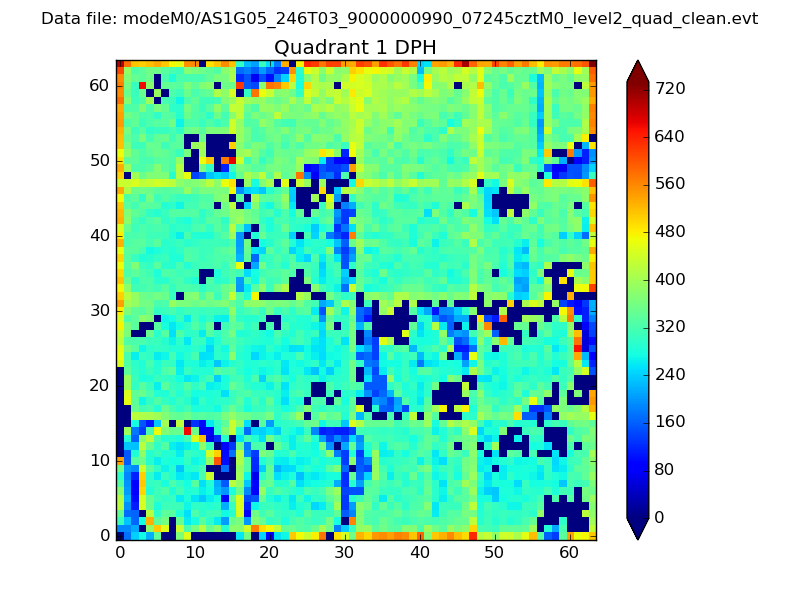 |
Quadrant B |
|---|---|---|---|
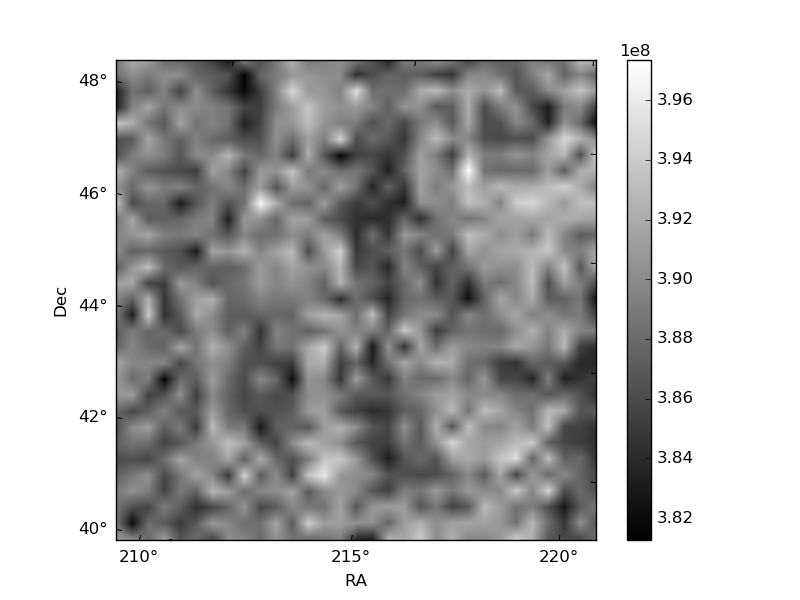
| Quadrant D | 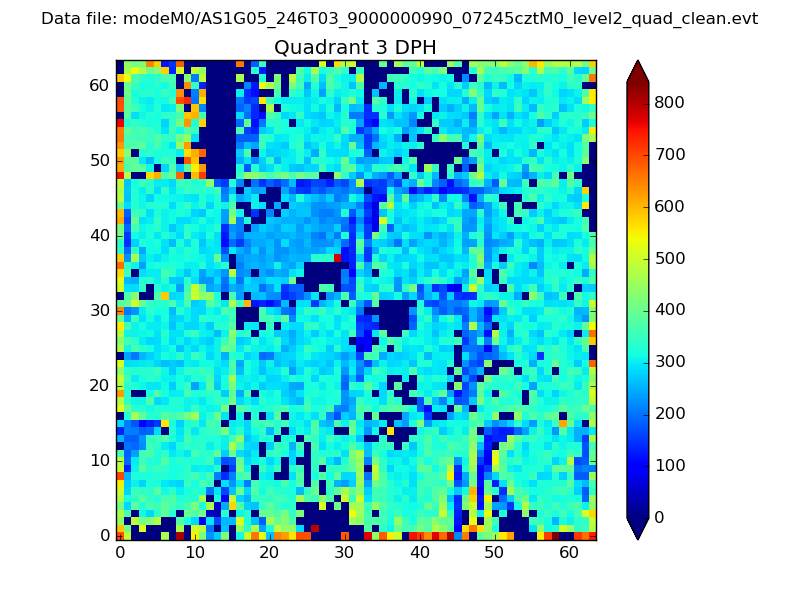 |
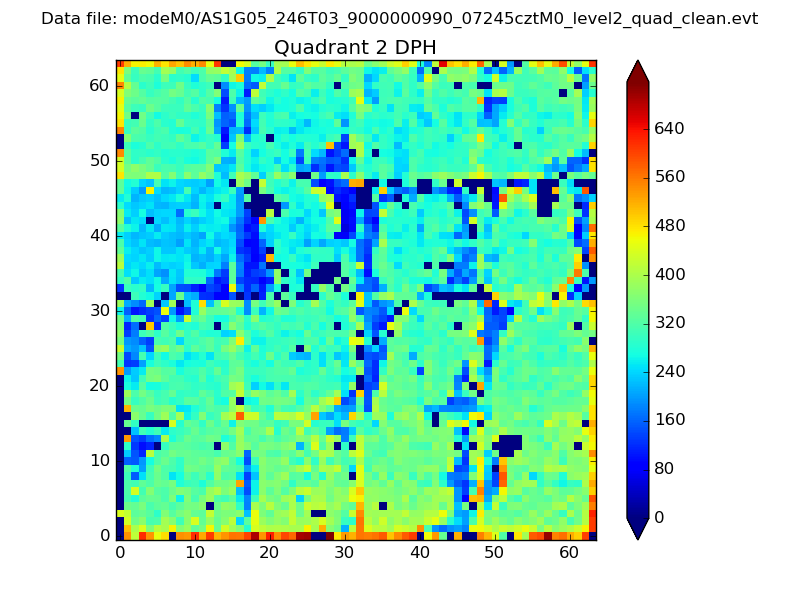 |
Quadrant C |
| Plot type | Count rate plots | Images |
|---|---|---|
| Comparison with Poisson distribution Blue bars denote a histogram of data divided into 1 sec bins. Red curve is a Poisson curve with rate = median count rate of data. |
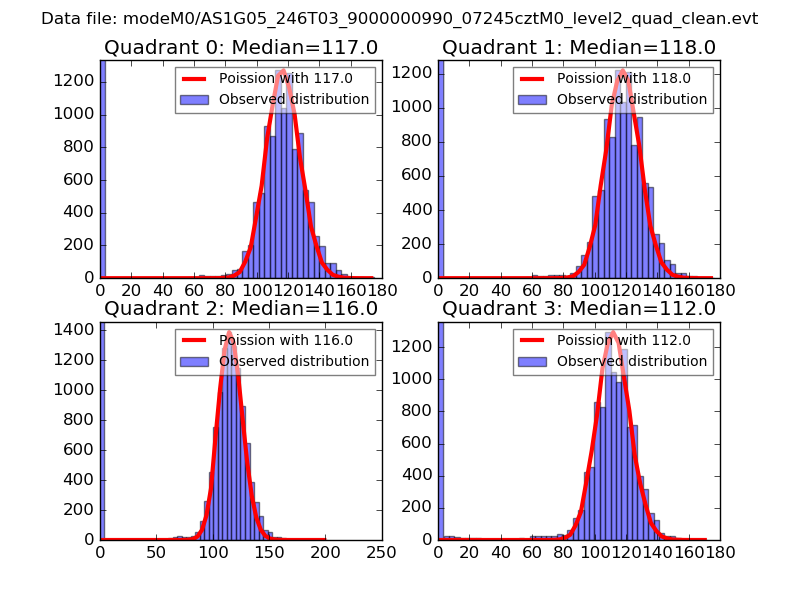 |
 |
| Quadrant-wise count rates Data is divided into 100 sec bins |
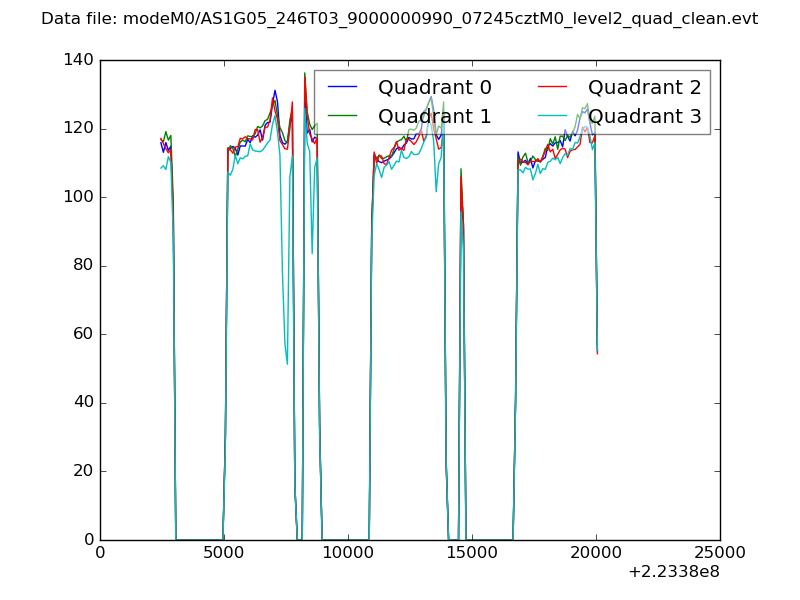 |
|
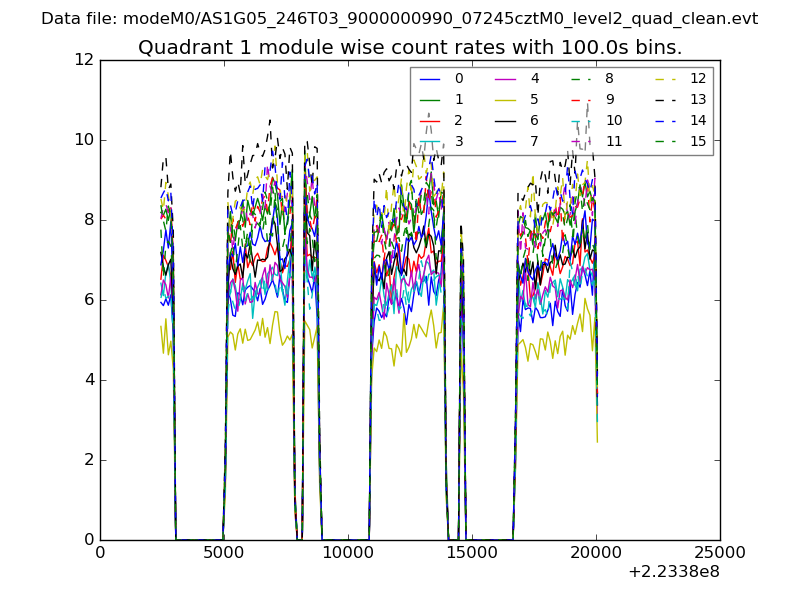
| Module-wise count rates for Quadrant A Data is divided into 100 sec bins |
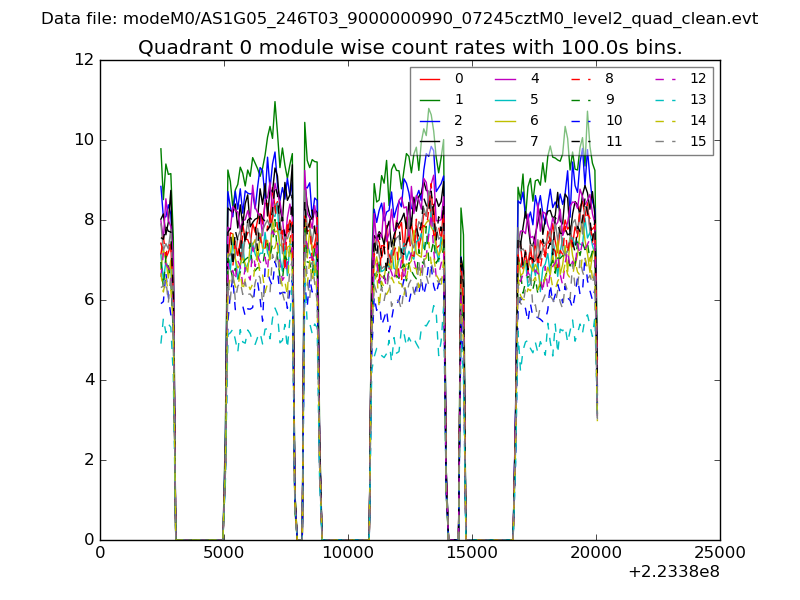 |
 |
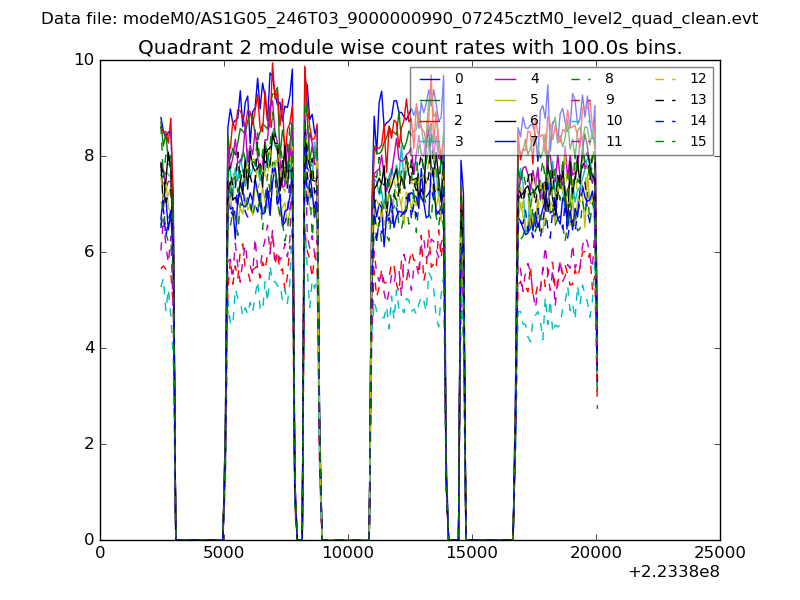
| Module-wise count rates for Quadrant B Data is divided into 100 sec bins |
 |
 |
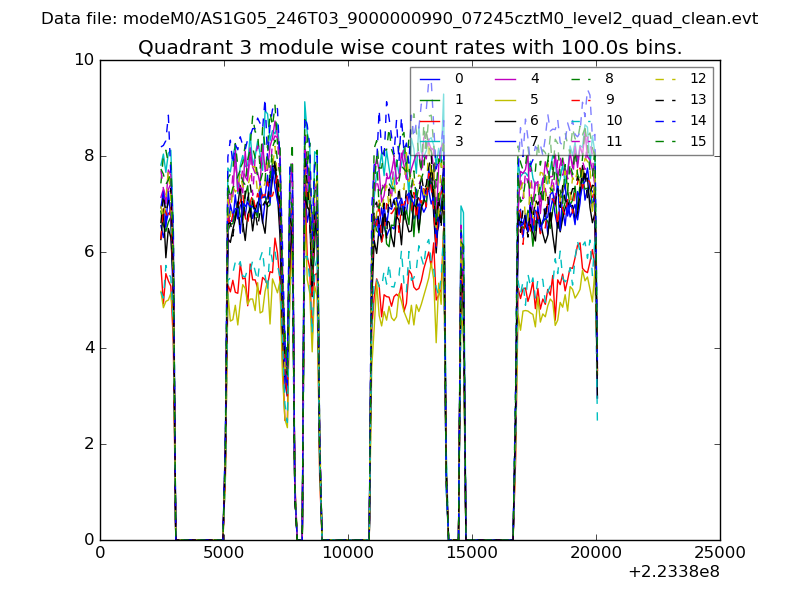
| Module-wise count rates for Quadrant C Data is divided into 100 sec bins |
 |
 |
| Module-wise count rates for Quadrant D Data is divided into 100 sec bins |
 |
 |
| Parameter | Plot |
|---|---|
| CZT HV Monitor | 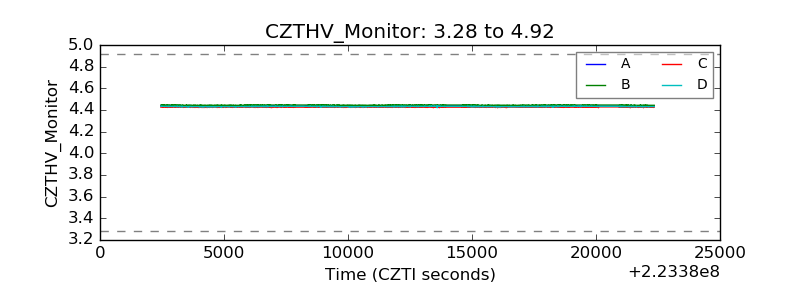 |
| D_VDD | 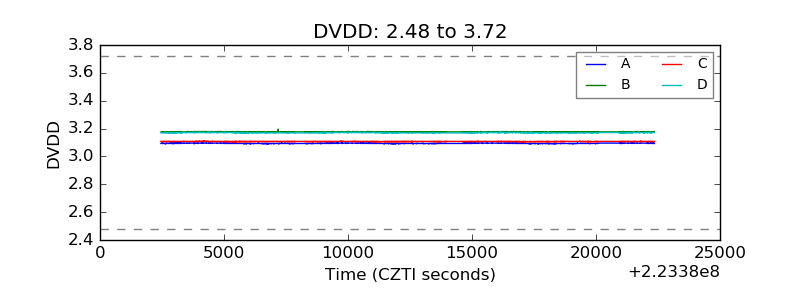 |
| Temperature 1 | 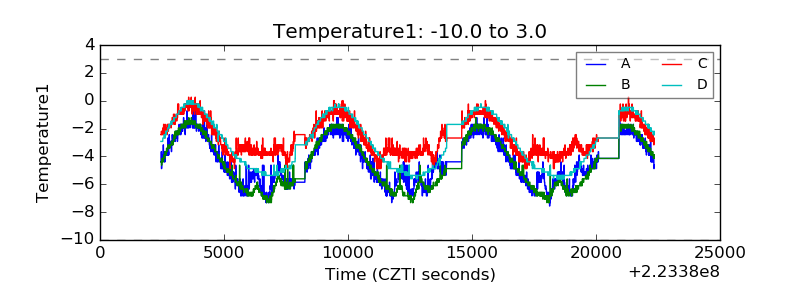 |
| Veto HV Monitor | 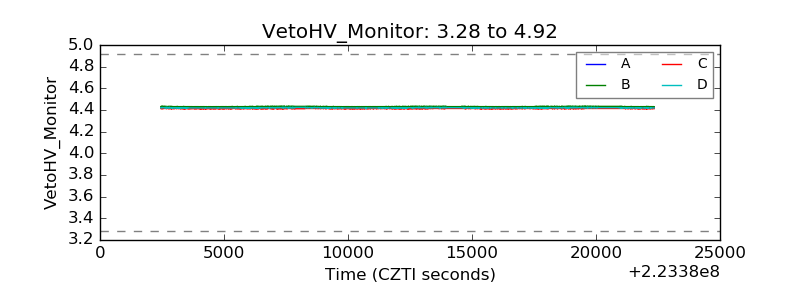 |
| Veto LLD | 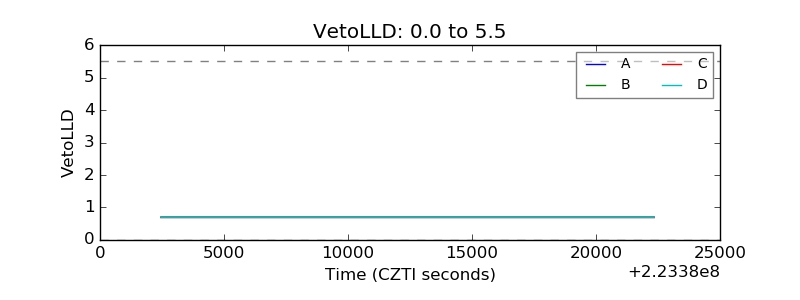 |
| Alpha Counter | 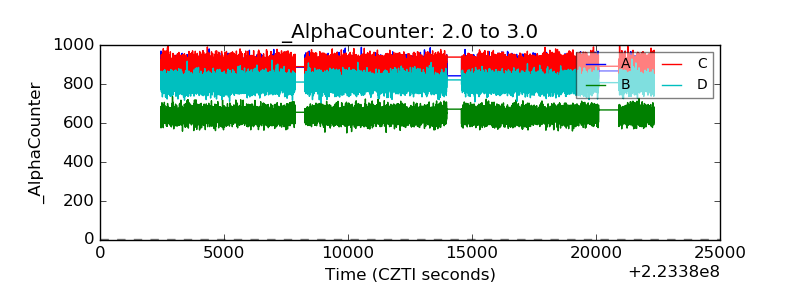 |
| _CPM_Rate | 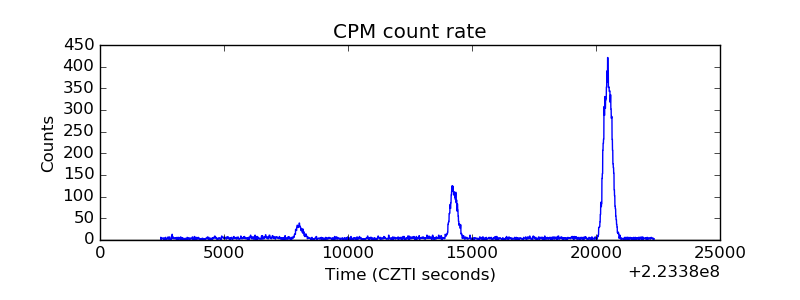 |
| CZT Counter | 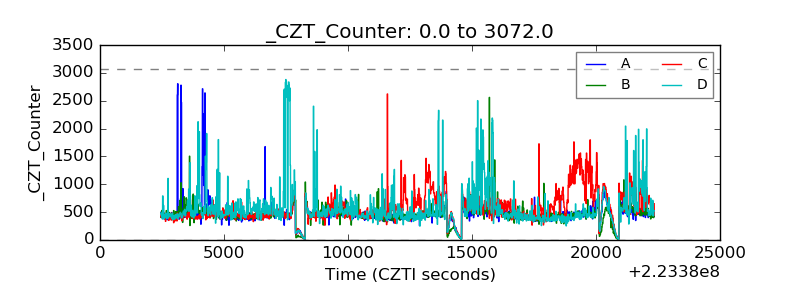 |
| +2.5 Volts monitor |  |
| +5 Volts monitor |  |
| _ROLL_ROT | 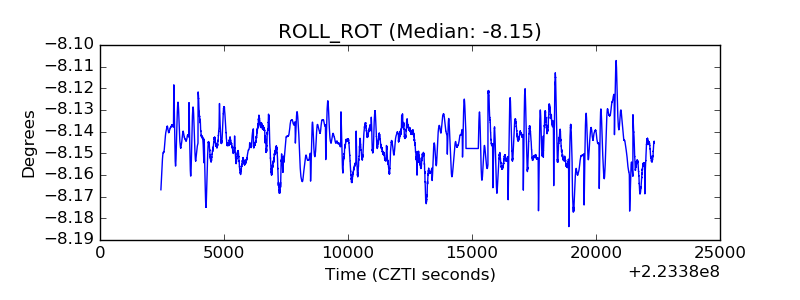 |
| _Roll_DEC | 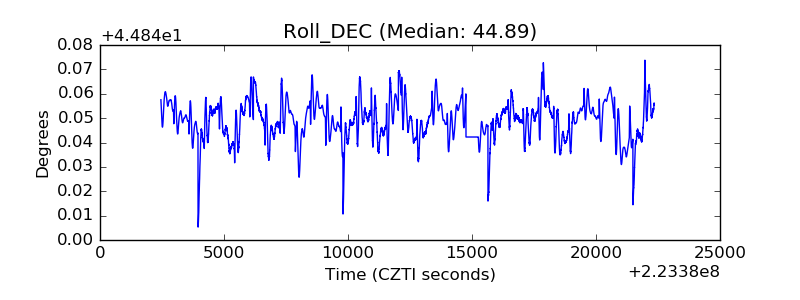 |
| _Roll_RA | 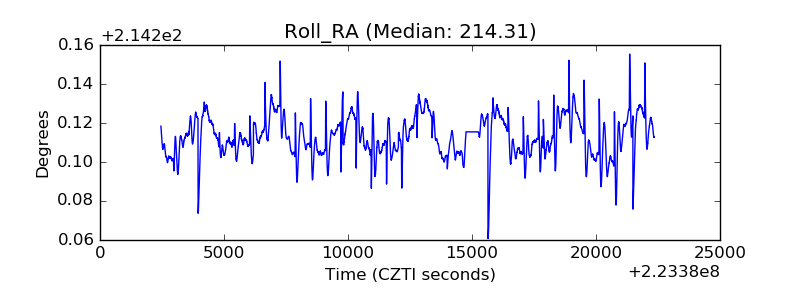 |
| Veto Counter | 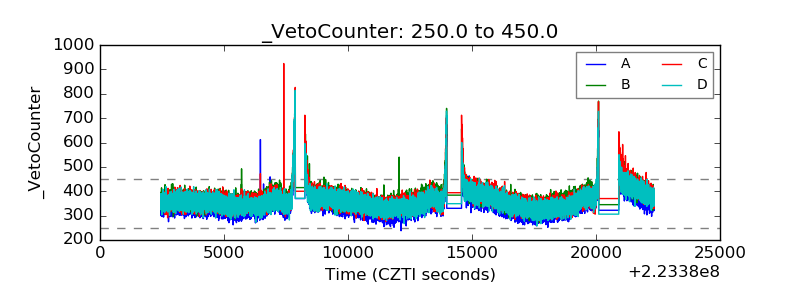 |