| Param | Original file | Final file |
|---|---|---|
| Filename | modeM0/AS1G05_246T03_9000000990_07246cztM0_level2.evt | modeM0/AS1G05_246T03_9000000990_07246cztM0_level2_quad_clean.evt |
| Size (bytes) | 520,542,720 | 70,580,160 |
| Size | 496.4 MB | 67.3 MB |
| Events in quadrant A | 3,146,084 | 421,855 |
| Events in quadrant B | 3,383,530 | 424,829 |
| Events in quadrant C | 4,884,977 | 416,218 |
| Events in quadrant D | 3,895,991 | 407,211 |
| Mode M0 | |||
|---|---|---|---|
| Quadrant | BADHDUFLAG | Total packets | Discarded packets |
| A | 0 | 13818 | 3 |
| B | 0 | 14603 | 2 |
| C | 0 | 19397 | 2 |
| D | 0 | 16394 | 2 |
| Mode M9 | |||
|---|---|---|---|
| Quadrant | BADHDUFLAG | Total packets | Discarded packets |
| A | 0 | 15 | 0 |
| B | 0 | 15 | 0 |
| C | 0 | 15 | 0 |
| D | 0 | 16 | 0 |
| Mode SS | |||
|---|---|---|---|
| Quadrant | BADHDUFLAG | Total packets | Discarded packets |
| A | 0 | 136 | 0 |
| B | 0 | 136 | 0 |
| C | 0 | 136 | 0 |
| D | 0 | 136 | 0 |
| Quadrant | Total seconds | Saturated seconds | Saturation percentage |
|---|---|---|---|
| A | 6698 | 39 | 0.582263% |
| B | 6698 | 83 | 1.239176% |
| C | 6698 | 57 | 0.851000% |
| D | 6698 | 184 | 2.747089% |
Noise dominated data is calculated using 1-second bins in cleaned event files. If a bin has >2000 counts, and if more than 50% of those come from <1% of pixels, then it is considered to be noise-dominated and hence unusable.
| Quadrant | # 1 sec bins | Bins with >0 counts | Bins with >2000 counts | High rate bins dominated by noise | Noise dominated (total time) | Noise dominated (detector-on time) | Marked lightcurve |
|---|---|---|---|---|---|---|---|
| A | 7664 | 6699 | 0 | 0 | 0.00% | 0.00% | 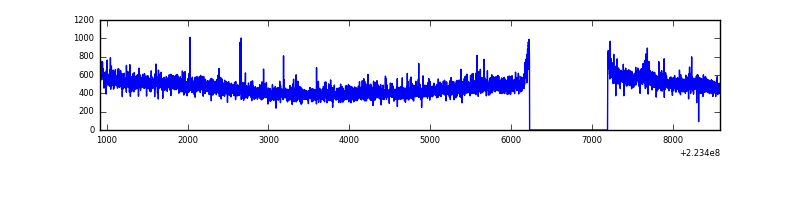 |
| B | 7664 | 6699 | 24 | 24 | 0.31% | 0.36% | 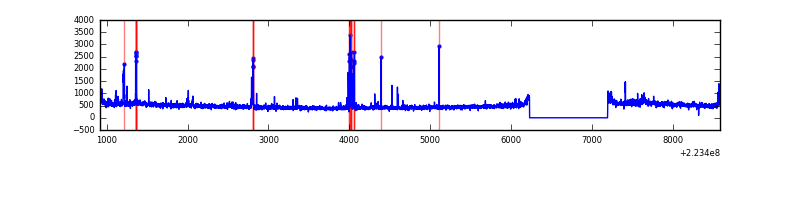 |
| C | 7664 | 6699 | 1 | 1 | 0.01% | 0.01% | 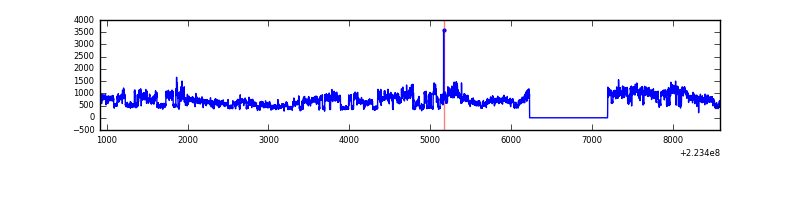 |
| D | 7664 | 6699 | 92 | 92 | 1.20% | 1.37% | 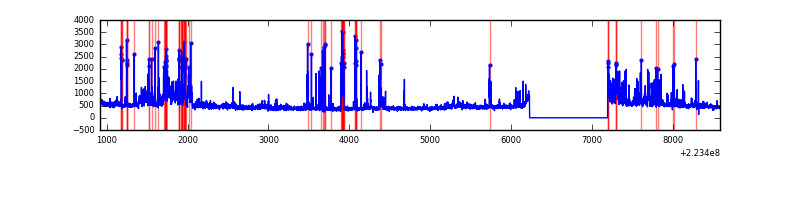 |
Top three noisy pixels from each quadrant. If the there are fewer than three noisy pixels in the level2.evt file, extra rows are filled as -1
| Pixel properties | Quadrant properties | ||||||
|---|---|---|---|---|---|---|---|
| Quadrant | DetID | PixID | Counts | Sigma | Mean | Median | Sigma |
| A | 8 | 15 | 66406 | 400.98 | 797 | 780 | 163.7 |
| A | 0 | 226 | 7797 | 42.87 | 797 | 780 | 163.7 |
| A | 12 | 194 | 6946 | 37.67 | 797 | 780 | 163.7 |
| B | 10 | 245 | 69160 | 442.21 | 799 | 777 | 154.6 |
| B | 15 | 85 | 53170 | 338.81 | 799 | 777 | 154.6 |
| B | 0 | 214 | 51178 | 325.93 | 799 | 777 | 154.6 |
| C | 9 | 68 | 1864600 | 10325.84 | 773 | 775 | 180.5 |
| C | 13 | 61 | 5957 | 28.71 | 773 | 775 | 180.5 |
| C | 10 | 22 | 2722 | 10.79 | 773 | 775 | 180.5 |
| D | 2 | 33 | 268584 | 1389.33 | 774 | 749 | 192.8 |
| D | 2 | 14 | 220290 | 1138.81 | 774 | 749 | 192.8 |
| D | 2 | 216 | 201945 | 1043.65 | 774 | 749 | 192.8 |
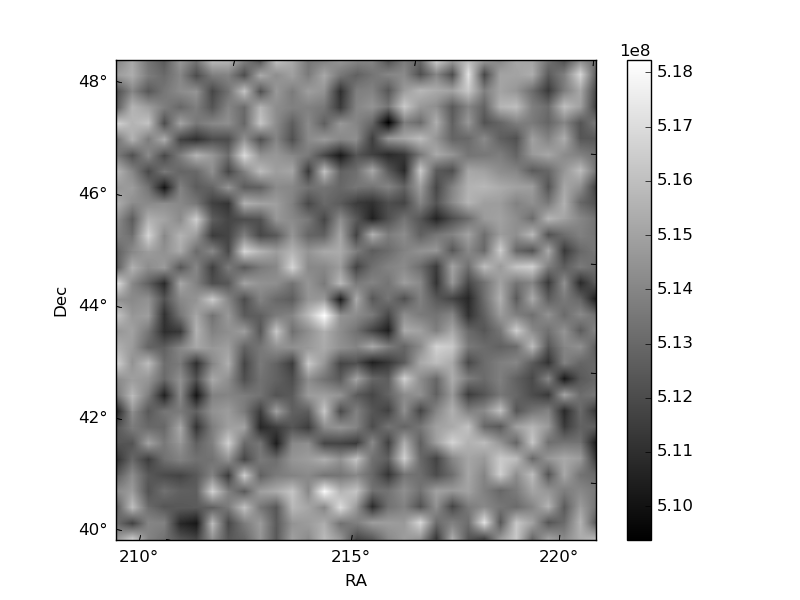
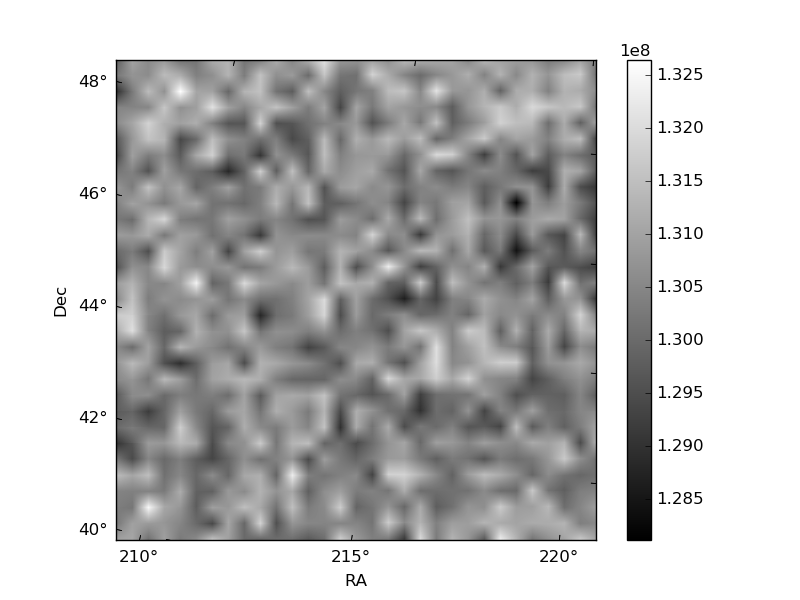
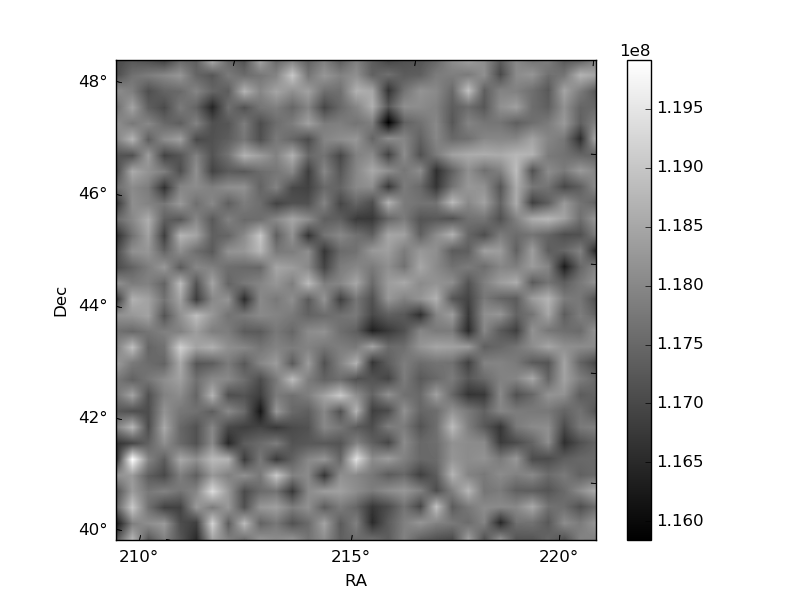
Histogram calculated using DETX and DETY for each event in the final _common_clean file
| Quadrant A | 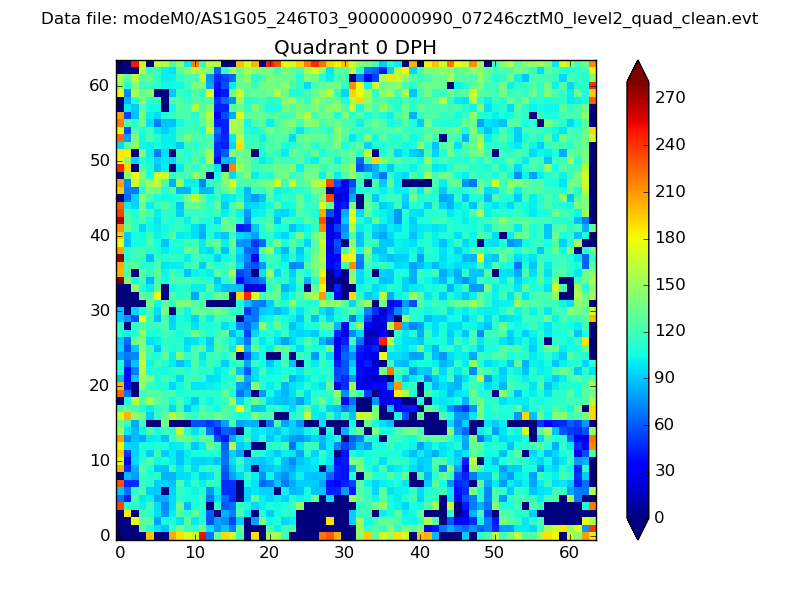 |
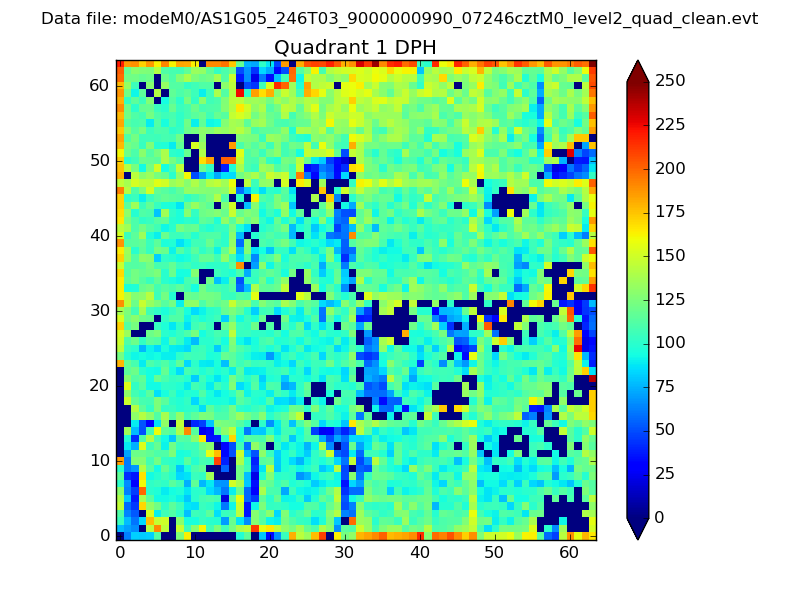 |
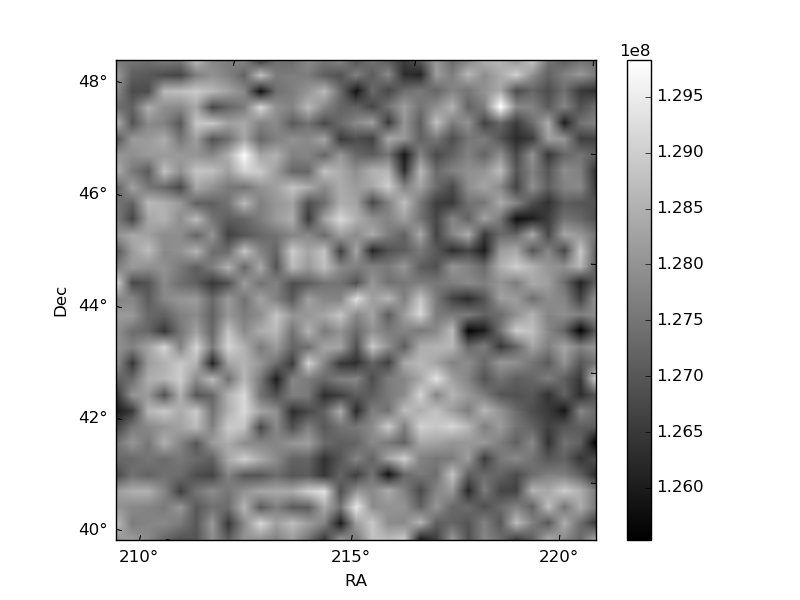
Quadrant B |
|---|---|---|---|
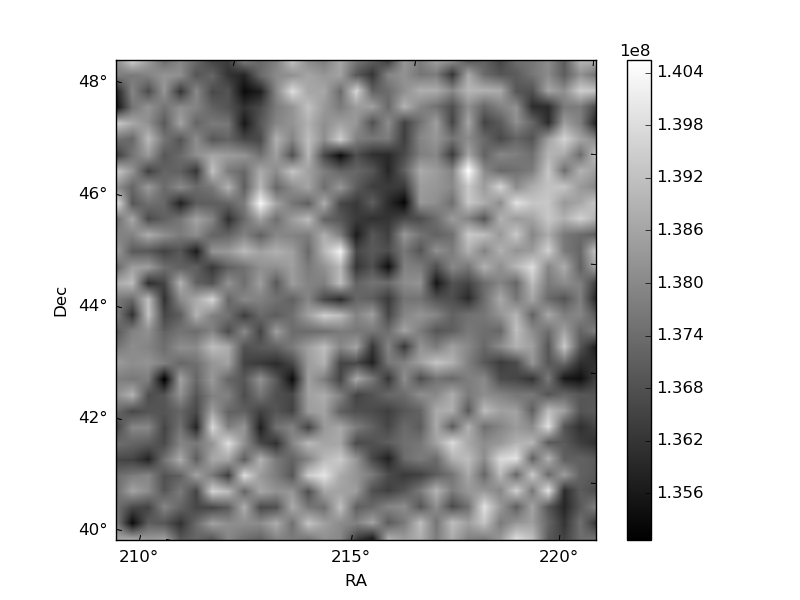
| Quadrant D | 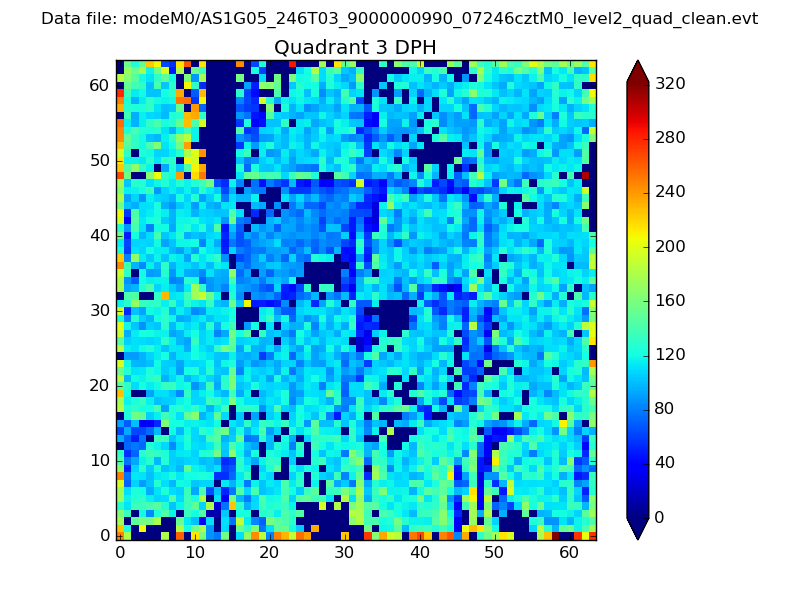 |
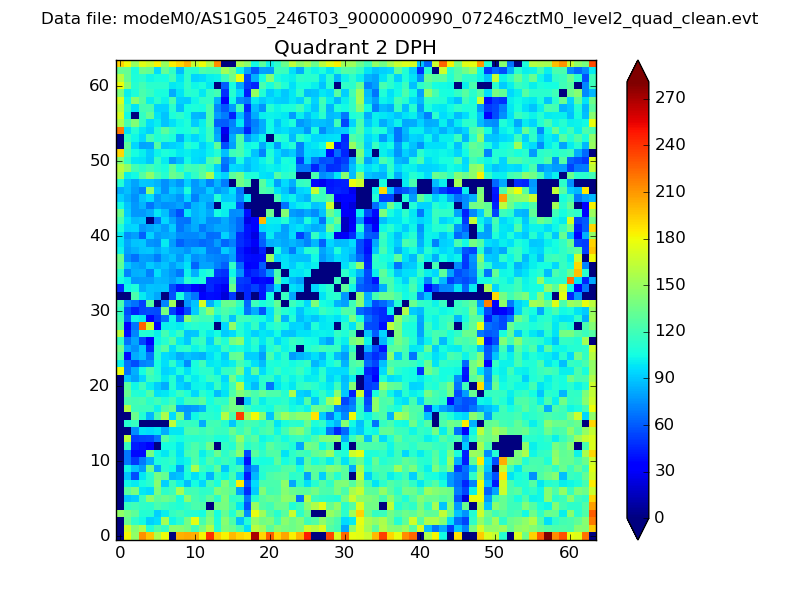 |
Quadrant C |
| Plot type | Count rate plots | Images |
|---|---|---|
| Comparison with Poisson distribution Blue bars denote a histogram of data divided into 1 sec bins. Red curve is a Poisson curve with rate = median count rate of data. |
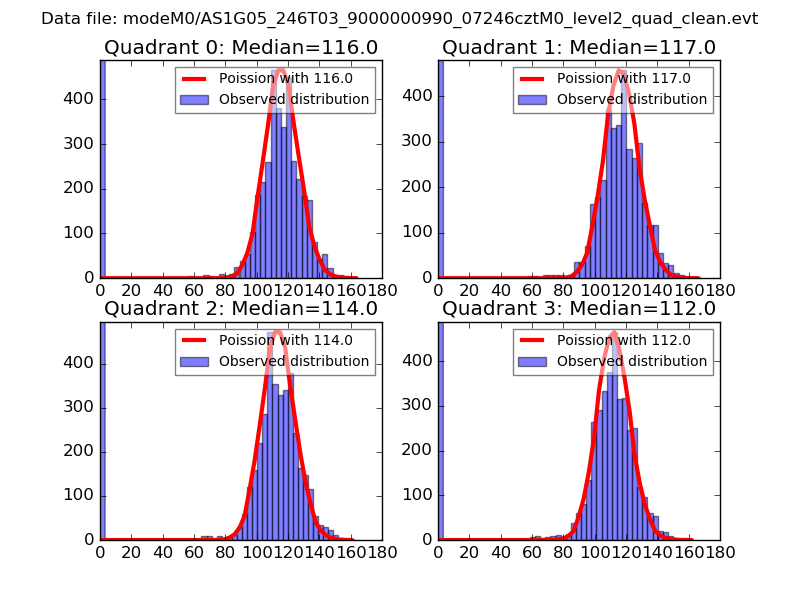 |
 |
| Quadrant-wise count rates Data is divided into 100 sec bins |
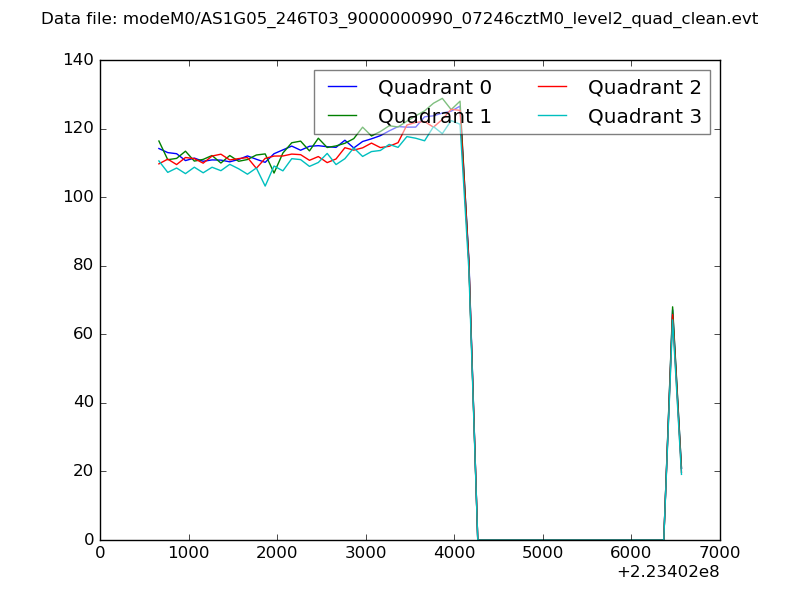 |
|
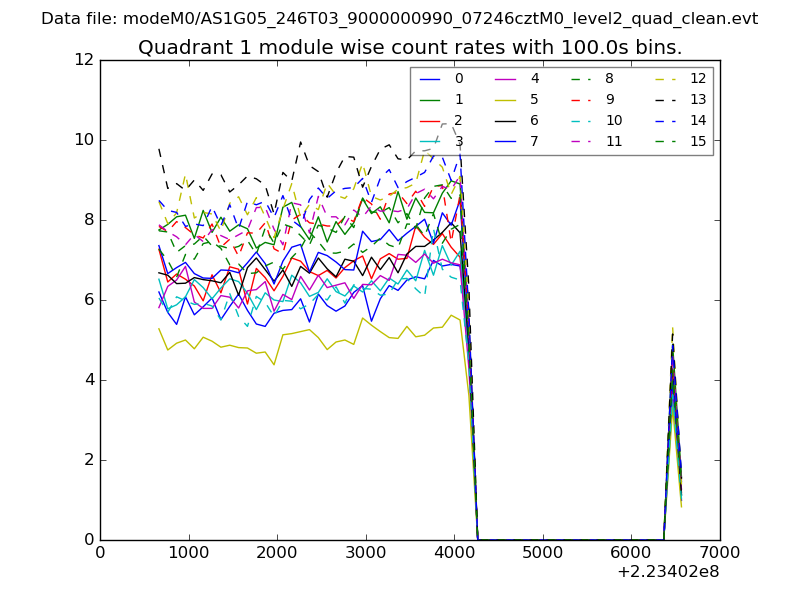
| Module-wise count rates for Quadrant A Data is divided into 100 sec bins |
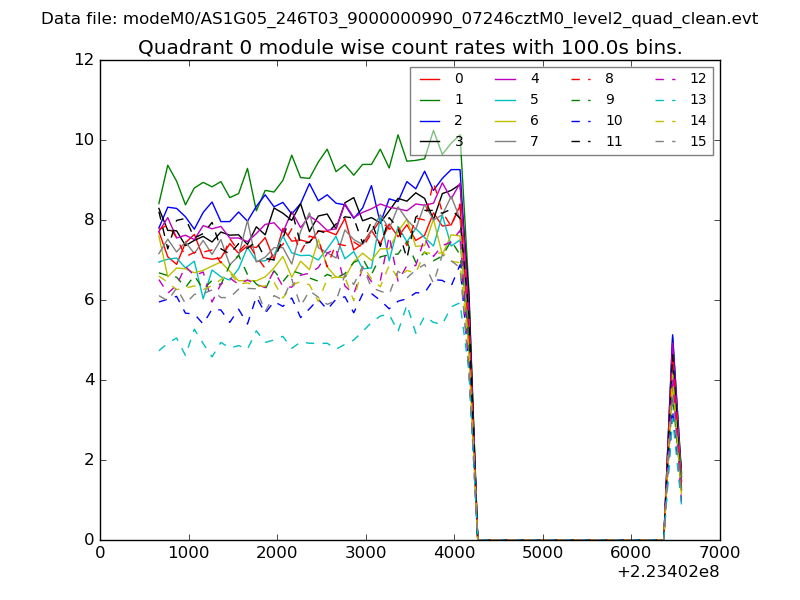 |
 |
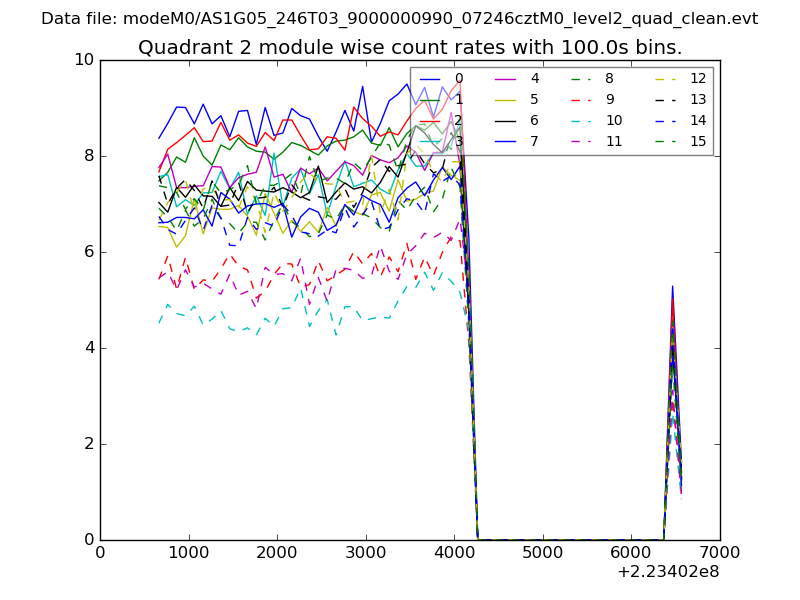
| Module-wise count rates for Quadrant B Data is divided into 100 sec bins |
 |
 |
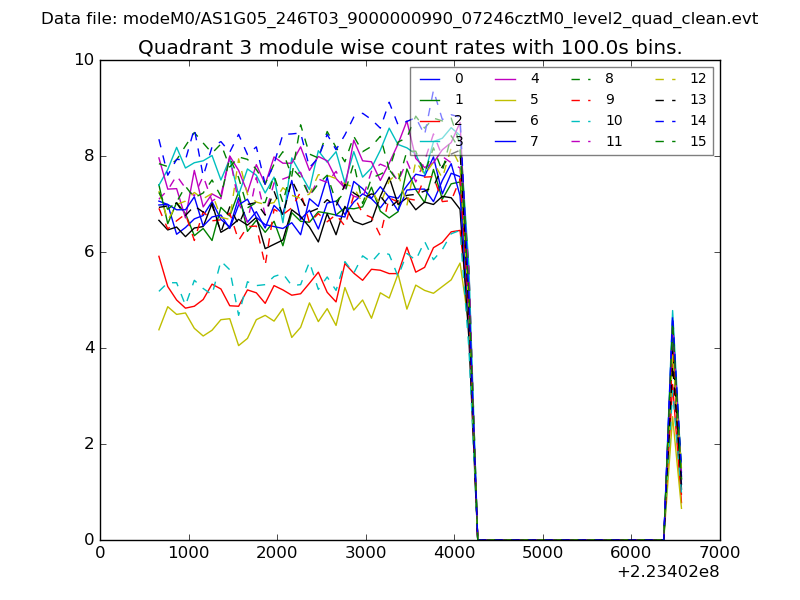
| Module-wise count rates for Quadrant C Data is divided into 100 sec bins |
 |
 |
| Module-wise count rates for Quadrant D Data is divided into 100 sec bins |
 |
 |
| Parameter | Plot |
|---|---|
| CZT HV Monitor | 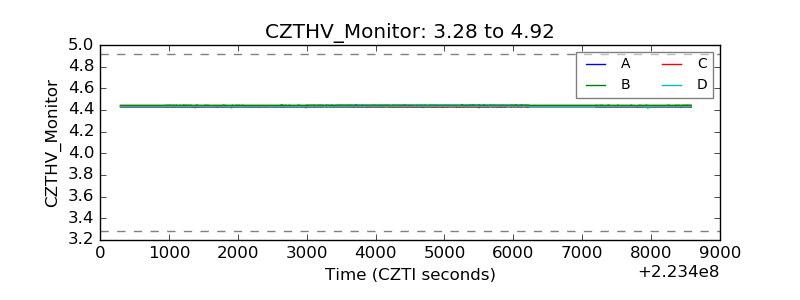 |
| D_VDD | 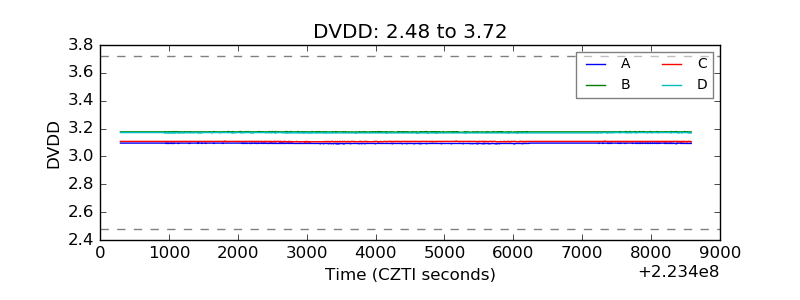 |
| Temperature 1 | 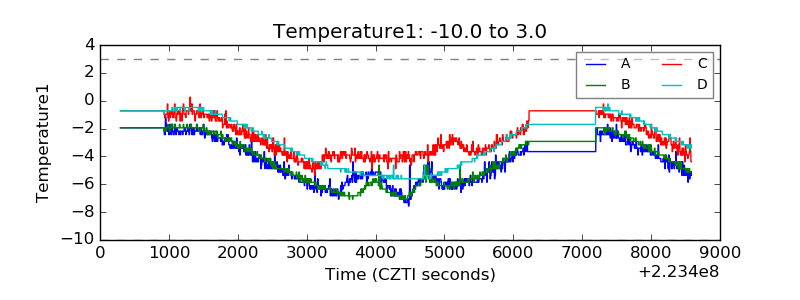 |
| Veto HV Monitor | 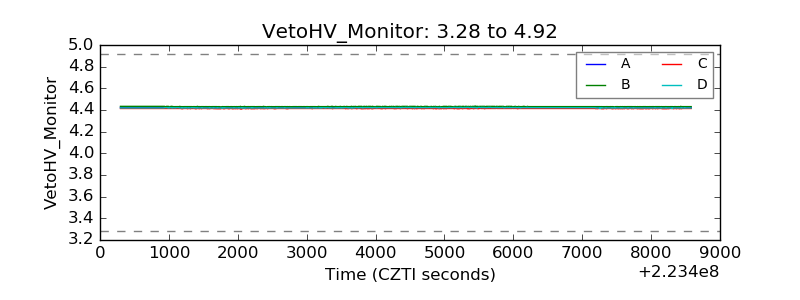 |
| Veto LLD | 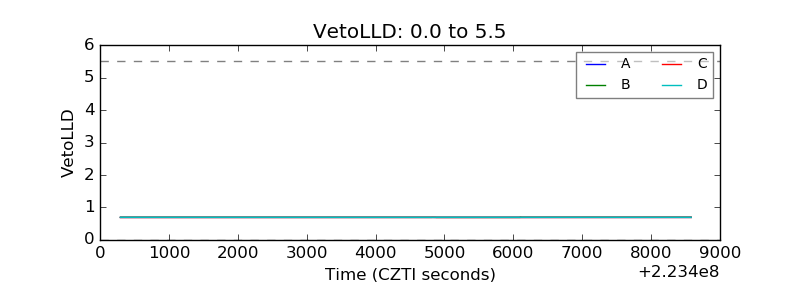 |
| Alpha Counter | 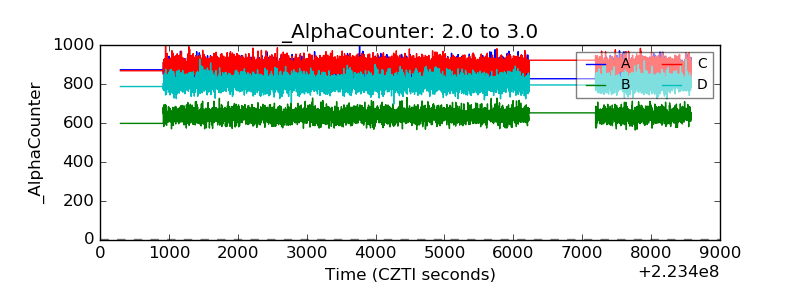 |
| _CPM_Rate | 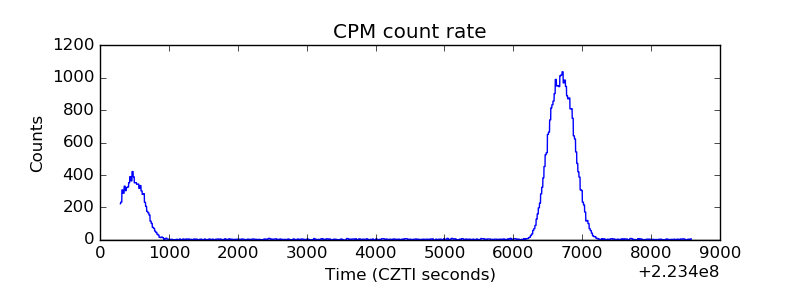 |
| CZT Counter | 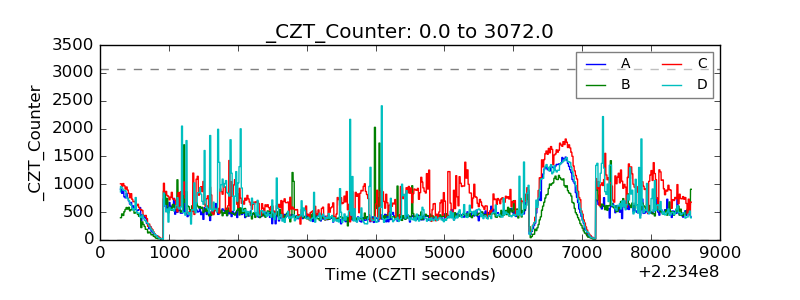 |
| +2.5 Volts monitor |  |
| +5 Volts monitor |  |
| _ROLL_ROT | 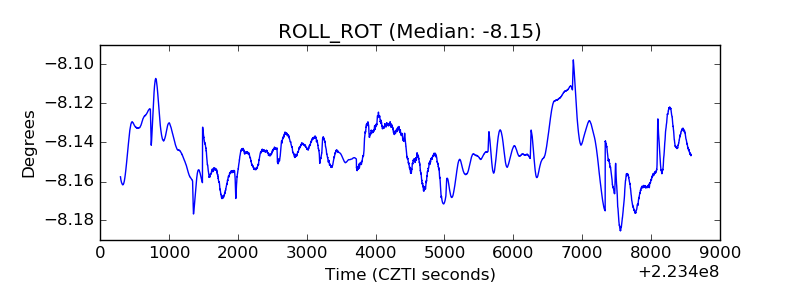 |
| _Roll_DEC | 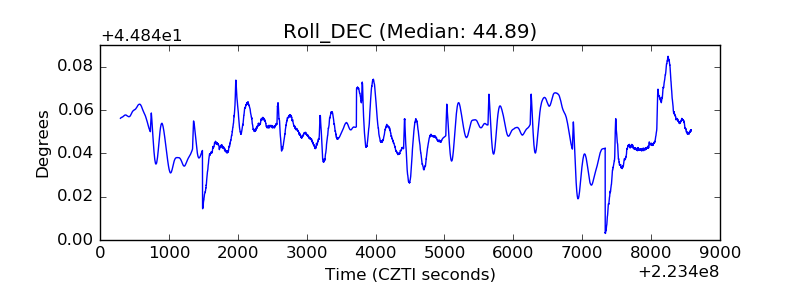 |
| _Roll_RA | 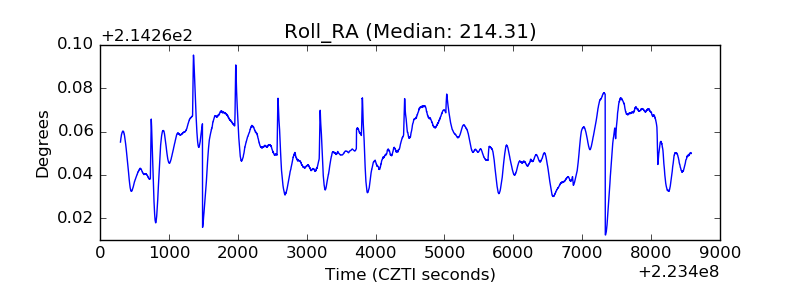 |
| Veto Counter | 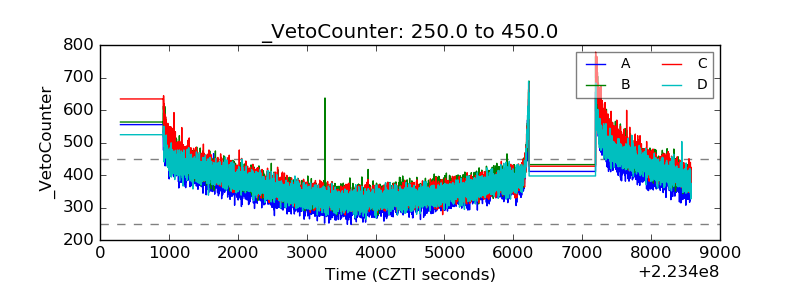 |