| Param | Original file | Final file |
|---|---|---|
| Filename | modeM0/AS1G05_246T03_9000000990_07250cztM0_level2.evt | modeM0/AS1G05_246T03_9000000990_07250cztM0_level2_quad_clean.evt |
| Size (bytes) | 443,324,160 | 99,198,720 |
| Size | 422.8 MB | 94.6 MB |
| Events in quadrant A | 3,178,537 | 639,633 |
| Events in quadrant B | 3,128,887 | 664,260 |
| Events in quadrant C | 2,957,063 | 656,001 |
| Events in quadrant D | 3,744,871 | 616,094 |
| Mode M0 | |||
|---|---|---|---|
| Quadrant | BADHDUFLAG | Total packets | Discarded packets |
| A | 0 | 13437 | 3 |
| B | 0 | 13525 | 2 |
| C | 0 | 12976 | 2 |
| D | 0 | 15552 | 2 |
| Mode M9 | |||
|---|---|---|---|
| Quadrant | BADHDUFLAG | Total packets | Discarded packets |
| A | 0 | 21 | 0 |
| B | 0 | 21 | 0 |
| C | 0 | 21 | 0 |
| D | 0 | 22 | 0 |
| Mode SS | |||
|---|---|---|---|
| Quadrant | BADHDUFLAG | Total packets | Discarded packets |
| A | 0 | 124 | 0 |
| B | 0 | 124 | 0 |
| C | 0 | 124 | 0 |
| D | 0 | 124 | 0 |
| Quadrant | Total seconds | Saturated seconds | Saturation percentage |
|---|---|---|---|
| A | 6136 | 78 | 1.271186% |
| B | 6136 | 59 | 0.961538% |
| C | 6136 | 29 | 0.472621% |
| D | 6136 | 178 | 2.900913% |
Noise dominated data is calculated using 1-second bins in cleaned event files. If a bin has >2000 counts, and if more than 50% of those come from <1% of pixels, then it is considered to be noise-dominated and hence unusable.
| Quadrant | # 1 sec bins | Bins with >0 counts | Bins with >2000 counts | High rate bins dominated by noise | Noise dominated (total time) | Noise dominated (detector-on time) | Marked lightcurve |
|---|---|---|---|---|---|---|---|
| A | 7451 | 6137 | 9 | 9 | 0.12% | 0.15% | 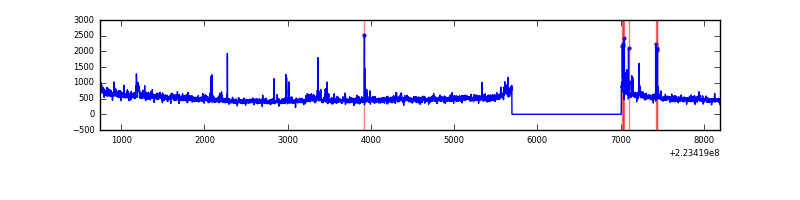 |
| B | 7451 | 6136 | 2 | 2 | 0.03% | 0.03% | 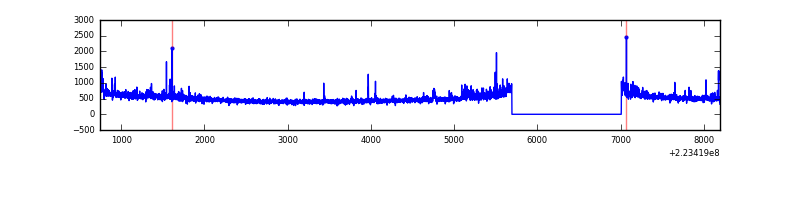 |
| C | 7451 | 6137 | 1 | 1 | 0.01% | 0.02% | 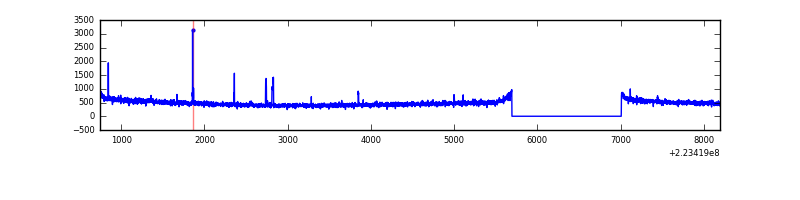 |
| D | 7451 | 6136 | 75 | 75 | 1.01% | 1.22% | 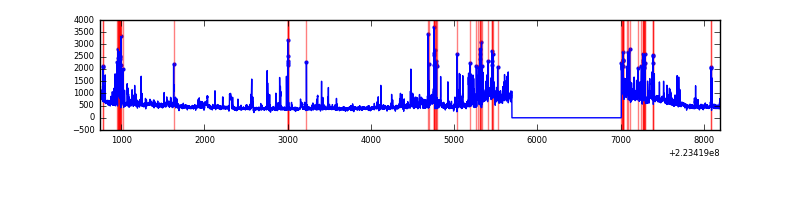 |
Top three noisy pixels from each quadrant. If the there are fewer than three noisy pixels in the level2.evt file, extra rows are filled as -1
| Pixel properties | Quadrant properties | ||||||
|---|---|---|---|---|---|---|---|
| Quadrant | DetID | PixID | Counts | Sigma | Mean | Median | Sigma |
| A | 14 | 111 | 197101 | 1292.93 | 750 | 734 | 151.9 |
| A | 8 | 15 | 89784 | 586.33 | 750 | 734 | 151.9 |
| A | 0 | 226 | 7582 | 45.09 | 750 | 734 | 151.9 |
| B | 0 | 214 | 94218 | 644.23 | 766 | 750 | 145.1 |
| B | 4 | 81 | 21102 | 140.28 | 766 | 750 | 145.1 |
| B | 0 | 219 | 17659 | 116.55 | 766 | 750 | 145.1 |
| C | 9 | 243 | 40365 | 231.49 | 743 | 748 | 171.1 |
| C | 12 | 4 | 10242 | 55.47 | 743 | 748 | 171.1 |
| C | 9 | 68 | 6298 | 32.43 | 743 | 748 | 171.1 |
| D | 2 | 216 | 345553 | 1967.8 | 727 | 706 | 175.2 |
| D | 13 | 169 | 224285 | 1275.81 | 727 | 706 | 175.2 |
| D | 2 | 14 | 150063 | 852.28 | 727 | 706 | 175.2 |
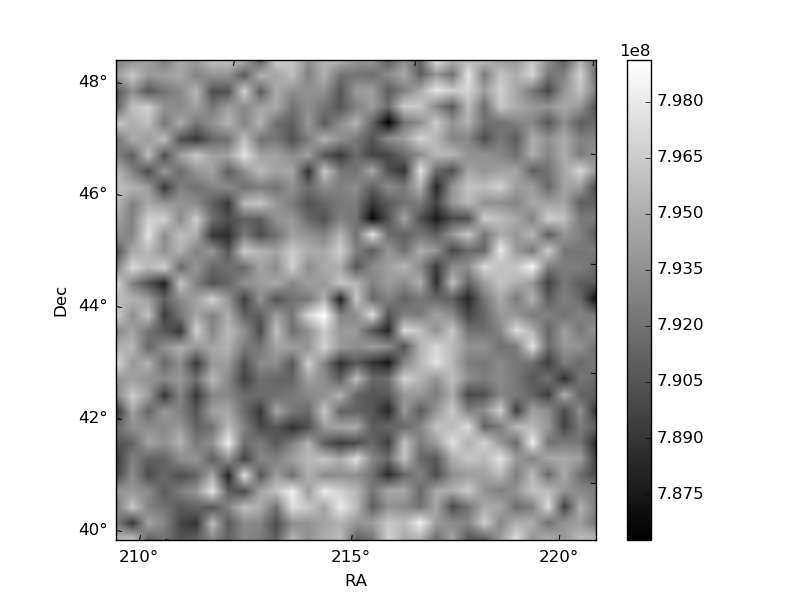
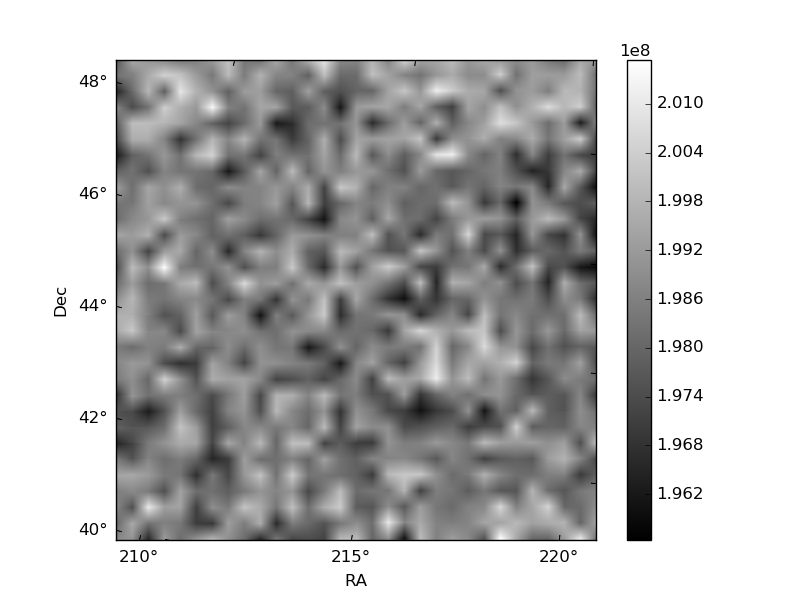
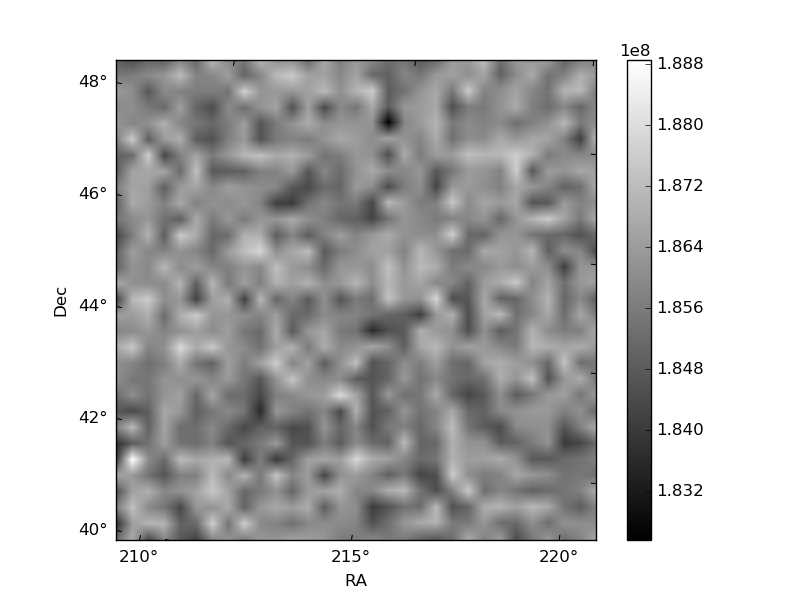
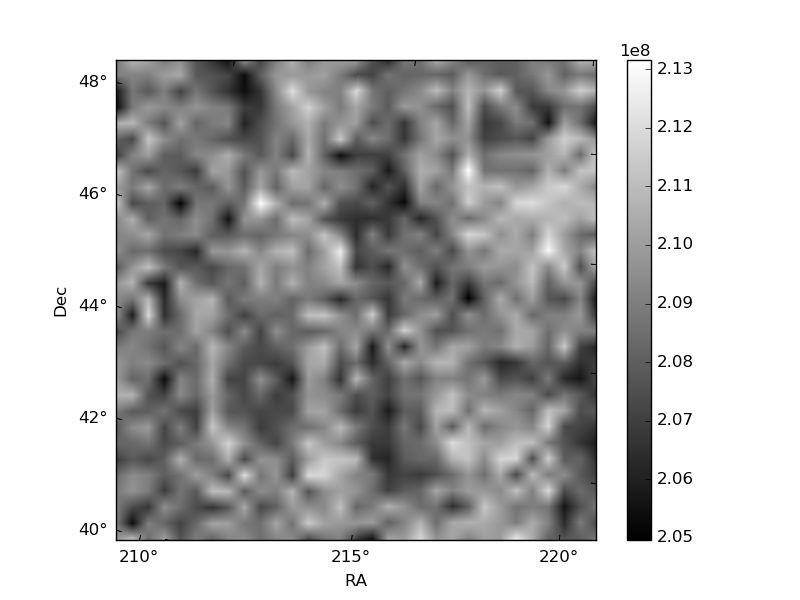
Histogram calculated using DETX and DETY for each event in the final _common_clean file
| Quadrant A | 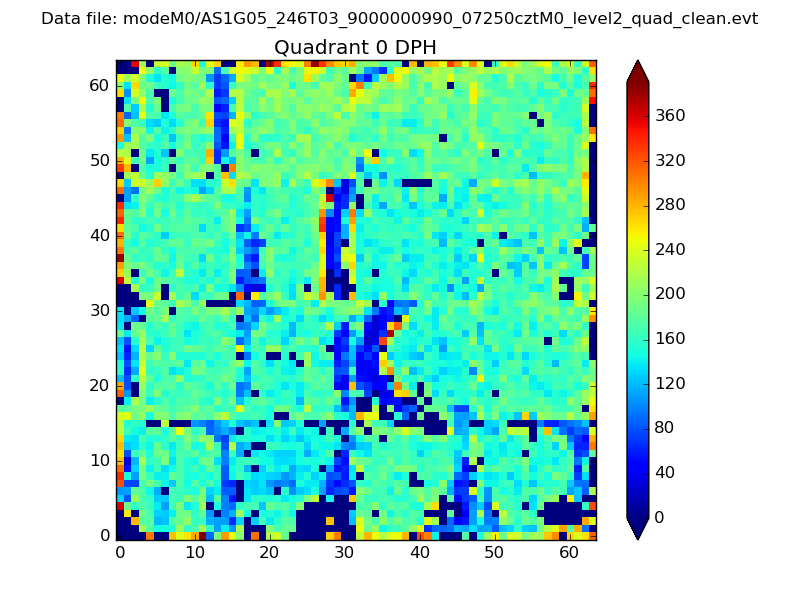 |
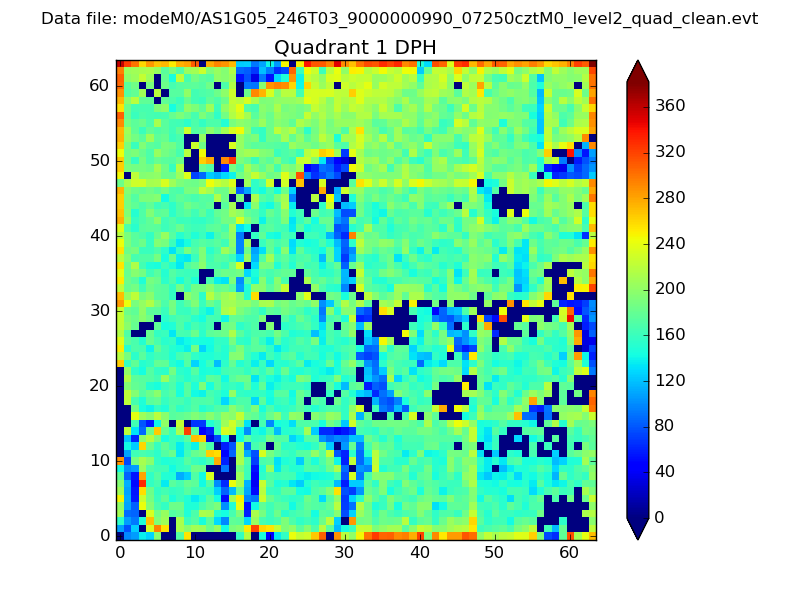 |
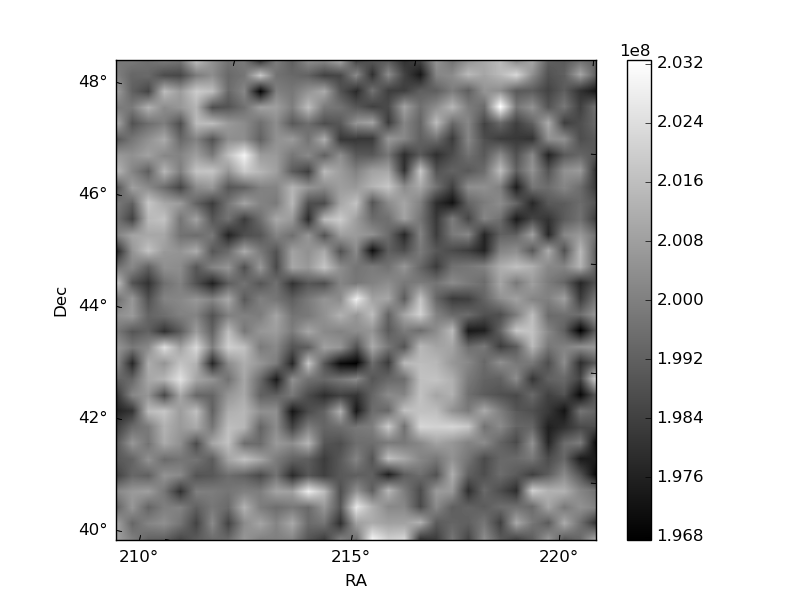
Quadrant B |
|---|---|---|---|
| Quadrant D | 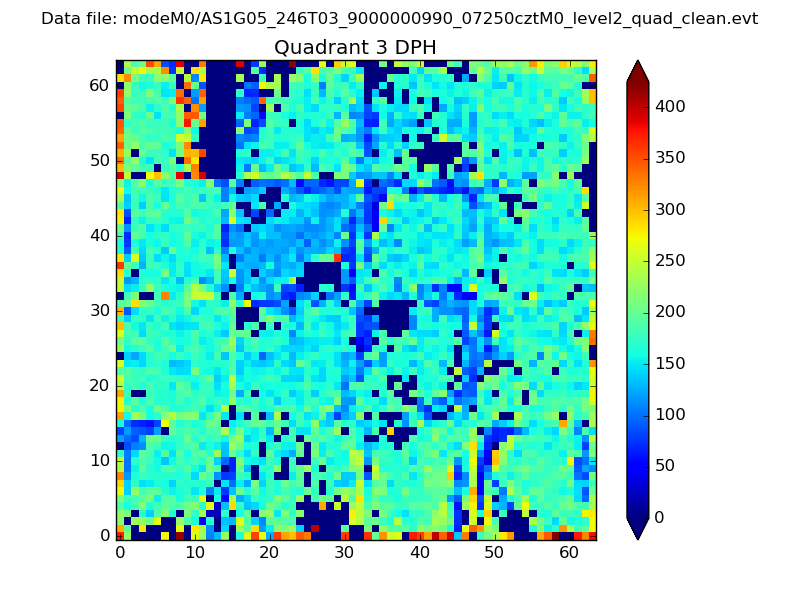 |
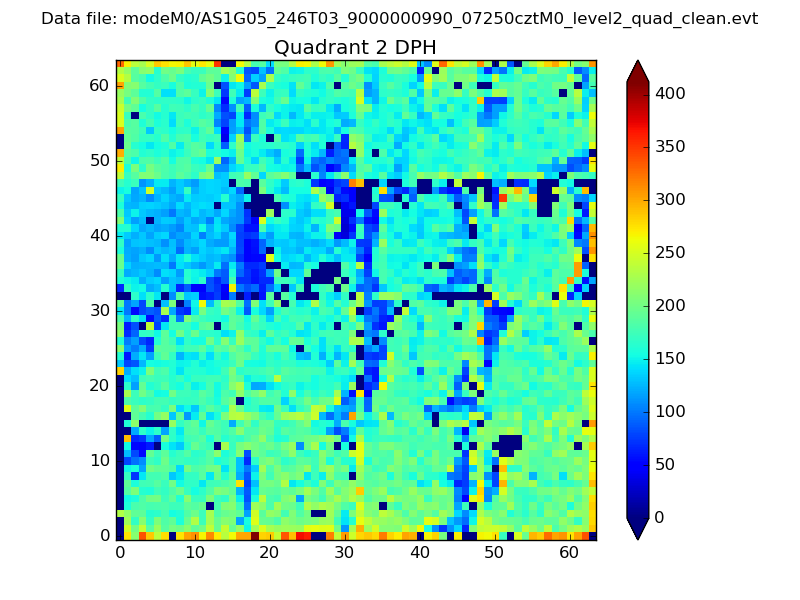 |
Quadrant C |
| Plot type | Count rate plots | Images |
|---|---|---|
| Comparison with Poisson distribution Blue bars denote a histogram of data divided into 1 sec bins. Red curve is a Poisson curve with rate = median count rate of data. |
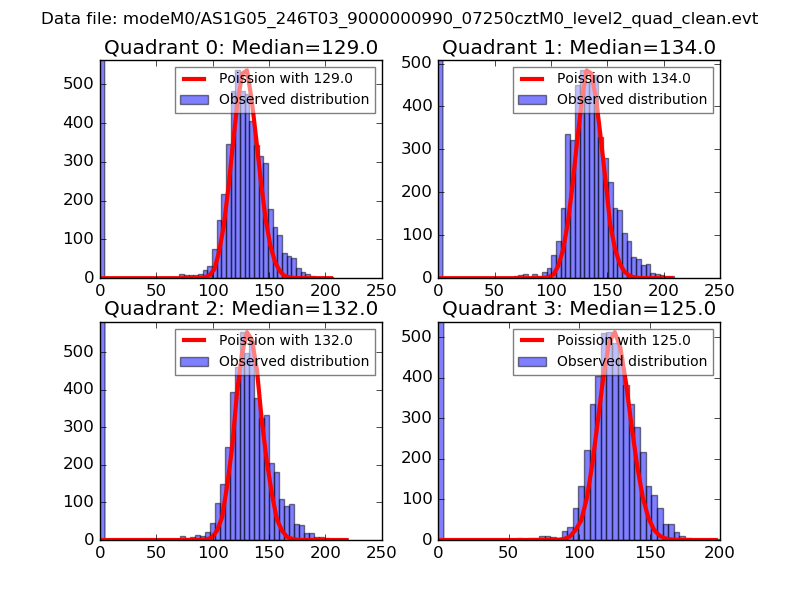 |
 |
| Quadrant-wise count rates Data is divided into 100 sec bins |
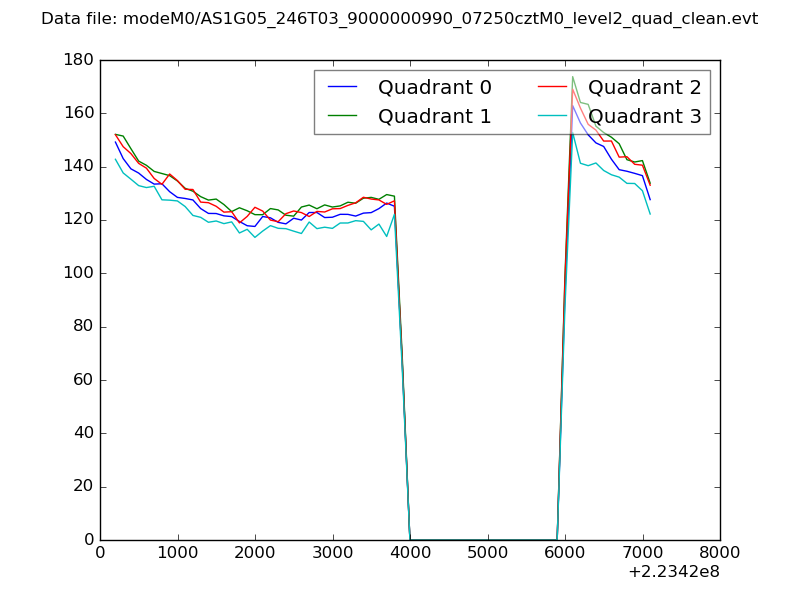 |
|
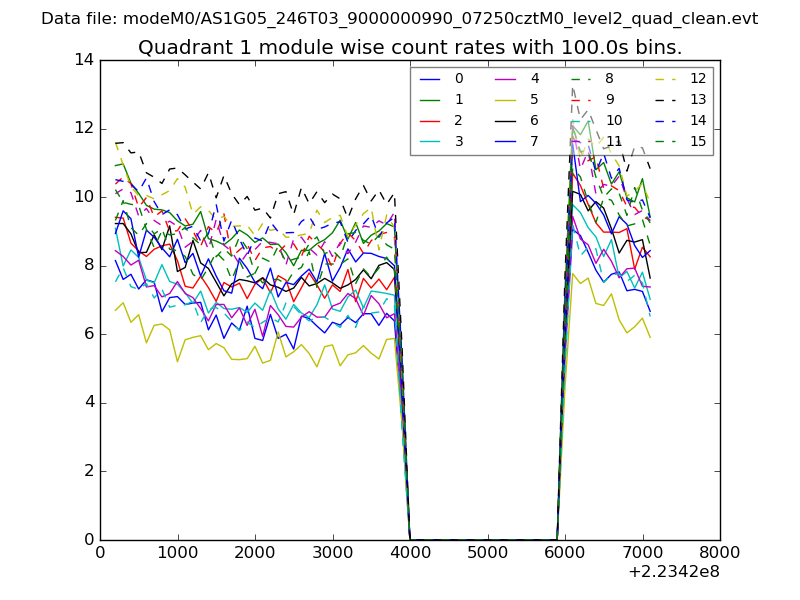
| Module-wise count rates for Quadrant A Data is divided into 100 sec bins |
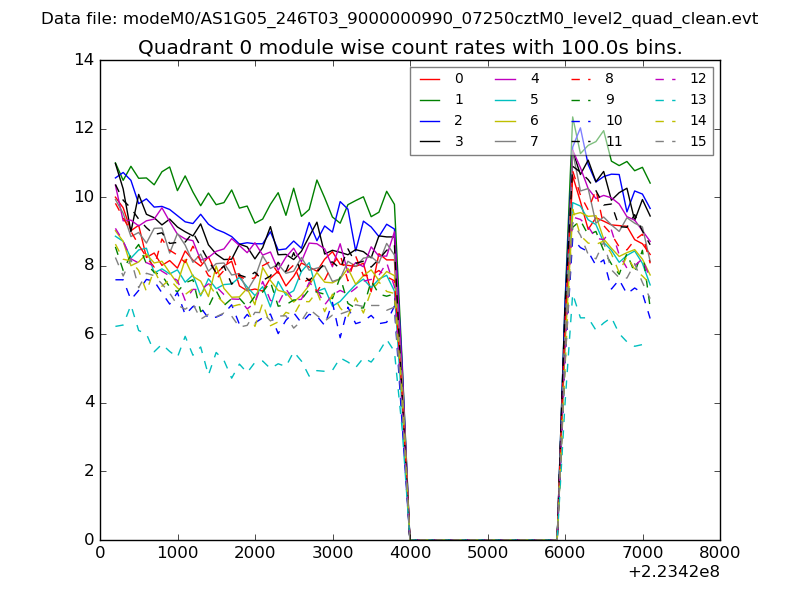 |
 |
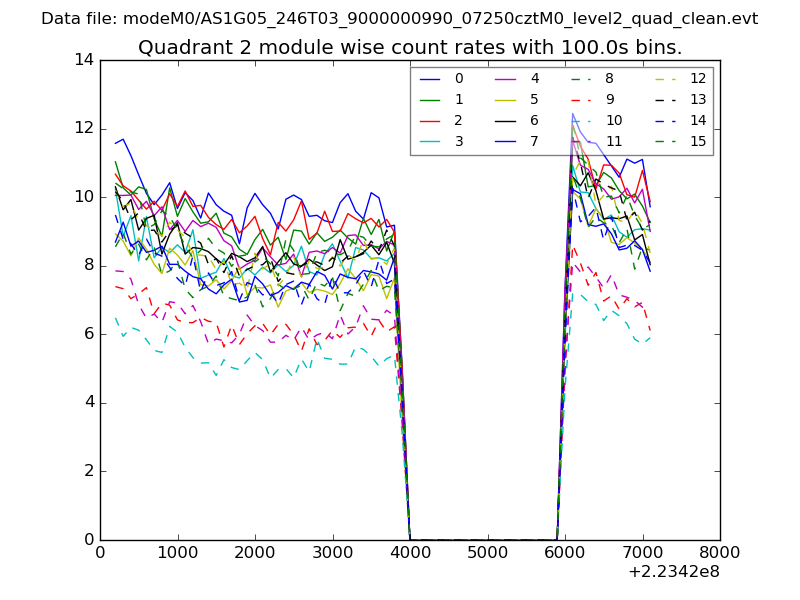
| Module-wise count rates for Quadrant B Data is divided into 100 sec bins |
 |
 |
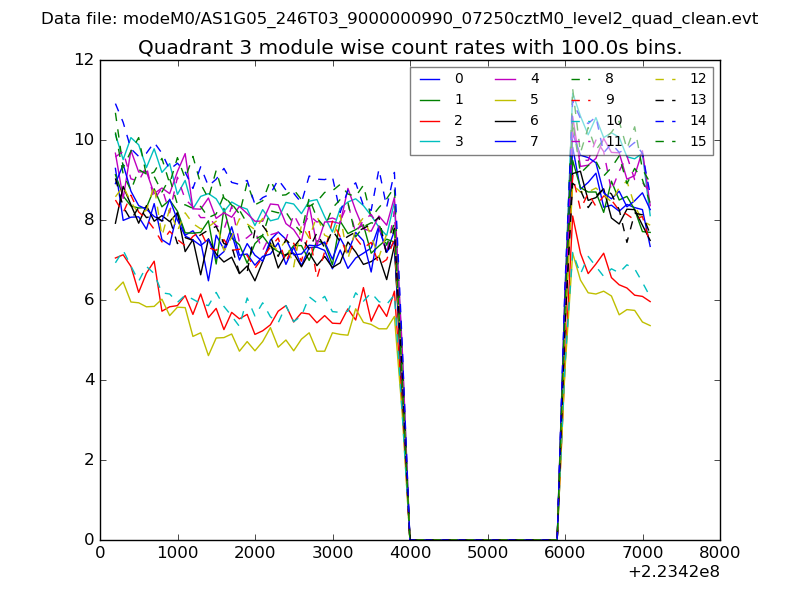
| Module-wise count rates for Quadrant C Data is divided into 100 sec bins |
 |
 |
| Module-wise count rates for Quadrant D Data is divided into 100 sec bins |
 |
 |
| Parameter | Plot |
|---|---|
| CZT HV Monitor | 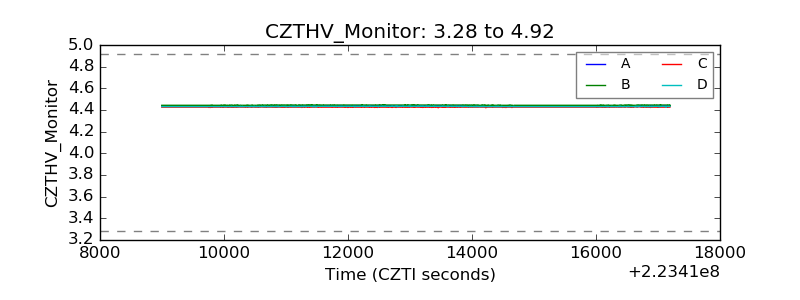 |
| D_VDD | 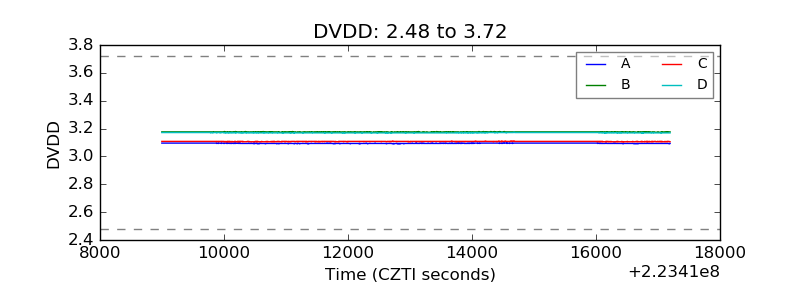 |
| Temperature 1 | 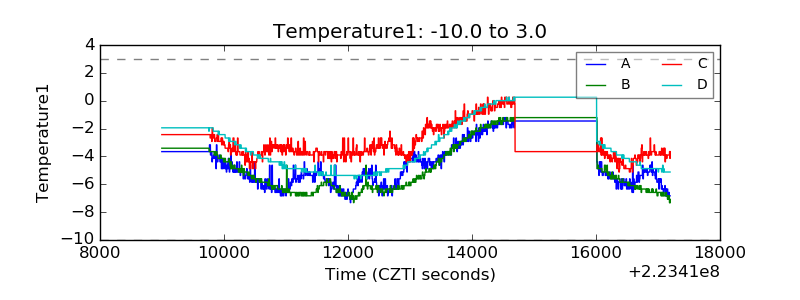 |
| Veto HV Monitor | 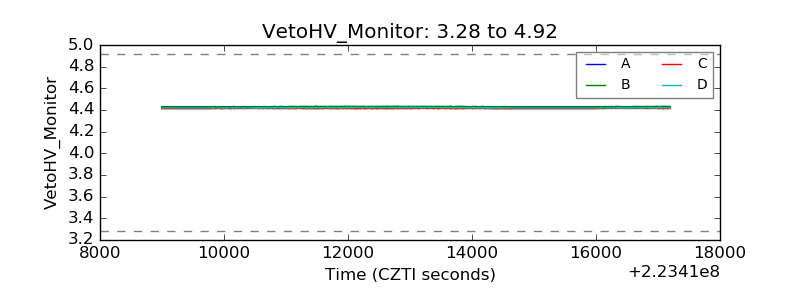 |
| Veto LLD | 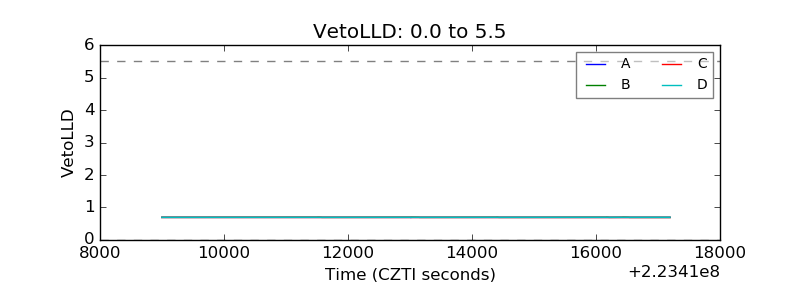 |
| Alpha Counter | 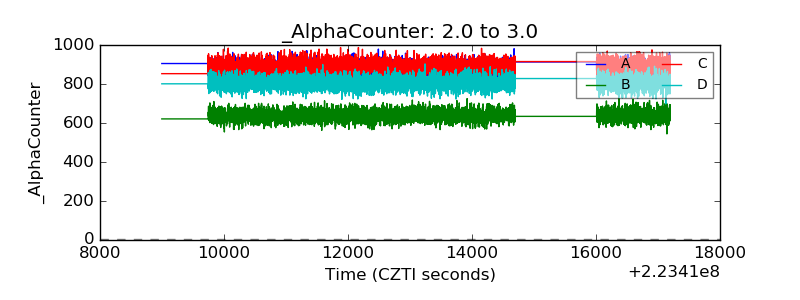 |
| _CPM_Rate | 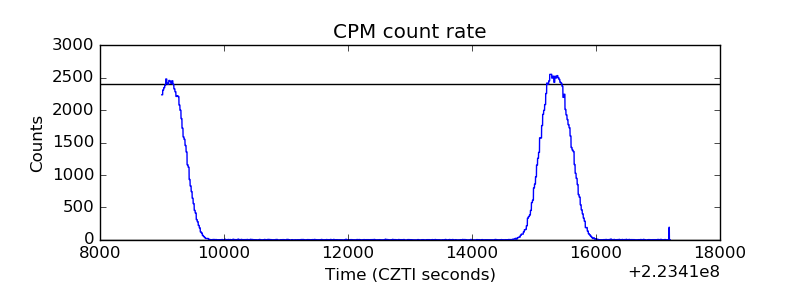 |
| CZT Counter | 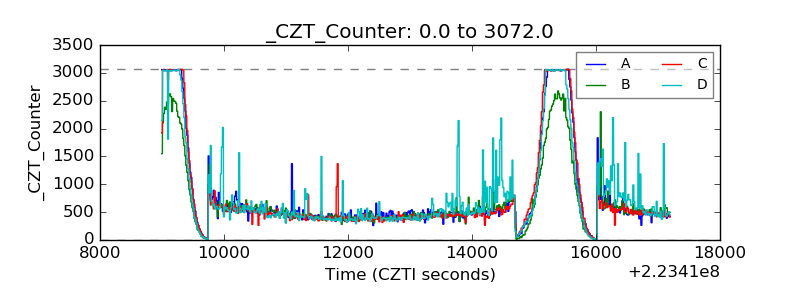 |
| +2.5 Volts monitor |  |
| +5 Volts monitor |  |
| _ROLL_ROT | 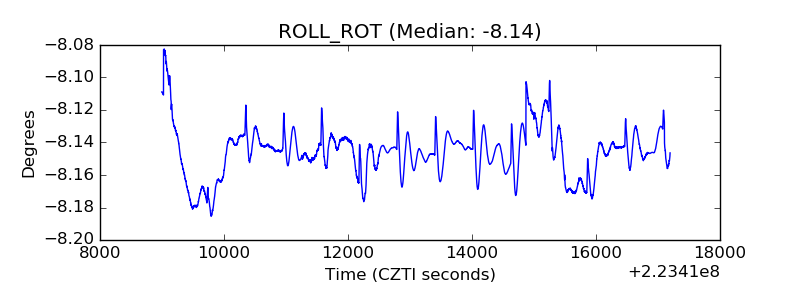 |
| _Roll_DEC | 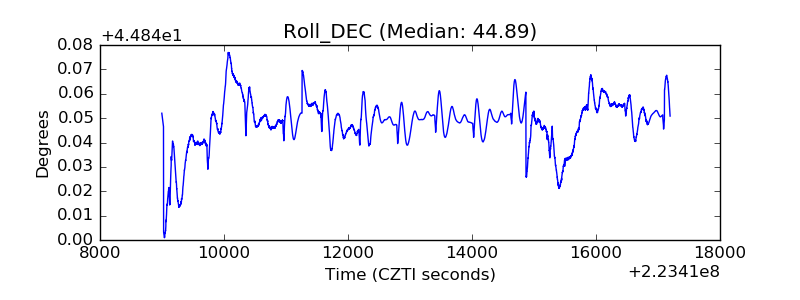 |
| _Roll_RA | 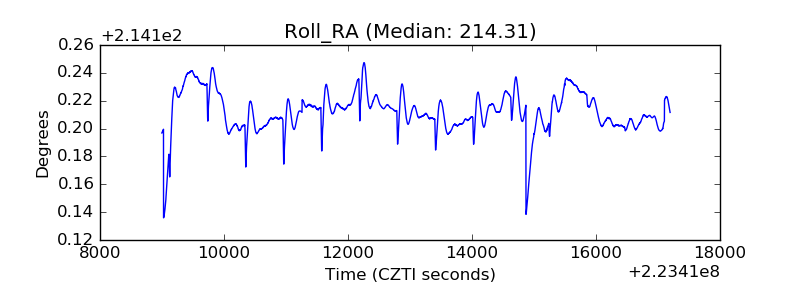 |
| Veto Counter | 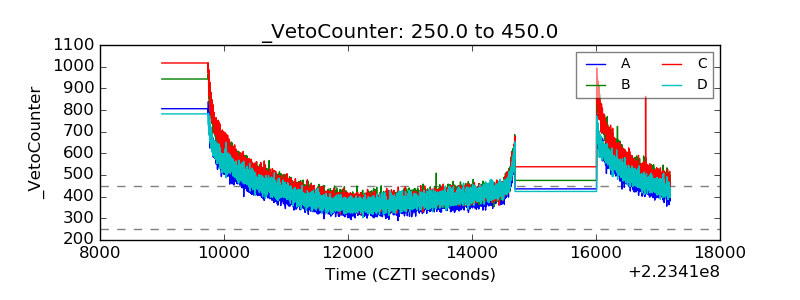 |