| Param | Original file | Final file |
|---|---|---|
| Filename | modeM0/AS1G05_246T03_9000000990_07251cztM0_level2.evt | modeM0/AS1G05_246T03_9000000990_07251cztM0_level2_quad_clean.evt |
| Size (bytes) | 418,063,680 | 102,755,520 |
| Size | 398.7 MB | 98.0 MB |
| Events in quadrant A | 2,948,835 | 668,473 |
| Events in quadrant B | 3,046,802 | 695,175 |
| Events in quadrant C | 2,924,154 | 682,749 |
| Events in quadrant D | 3,325,120 | 638,394 |
| Mode M0 | |||
|---|---|---|---|
| Quadrant | BADHDUFLAG | Total packets | Discarded packets |
| A | 0 | 12918 | 3 |
| B | 0 | 13088 | 2 |
| C | 0 | 12845 | 2 |
| D | 0 | 14384 | 2 |
| Mode M9 | |||
|---|---|---|---|
| Quadrant | BADHDUFLAG | Total packets | Discarded packets |
| A | 0 | 21 | 0 |
| B | 0 | 21 | 0 |
| C | 0 | 21 | 0 |
| D | 0 | 22 | 0 |
| Mode SS | |||
|---|---|---|---|
| Quadrant | BADHDUFLAG | Total packets | Discarded packets |
| A | 0 | 124 | 0 |
| B | 0 | 124 | 0 |
| C | 0 | 124 | 0 |
| D | 0 | 124 | 0 |
| Quadrant | Total seconds | Saturated seconds | Saturation percentage |
|---|---|---|---|
| A | 6122 | 49 | 0.800392% |
| B | 6122 | 35 | 0.571709% |
| C | 6122 | 11 | 0.179680% |
| D | 6122 | 72 | 1.176086% |
Noise dominated data is calculated using 1-second bins in cleaned event files. If a bin has >2000 counts, and if more than 50% of those come from <1% of pixels, then it is considered to be noise-dominated and hence unusable.
| Quadrant | # 1 sec bins | Bins with >0 counts | Bins with >2000 counts | High rate bins dominated by noise | Noise dominated (total time) | Noise dominated (detector-on time) | Marked lightcurve |
|---|---|---|---|---|---|---|---|
| A | 7492 | 6123 | 8 | 8 | 0.11% | 0.13% | 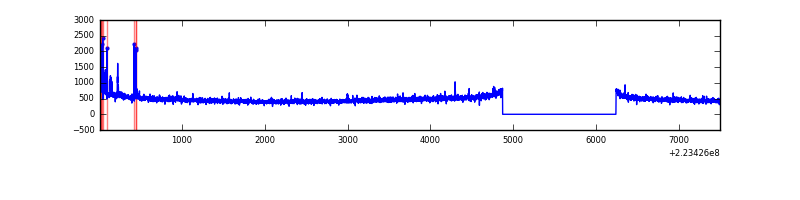 |
| B | 7492 | 6123 | 2 | 2 | 0.03% | 0.03% | 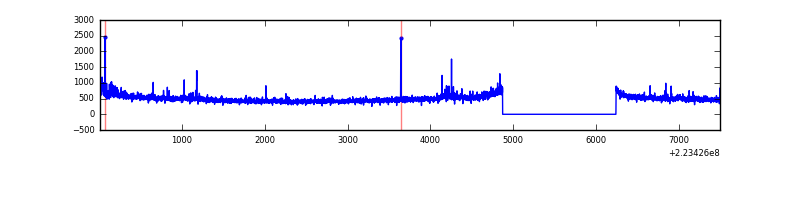 |
| C | 7492 | 6123 | 0 | 0 | 0.00% | 0.00% | 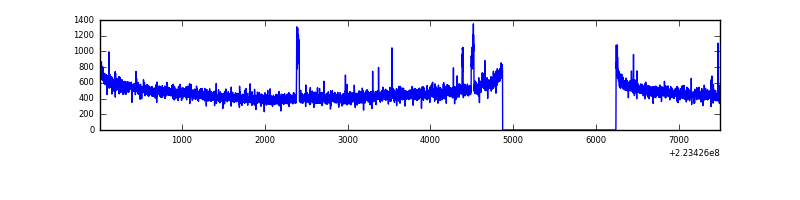 |
| D | 7492 | 6123 | 49 | 49 | 0.65% | 0.80% | 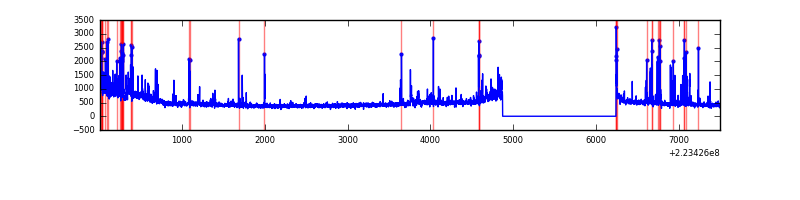 |
Top three noisy pixels from each quadrant. If the there are fewer than three noisy pixels in the level2.evt file, extra rows are filled as -1
| Pixel properties | Quadrant properties | ||||||
|---|---|---|---|---|---|---|---|
| Quadrant | DetID | PixID | Counts | Sigma | Mean | Median | Sigma |
| A | 14 | 111 | 75741 | 503.82 | 740 | 724 | 148.9 |
| A | 8 | 15 | 15498 | 99.22 | 740 | 724 | 148.9 |
| A | 13 | 248 | 9851 | 61.3 | 740 | 724 | 148.9 |
| B | 0 | 214 | 44635 | 307.04 | 758 | 741 | 143.0 |
| B | 4 | 81 | 23189 | 157.02 | 758 | 741 | 143.0 |
| B | 0 | 219 | 17569 | 117.71 | 758 | 741 | 143.0 |
| C | 9 | 243 | 45781 | 266.88 | 733 | 735 | 168.8 |
| C | 9 | 68 | 10221 | 56.2 | 733 | 735 | 168.8 |
| C | 10 | 22 | 6334 | 33.17 | 733 | 735 | 168.8 |
| D | 2 | 14 | 167617 | 955.71 | 717 | 696 | 174.7 |
| D | 13 | 169 | 143841 | 819.58 | 717 | 696 | 174.7 |
| D | 2 | 33 | 134854 | 768.13 | 717 | 696 | 174.7 |
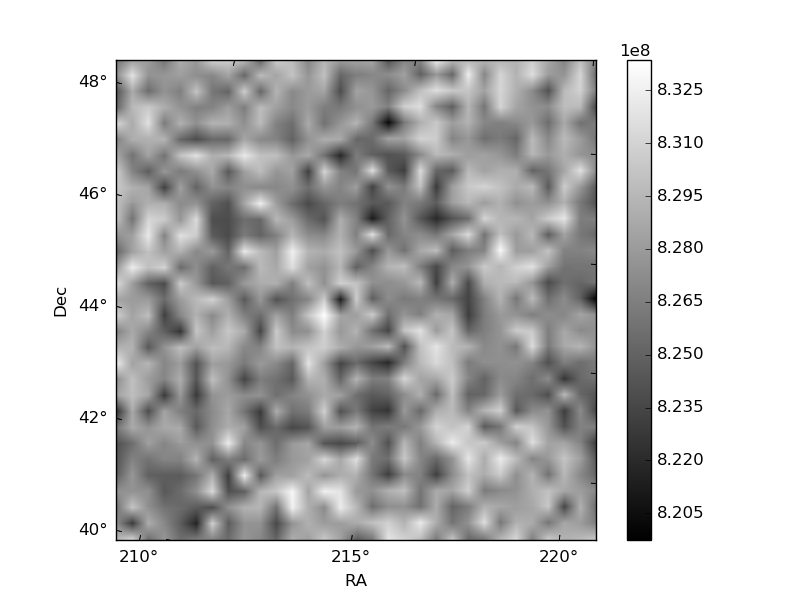
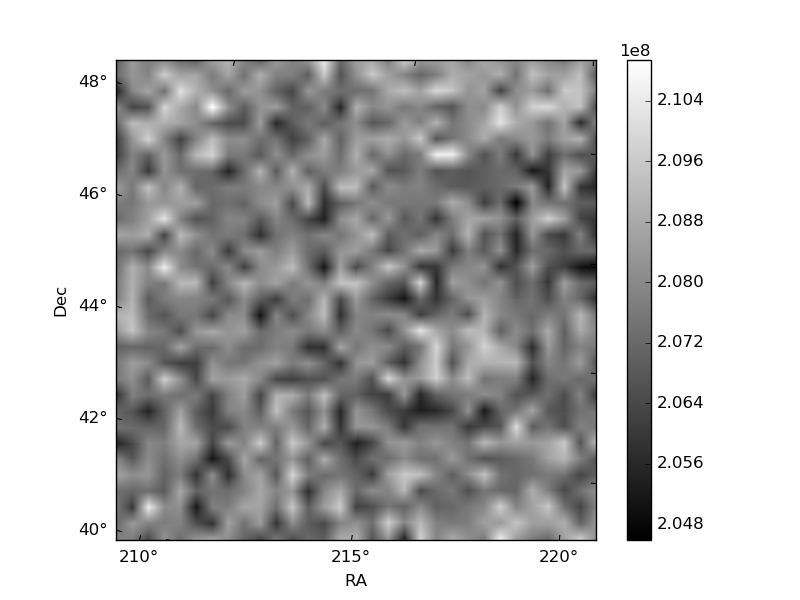
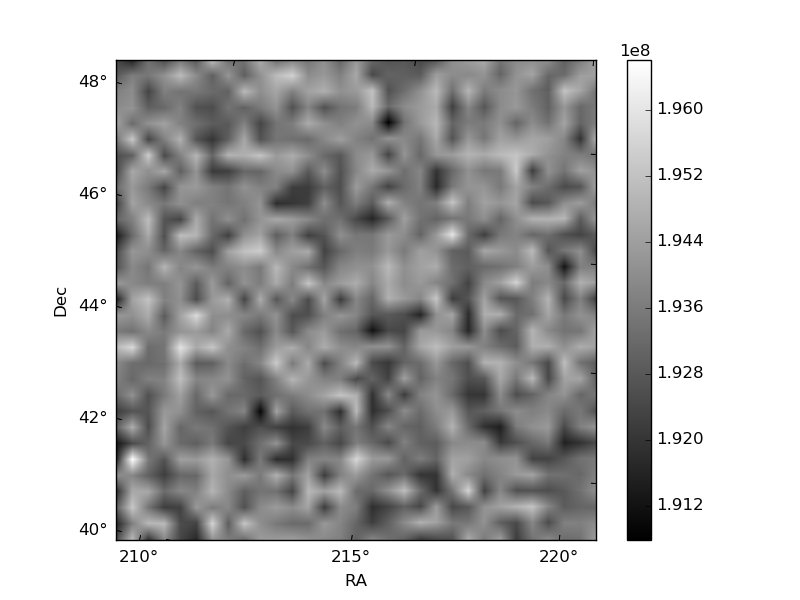
Histogram calculated using DETX and DETY for each event in the final _common_clean file
| Quadrant A | 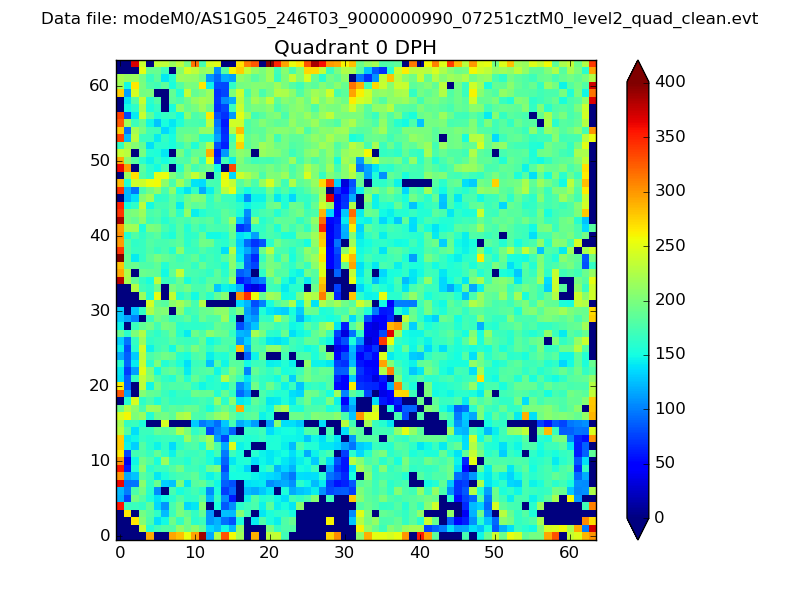 |
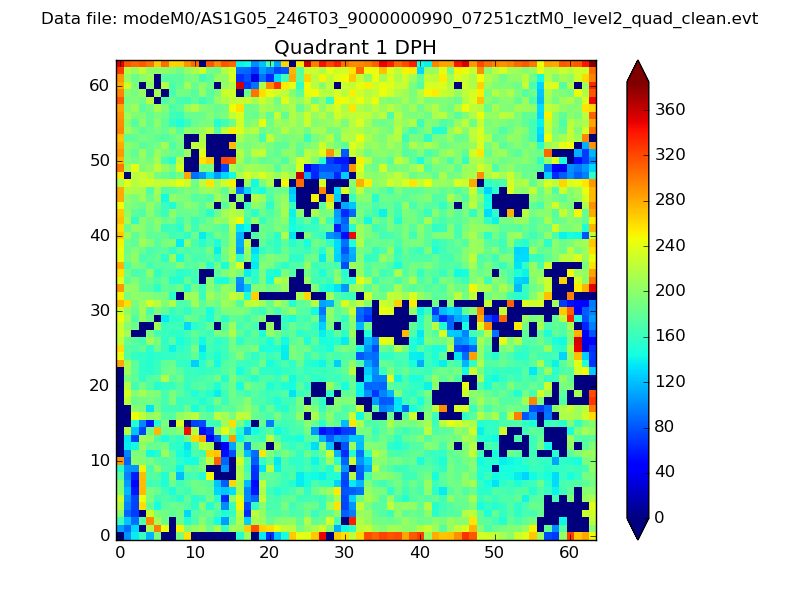 |
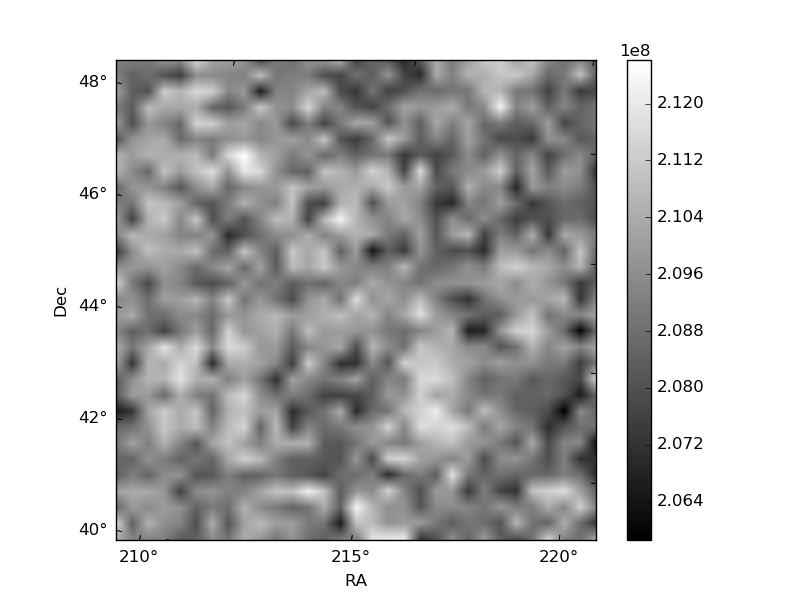
Quadrant B |
|---|---|---|---|
| Quadrant D | 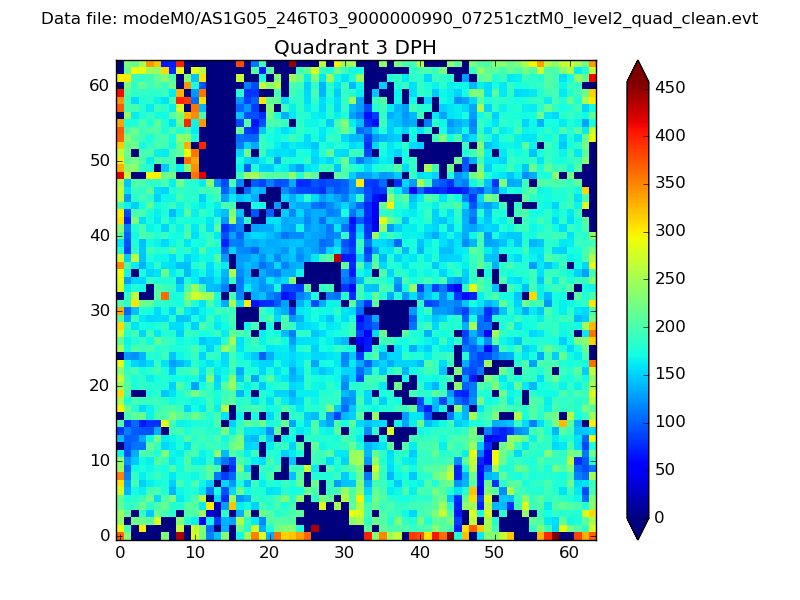 |
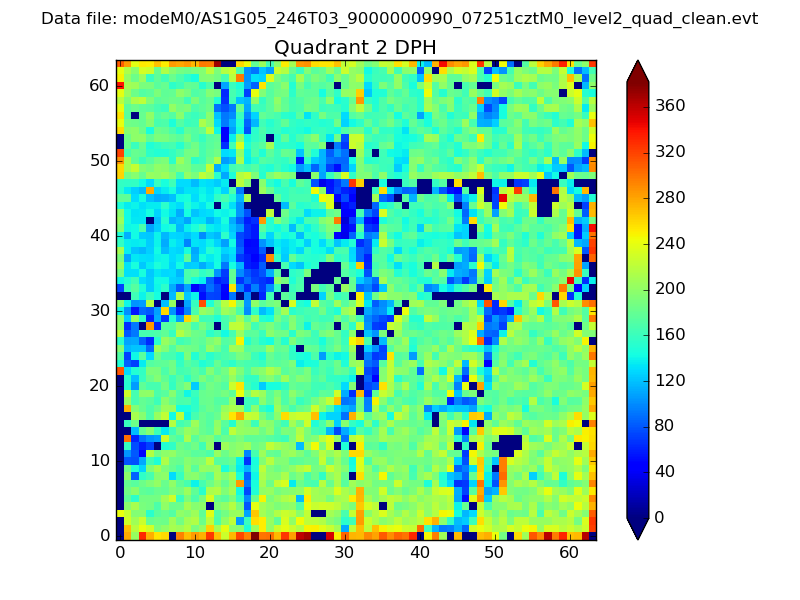 |
Quadrant C |
| Plot type | Count rate plots | Images |
|---|---|---|
| Comparison with Poisson distribution Blue bars denote a histogram of data divided into 1 sec bins. Red curve is a Poisson curve with rate = median count rate of data. |
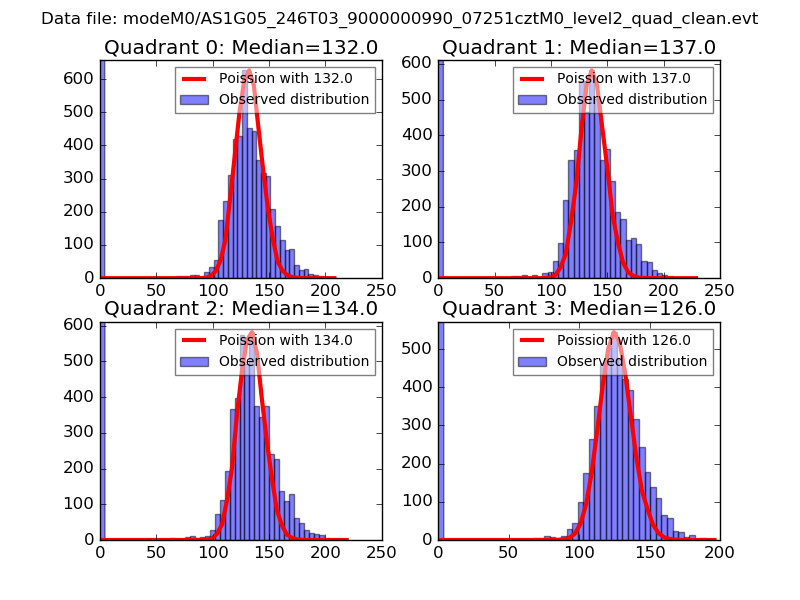 |
 |
| Quadrant-wise count rates Data is divided into 100 sec bins |
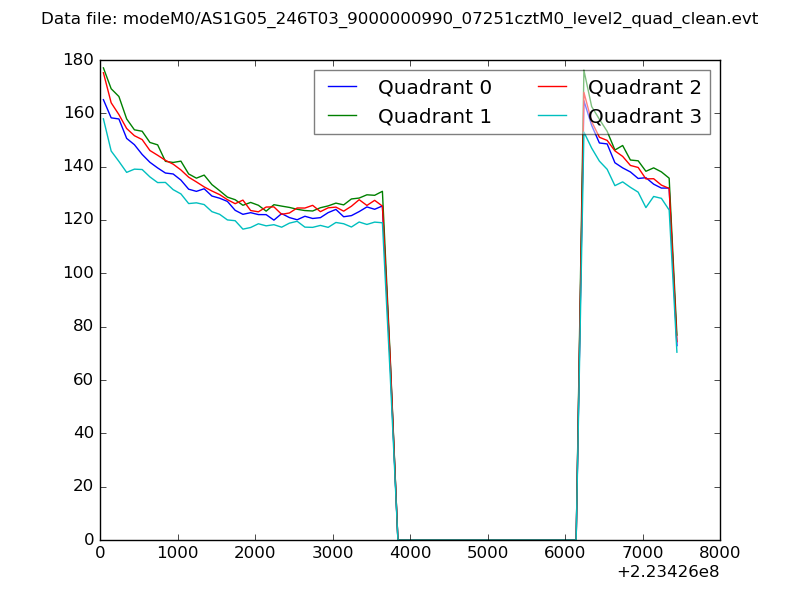 |
|
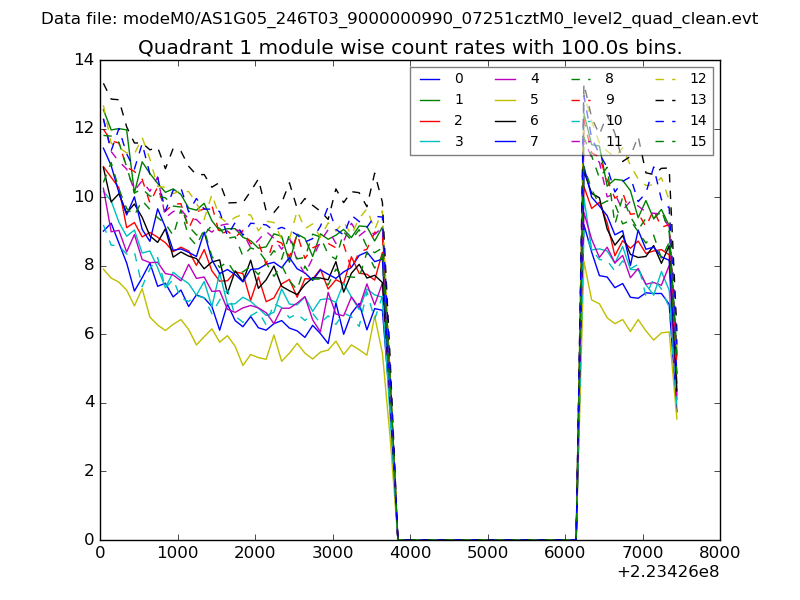
| Module-wise count rates for Quadrant A Data is divided into 100 sec bins |
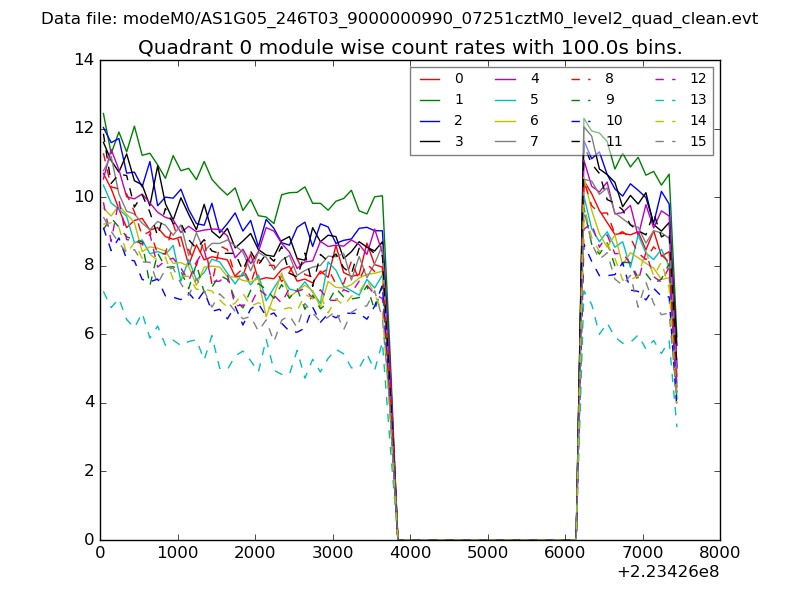 |
 |
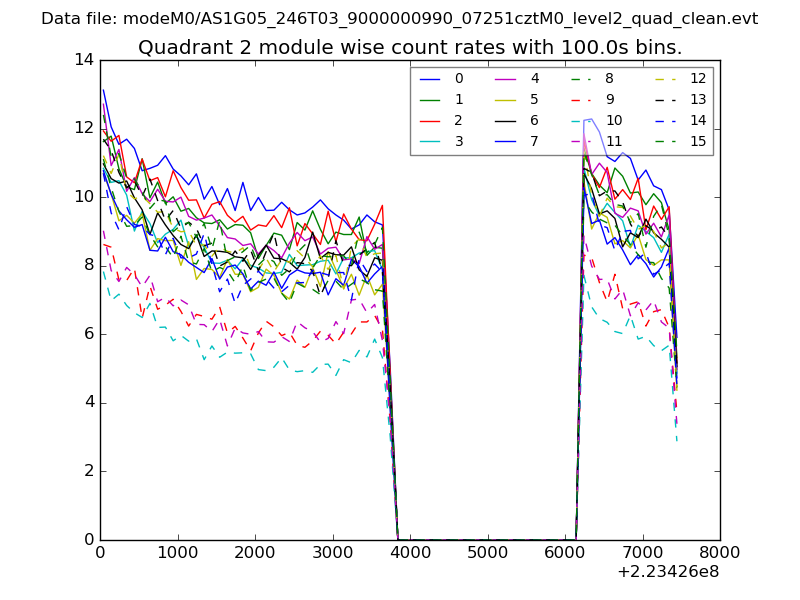
| Module-wise count rates for Quadrant B Data is divided into 100 sec bins |
 |
 |
| Module-wise count rates for Quadrant C Data is divided into 100 sec bins |
 |
 |
| Module-wise count rates for Quadrant D Data is divided into 100 sec bins |
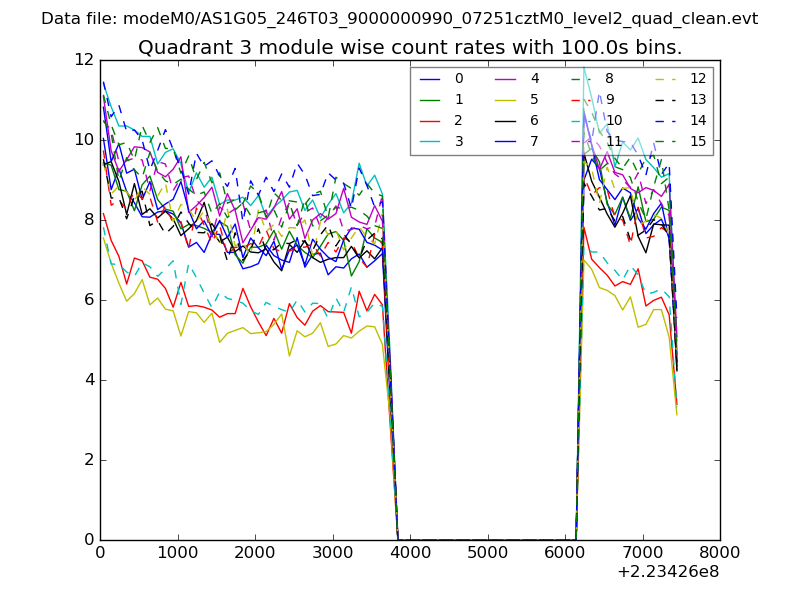 |
 |
| Parameter | Plot |
|---|---|
| CZT HV Monitor | 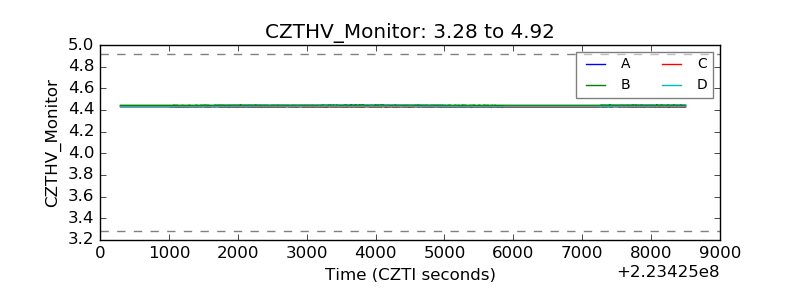 |
| D_VDD | 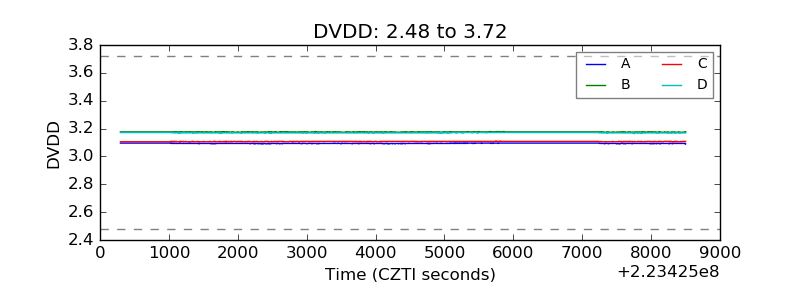 |
| Temperature 1 | 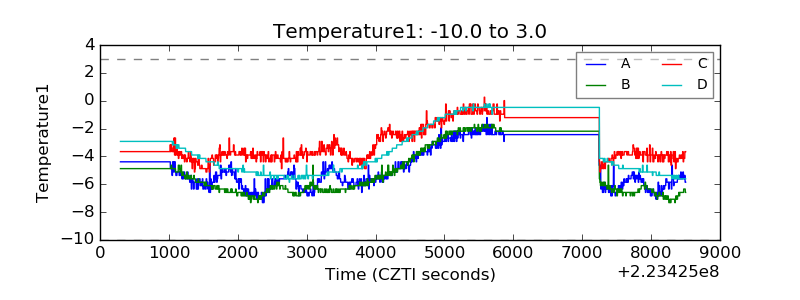 |
| Veto HV Monitor | 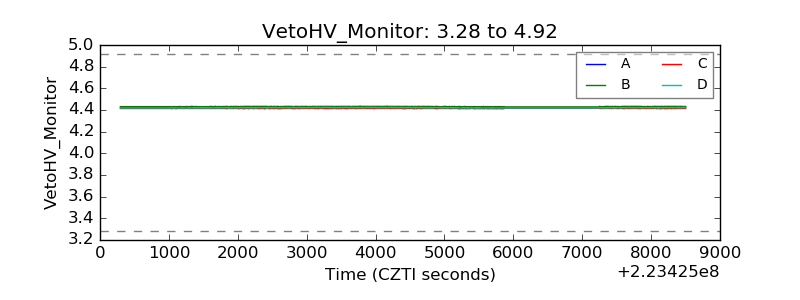 |
| Veto LLD | 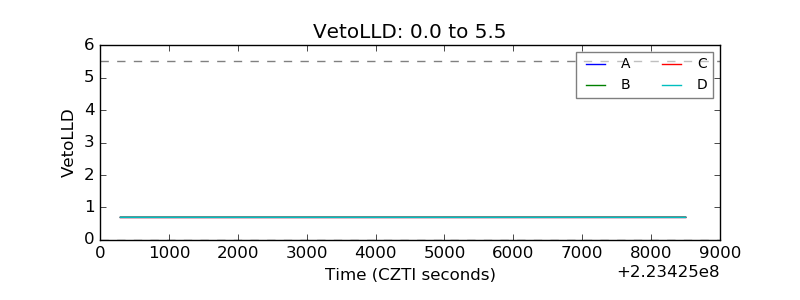 |
| Alpha Counter | 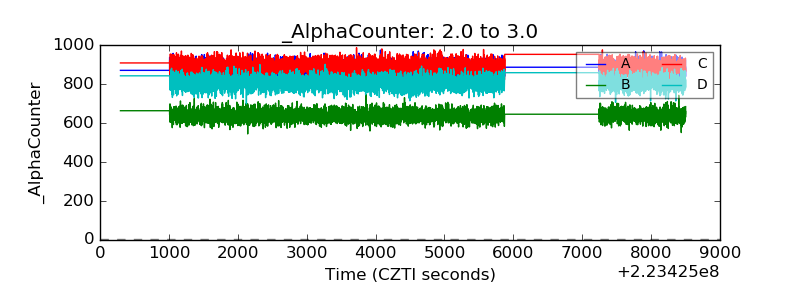 |
| _CPM_Rate | 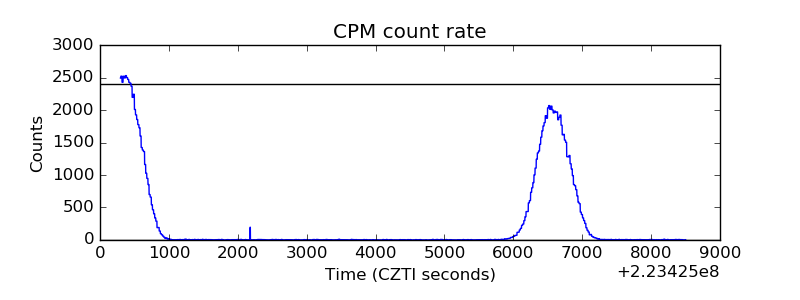 |
| CZT Counter | 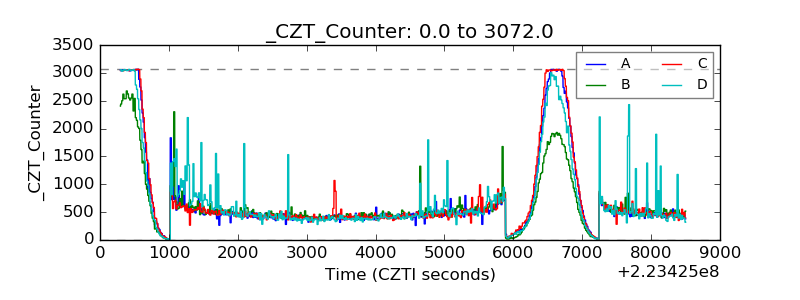 |
| +2.5 Volts monitor | 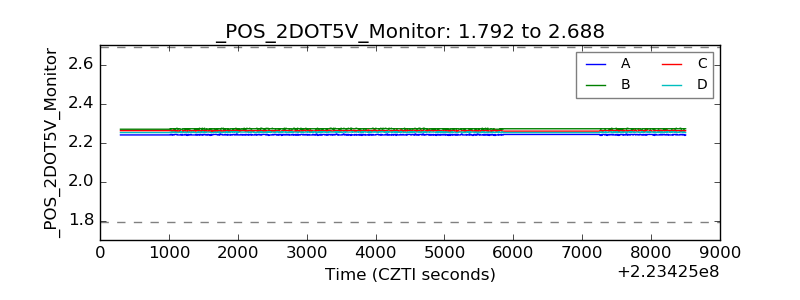 |
| +5 Volts monitor | 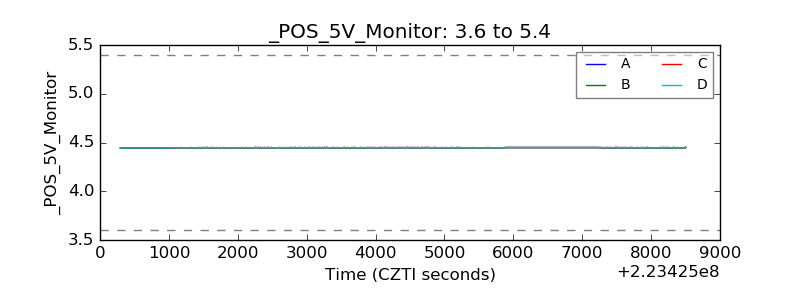 |
| _ROLL_ROT | 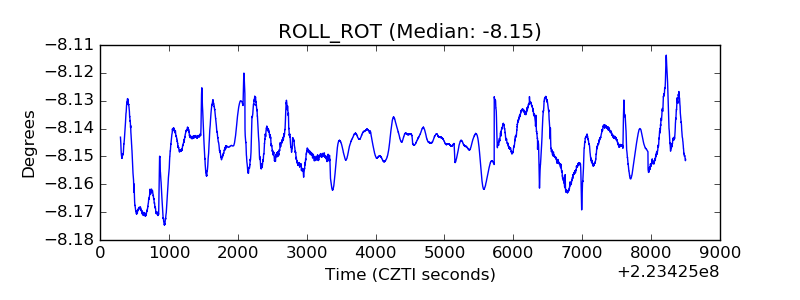 |
| _Roll_DEC | 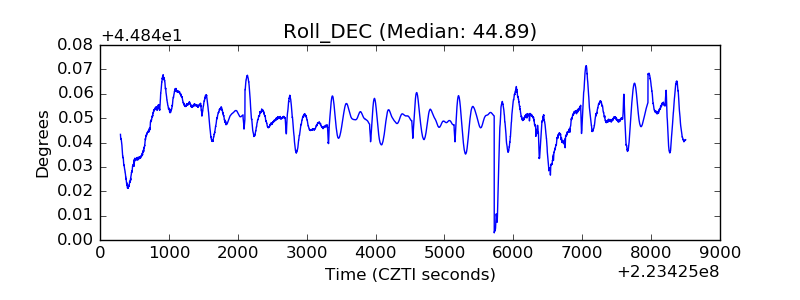 |
| _Roll_RA | 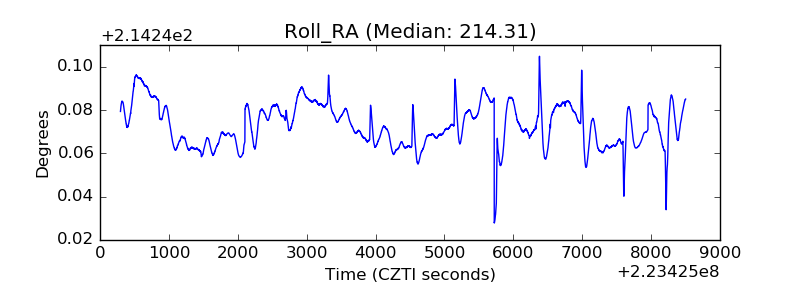 |
| Veto Counter | 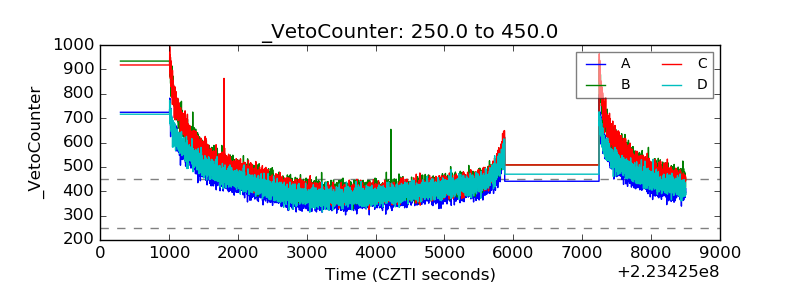 |