| Param | Original file | Final file |
|---|---|---|
| Filename | modeM0/AS1G05_246T03_9000000990_07254cztM0_level2.evt | modeM0/AS1G05_246T03_9000000990_07254cztM0_level2_quad_clean.evt |
| Size (bytes) | 453,847,680 | 94,371,840 |
| Size | 432.8 MB | 90.0 MB |
| Events in quadrant A | 3,173,370 | 594,002 |
| Events in quadrant B | 3,429,252 | 607,280 |
| Events in quadrant C | 3,097,781 | 598,133 |
| Events in quadrant D | 3,564,355 | 566,758 |
| Mode M0 | |||
|---|---|---|---|
| Quadrant | BADHDUFLAG | Total packets | Discarded packets |
| A | 0 | 14442 | 3 |
| B | 0 | 15111 | 2 |
| C | 0 | 14410 | 2 |
| D | 0 | 15907 | 2 |
| Mode M9 | |||
|---|---|---|---|
| Quadrant | BADHDUFLAG | Total packets | Discarded packets |
| A | 0 | 8 | 0 |
| B | 0 | 8 | 0 |
| C | 0 | 8 | 0 |
| D | 0 | 8 | 0 |
| Mode SS | |||
|---|---|---|---|
| Quadrant | BADHDUFLAG | Total packets | Discarded packets |
| A | 0 | 142 | 0 |
| B | 0 | 142 | 0 |
| C | 0 | 142 | 0 |
| D | 0 | 142 | 0 |
| Quadrant | Total seconds | Saturated seconds | Saturation percentage |
|---|---|---|---|
| A | 7064 | 28 | 0.396376% |
| B | 7064 | 45 | 0.637033% |
| C | 7064 | 12 | 0.169875% |
| D | 7064 | 107 | 1.514723% |
Noise dominated data is calculated using 1-second bins in cleaned event files. If a bin has >2000 counts, and if more than 50% of those come from <1% of pixels, then it is considered to be noise-dominated and hence unusable.
| Quadrant | # 1 sec bins | Bins with >0 counts | Bins with >2000 counts | High rate bins dominated by noise | Noise dominated (total time) | Noise dominated (detector-on time) | Marked lightcurve |
|---|---|---|---|---|---|---|---|
| A | 7804 | 7065 | 0 | 0 | 0.00% | 0.00% | 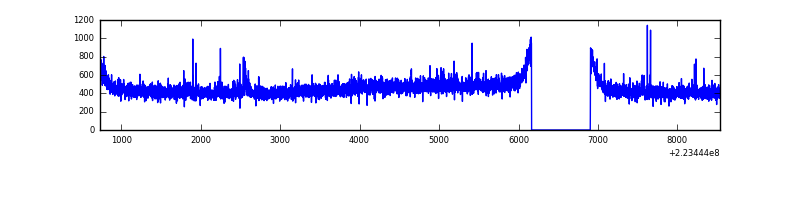 |
| B | 7804 | 7065 | 6 | 6 | 0.08% | 0.08% | 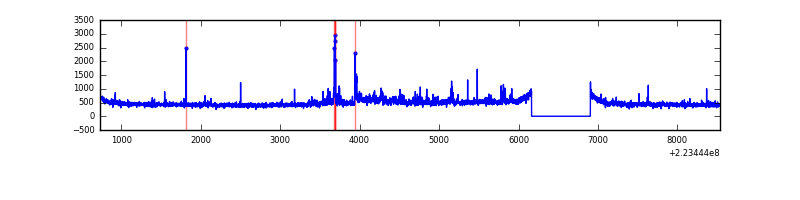 |
| C | 7804 | 7065 | 0 | 0 | 0.00% | 0.00% | 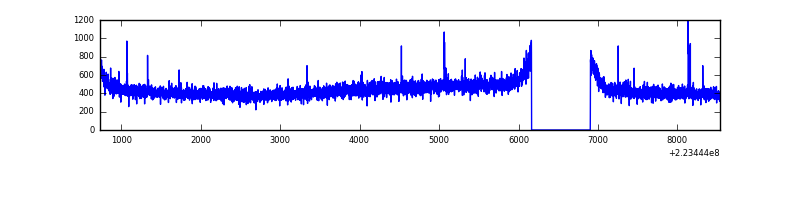 |
| D | 7804 | 7065 | 82 | 82 | 1.05% | 1.16% | 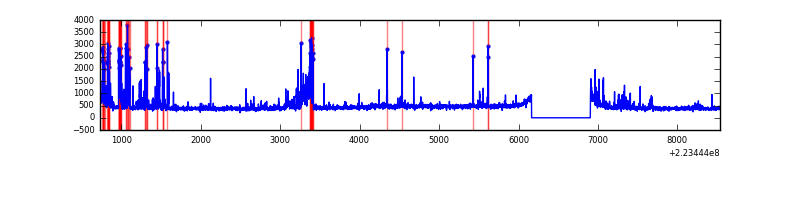 |
Top three noisy pixels from each quadrant. If the there are fewer than three noisy pixels in the level2.evt file, extra rows are filled as -1
| Pixel properties | Quadrant properties | ||||||
|---|---|---|---|---|---|---|---|
| Quadrant | DetID | PixID | Counts | Sigma | Mean | Median | Sigma |
| A | 8 | 15 | 29602 | 174.08 | 812 | 794 | 165.5 |
| A | 15 | 174 | 11829 | 66.68 | 812 | 794 | 165.5 |
| A | 0 | 226 | 7730 | 41.91 | 812 | 794 | 165.5 |
| B | 4 | 81 | 166617 | 1052.37 | 819 | 799 | 157.6 |
| B | 0 | 214 | 36909 | 229.17 | 819 | 799 | 157.6 |
| B | 4 | 239 | 23513 | 144.16 | 819 | 799 | 157.6 |
| C | 9 | 243 | 16099 | 83.93 | 785 | 789 | 182.4 |
| C | 9 | 68 | 7175 | 35.01 | 785 | 789 | 182.4 |
| C | 8 | 128 | 6116 | 29.2 | 785 | 789 | 182.4 |
| D | 2 | 14 | 282470 | 1488.18 | 776 | 751 | 189.3 |
| D | 14 | 34 | 111593 | 585.52 | 776 | 751 | 189.3 |
| D | 2 | 206 | 88802 | 465.13 | 776 | 751 | 189.3 |
Histogram calculated using DETX and DETY for each event in the final _common_clean file
| Quadrant A | 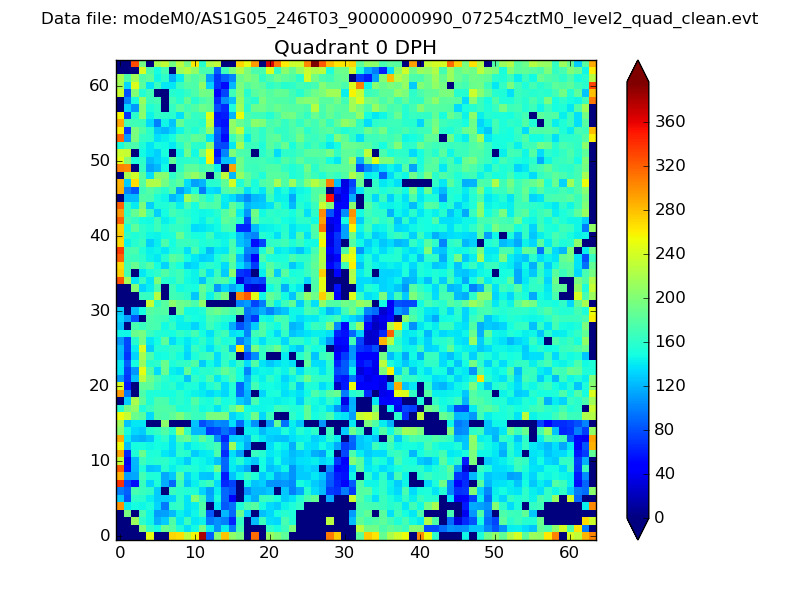 |
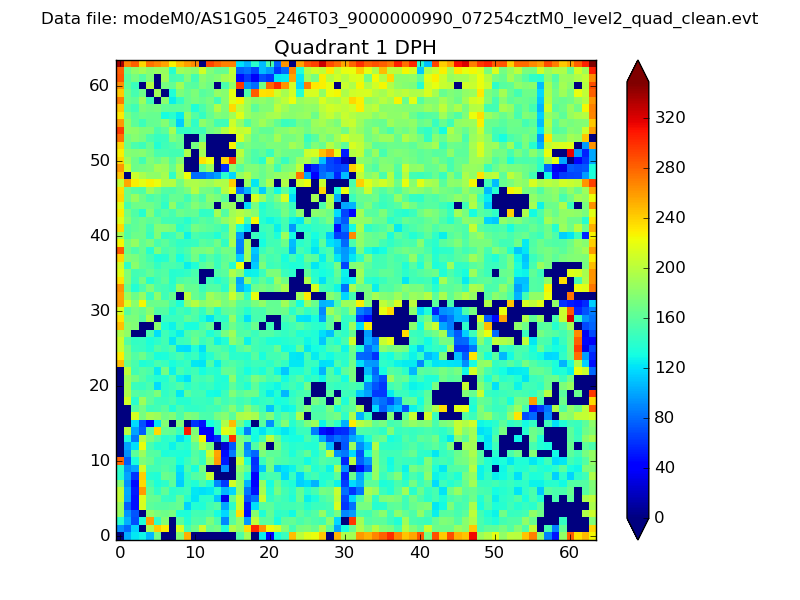 |
Quadrant B |
|---|---|---|---|
| Quadrant D | 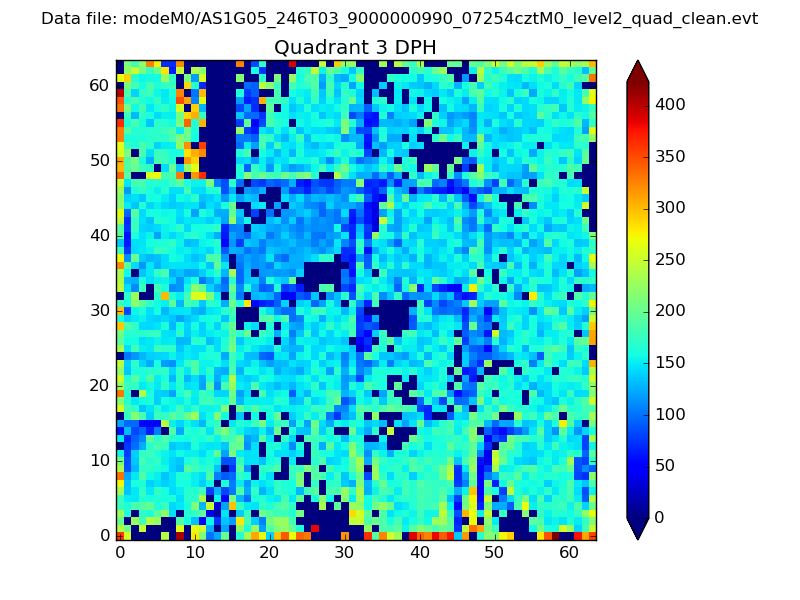 |
 |
Quadrant C |
| Plot type | Count rate plots | Images |
|---|---|---|
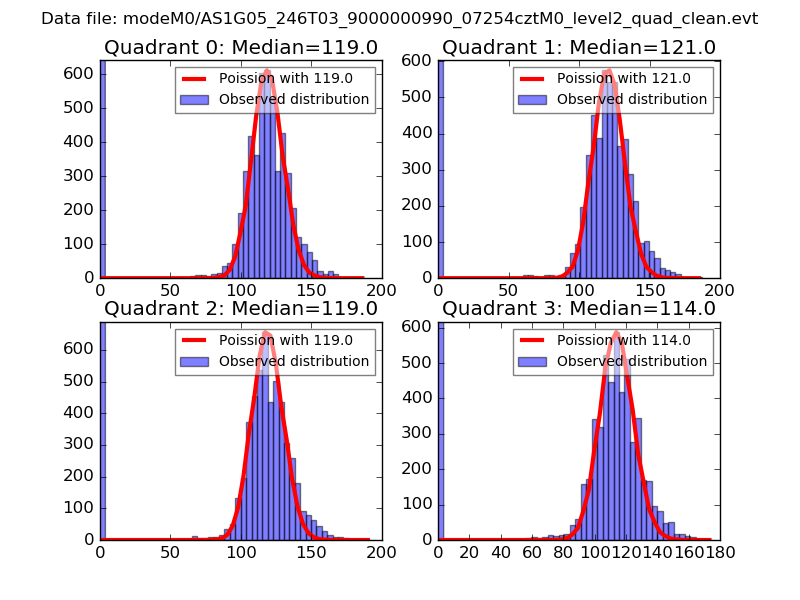
| Comparison with Poisson distribution Blue bars denote a histogram of data divided into 1 sec bins. Red curve is a Poisson curve with rate = median count rate of data. |
 |
 |
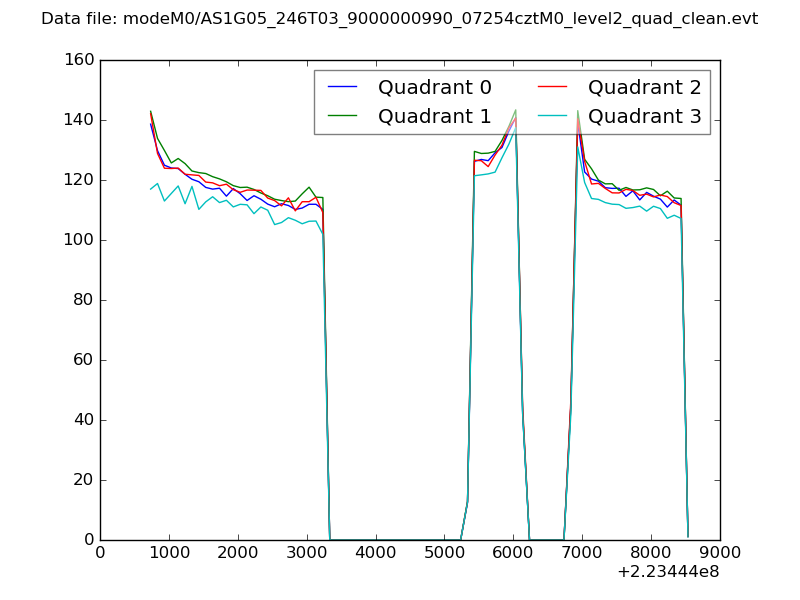
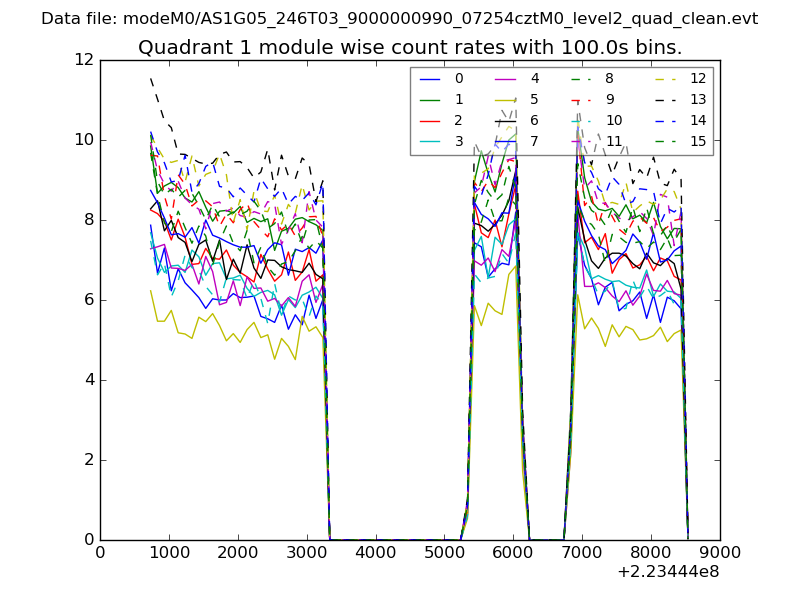
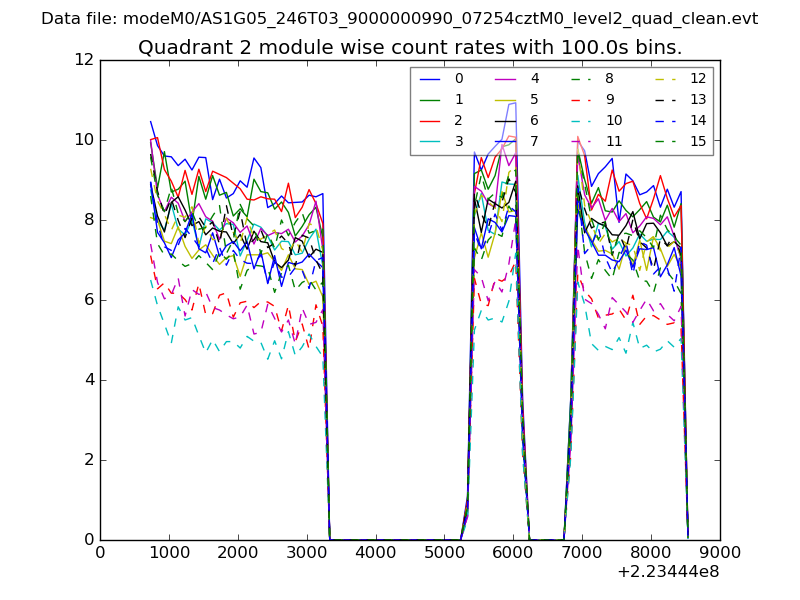
| Quadrant-wise count rates Data is divided into 100 sec bins |
 |
|
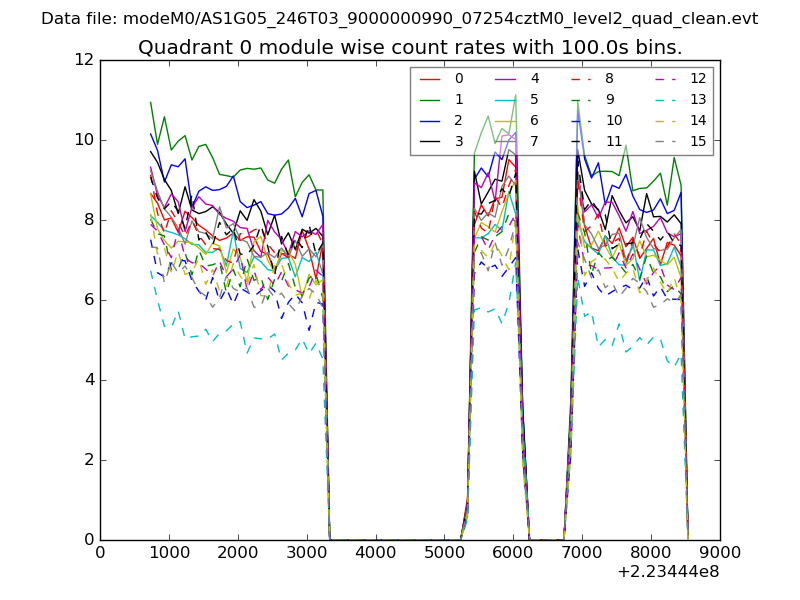
| Module-wise count rates for Quadrant A Data is divided into 100 sec bins |
 |
 |
| Module-wise count rates for Quadrant B Data is divided into 100 sec bins |
 |
 |
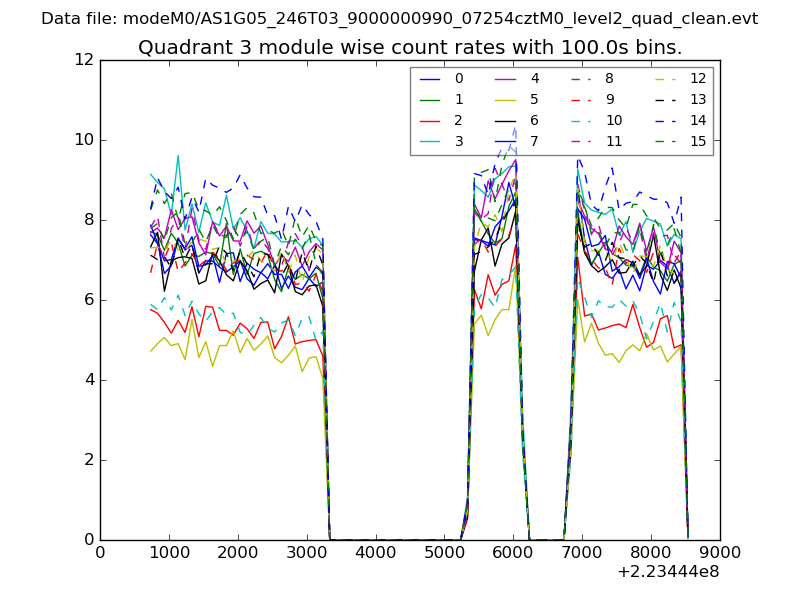
| Module-wise count rates for Quadrant C Data is divided into 100 sec bins |
 |
 |
| Module-wise count rates for Quadrant D Data is divided into 100 sec bins |
 |
 |
| Parameter | Plot |
|---|---|
| CZT HV Monitor | 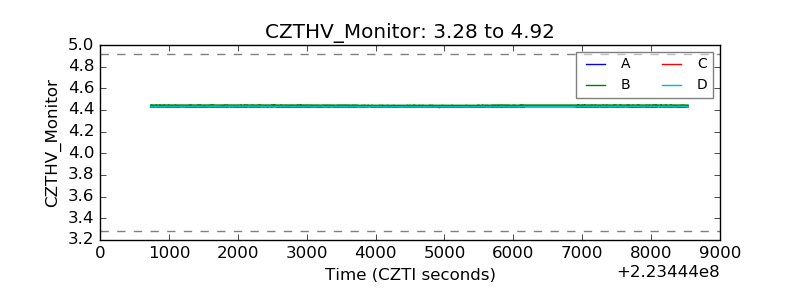 |
| D_VDD | 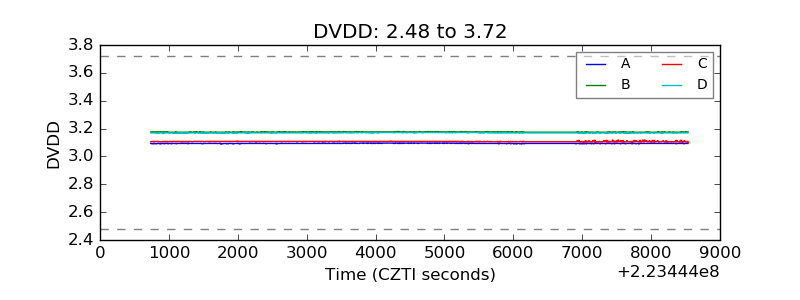 |
| Temperature 1 | 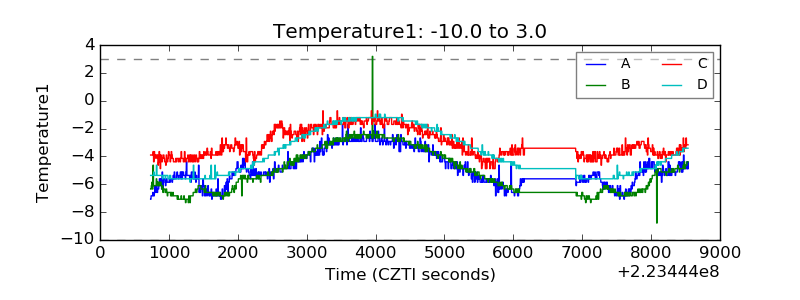 |
| Veto HV Monitor | 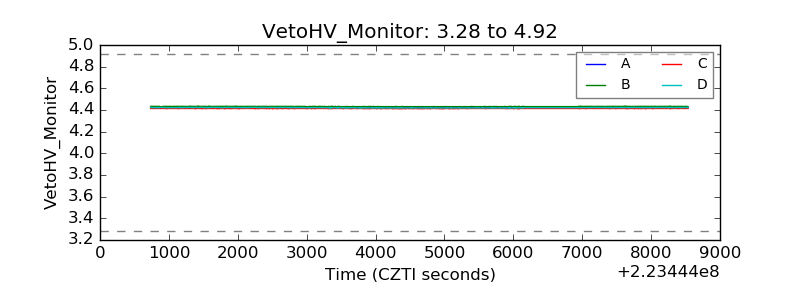 |
| Veto LLD | 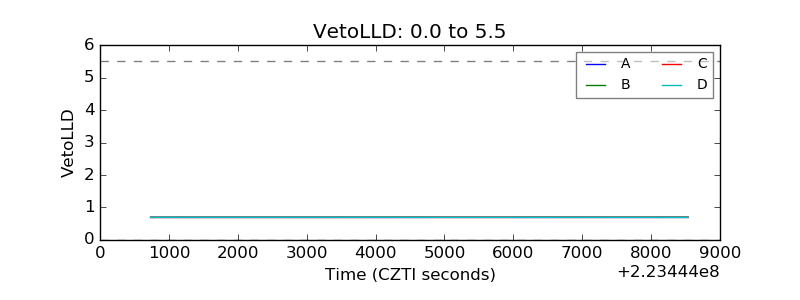 |
| Alpha Counter | 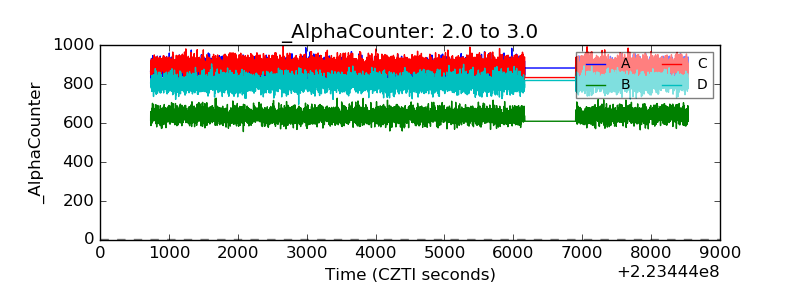 |
| _CPM_Rate | 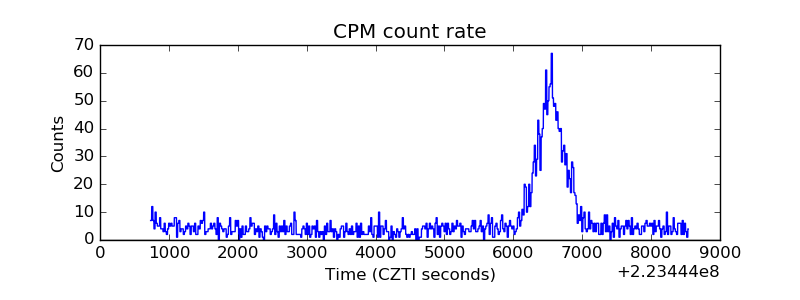 |
| CZT Counter | 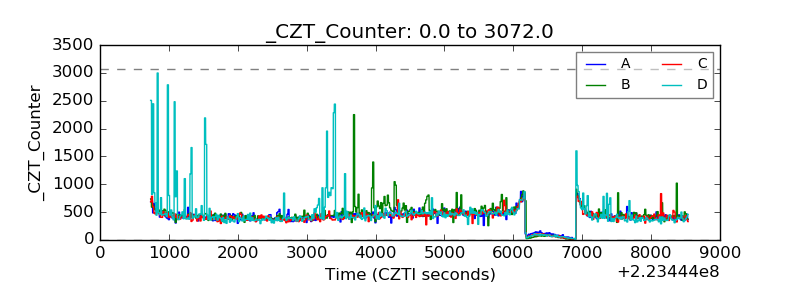 |
| +2.5 Volts monitor |  |
| +5 Volts monitor |  |
| _ROLL_ROT | 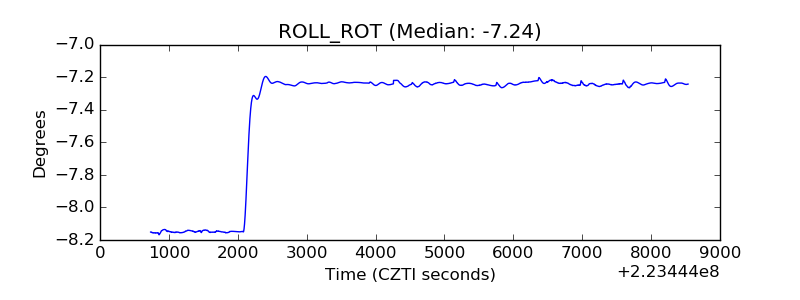 |
| _Roll_DEC | 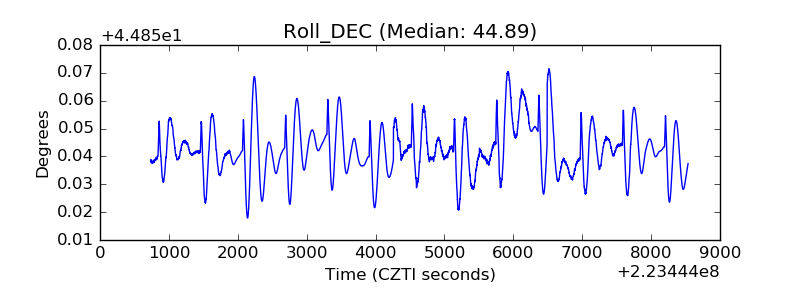 |
| _Roll_RA | 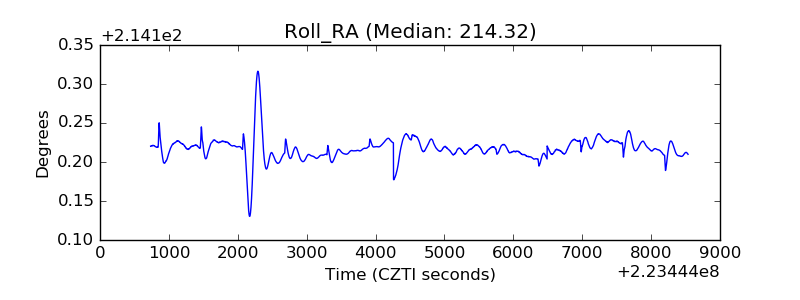 |
| Veto Counter | 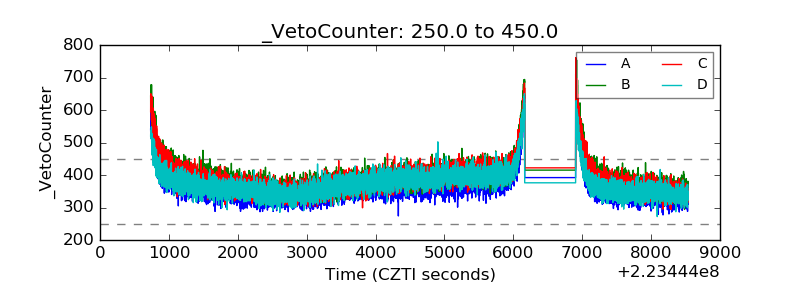 |