| Param | Original file | Final file |
|---|---|---|
| Filename | modeM0/AS1G05_246T03_9000000990_07257cztM0_level2.evt | modeM0/AS1G05_246T03_9000000990_07257cztM0_level2_quad_clean.evt |
| Size (bytes) | 269,199,360 | 42,747,840 |
| Size | 256.7 MB | 40.8 MB |
| Events in quadrant A | 1,854,151 | 248,773 |
| Events in quadrant B | 2,038,486 | 253,735 |
| Events in quadrant C | 1,817,784 | 252,605 |
| Events in quadrant D | 2,152,052 | 239,663 |
| Mode M0 | |||
|---|---|---|---|
| Quadrant | BADHDUFLAG | Total packets | Discarded packets |
| A | 0 | 8761 | 246 |
| B | 0 | 9090 | 257 |
| C | 0 | 8786 | 255 |
| D | 0 | 9821 | 335 |
| Mode SS | |||
|---|---|---|---|
| Quadrant | BADHDUFLAG | Total packets | Discarded packets |
| A | 0 | 86 | 0 |
| B | 0 | 86 | 2 |
| C | 0 | 86 | 2 |
| D | 0 | 86 | 2 |
| Quadrant | Total seconds | Saturated seconds | Saturation percentage |
|---|---|---|---|
| A | 4249 | 2 | 0.047070% |
| B | 4249 | 12 | 0.282419% |
| C | 4249 | 3 | 0.070605% |
| D | 4249 | 48 | 1.129678% |
Noise dominated data is calculated using 1-second bins in cleaned event files. If a bin has >2000 counts, and if more than 50% of those come from <1% of pixels, then it is considered to be noise-dominated and hence unusable.
| Quadrant | # 1 sec bins | Bins with >0 counts | Bins with >2000 counts | High rate bins dominated by noise | Noise dominated (total time) | Noise dominated (detector-on time) | Marked lightcurve |
|---|---|---|---|---|---|---|---|
| A | 4337 | 4281 | 0 | 0 | 0.00% | 0.00% | 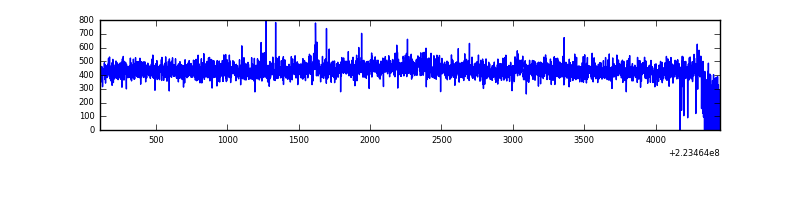 |
| B | 4329 | 4270 | 11 | 11 | 0.25% | 0.26% | 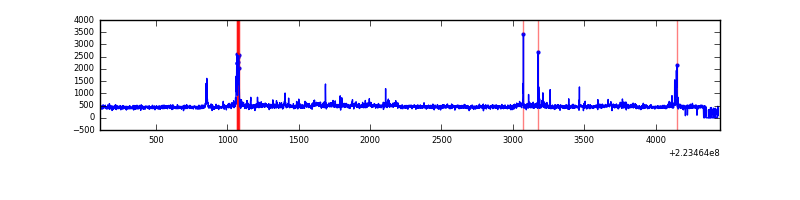 |
| C | 4341 | 4276 | 0 | 0 | 0.00% | 0.00% | 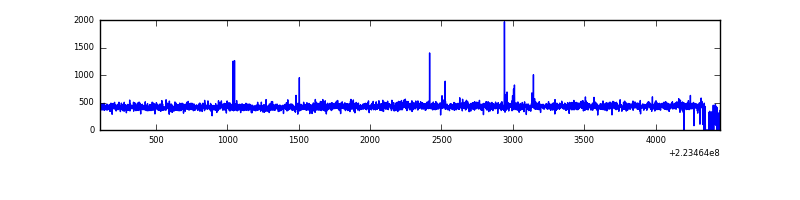 |
| D | 4336 | 4268 | 43 | 43 | 0.99% | 1.01% | 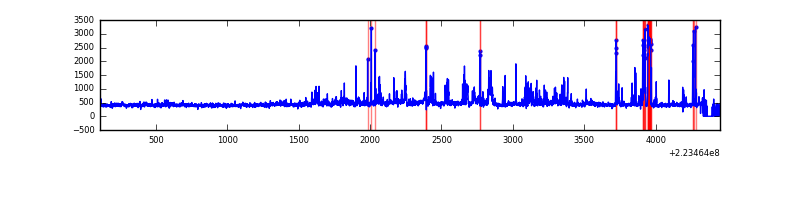 |
Top three noisy pixels from each quadrant. If the there are fewer than three noisy pixels in the level2.evt file, extra rows are filled as -1
| Pixel properties | Quadrant properties | ||||||
|---|---|---|---|---|---|---|---|
| Quadrant | DetID | PixID | Counts | Sigma | Mean | Median | Sigma |
| A | 3 | 1 | 12159 | 119.07 | 472 | 463 | 98.2 |
| A | 13 | 14 | 9354 | 90.51 | 472 | 463 | 98.2 |
| A | 8 | 15 | 9251 | 89.46 | 472 | 463 | 98.2 |
| B | 0 | 214 | 73010 | 785.14 | 475 | 464 | 92.4 |
| B | 4 | 239 | 38506 | 411.72 | 475 | 464 | 92.4 |
| B | 0 | 228 | 29953 | 319.15 | 475 | 464 | 92.4 |
| C | 10 | 22 | 8411 | 73.59 | 461 | 463 | 108.0 |
| C | 7 | 190 | 4551 | 37.85 | 461 | 463 | 108.0 |
| C | 9 | 68 | 3988 | 32.64 | 461 | 463 | 108.0 |
| D | 2 | 216 | 196368 | 1709.33 | 458 | 444 | 114.6 |
| D | 2 | 14 | 152316 | 1325.0 | 458 | 444 | 114.6 |
| D | 2 | 33 | 61093 | 529.13 | 458 | 444 | 114.6 |
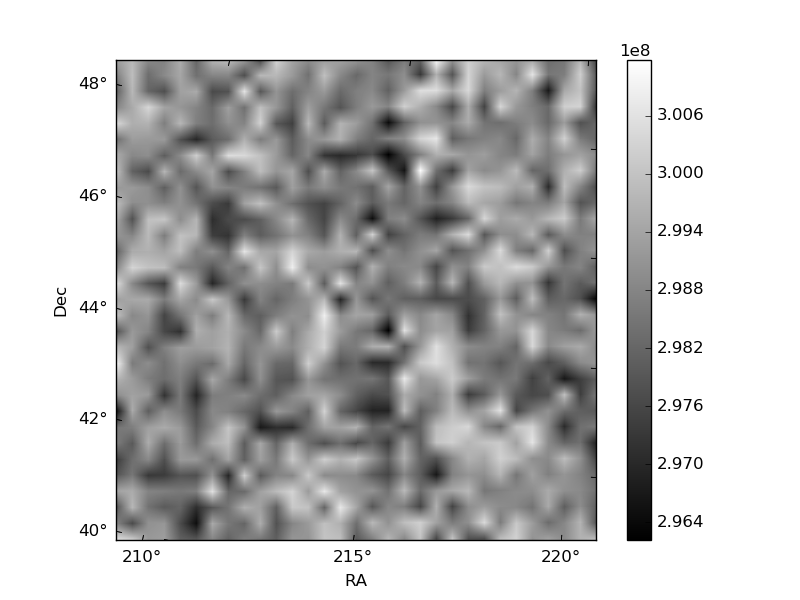
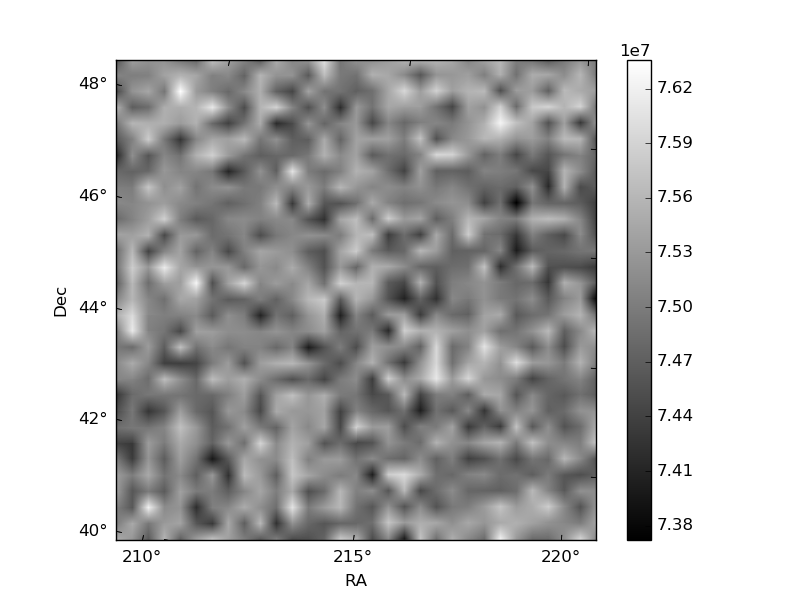
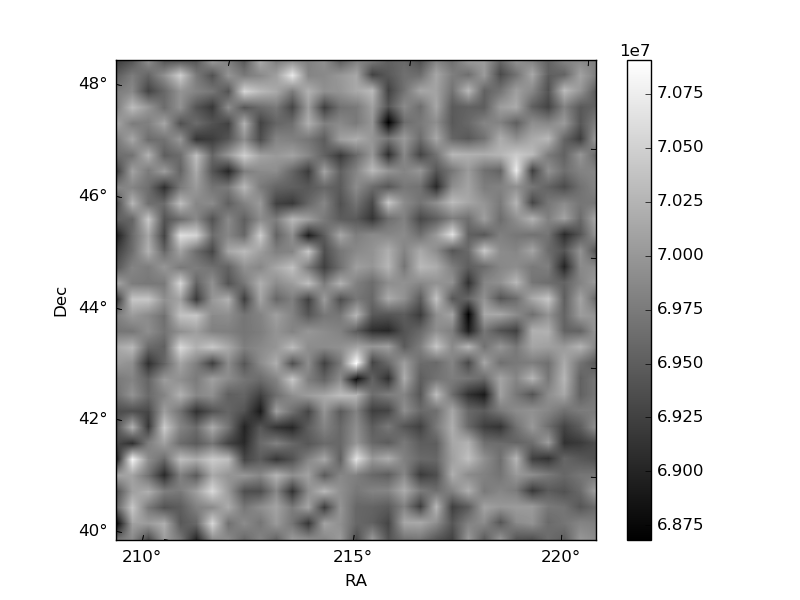
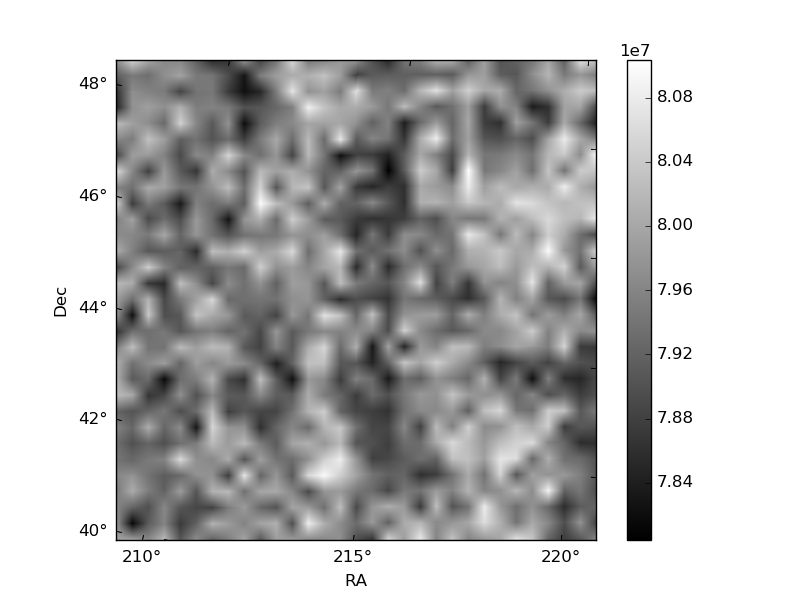
Histogram calculated using DETX and DETY for each event in the final _common_clean file
| Quadrant A | 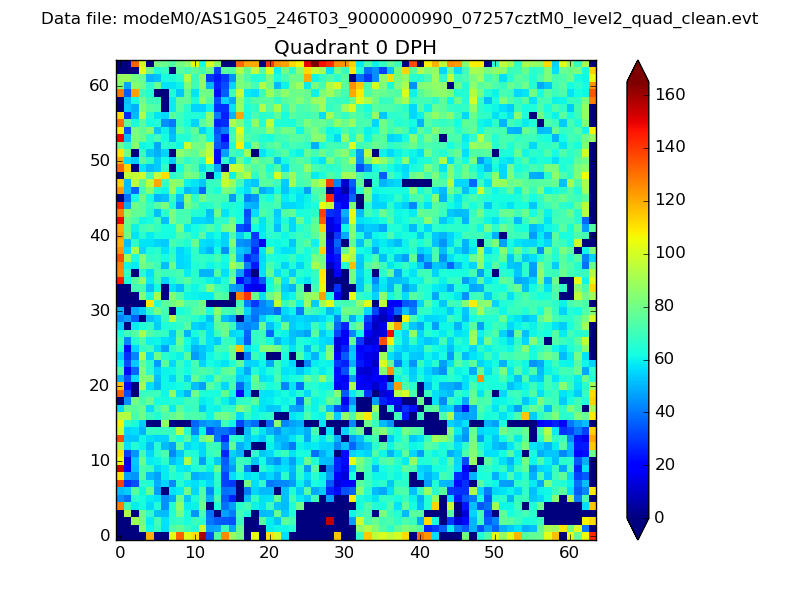 |
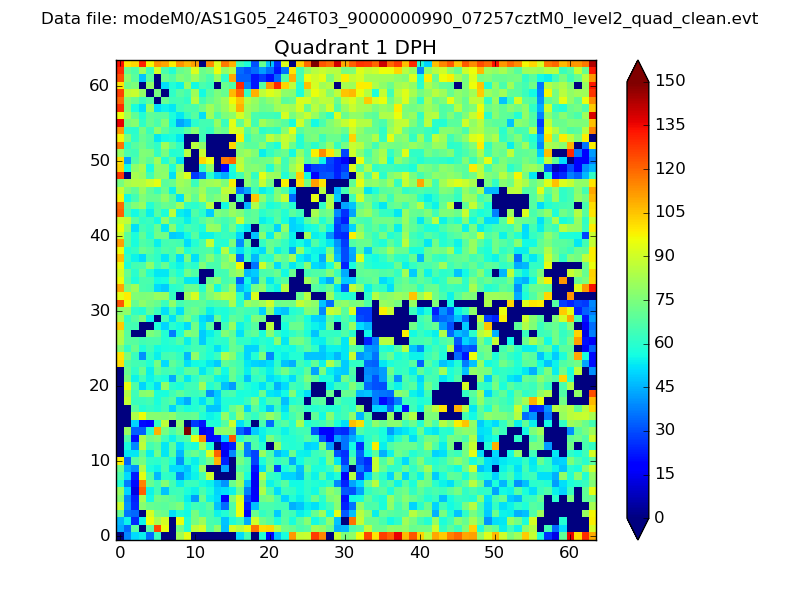 |
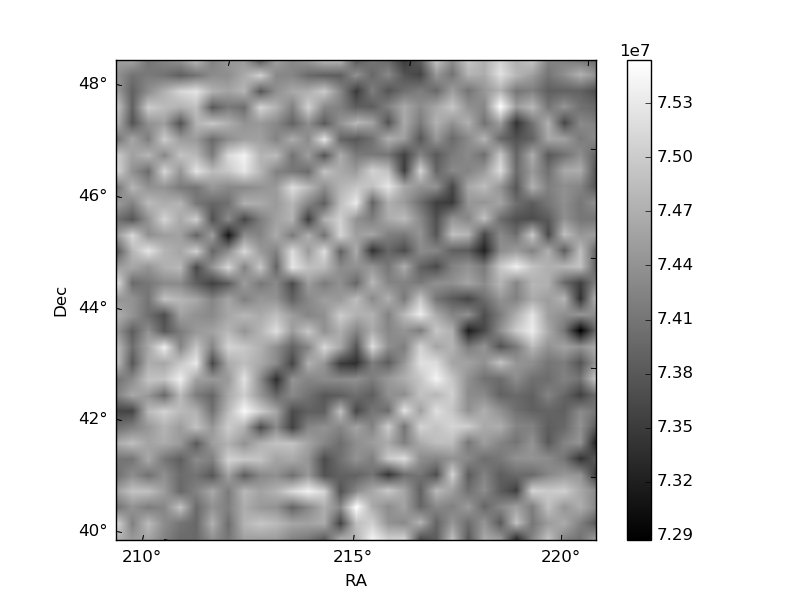
Quadrant B |
|---|---|---|---|
| Quadrant D | 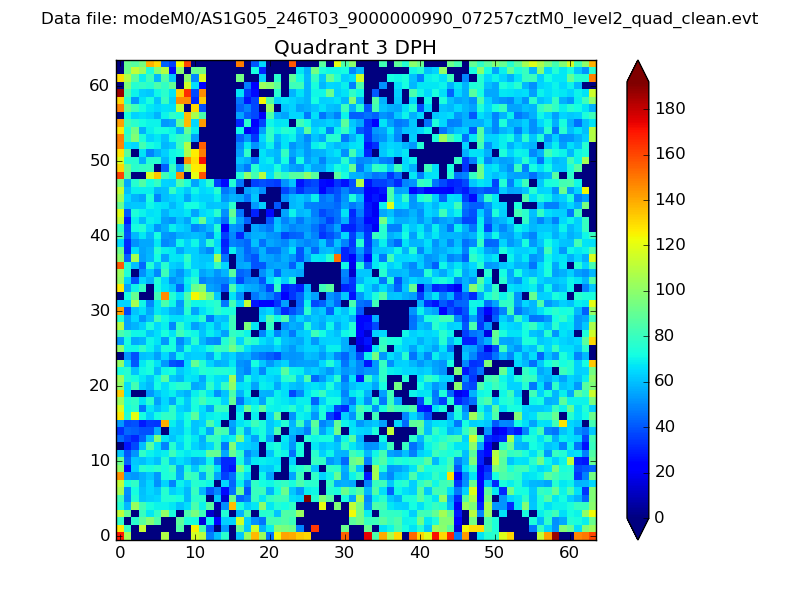 |
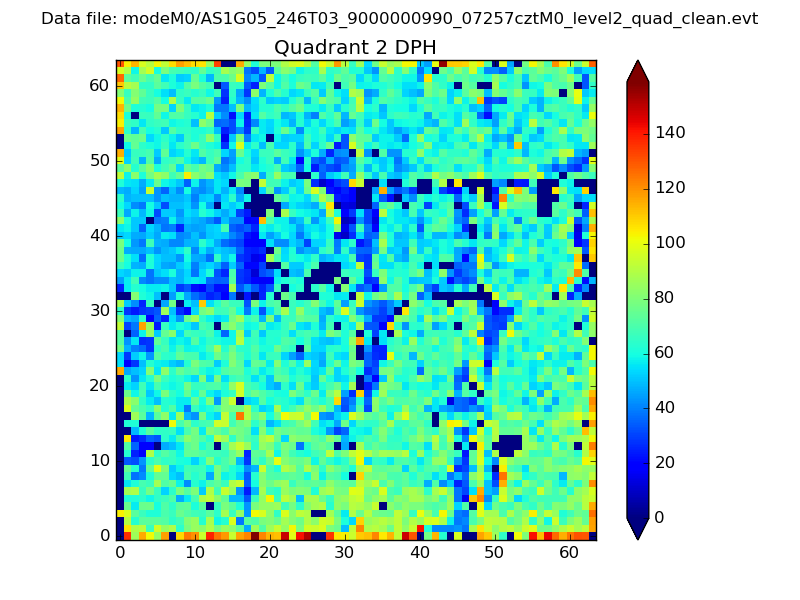 |
Quadrant C |
| Plot type | Count rate plots | Images |
|---|---|---|
| Comparison with Poisson distribution Blue bars denote a histogram of data divided into 1 sec bins. Red curve is a Poisson curve with rate = median count rate of data. |
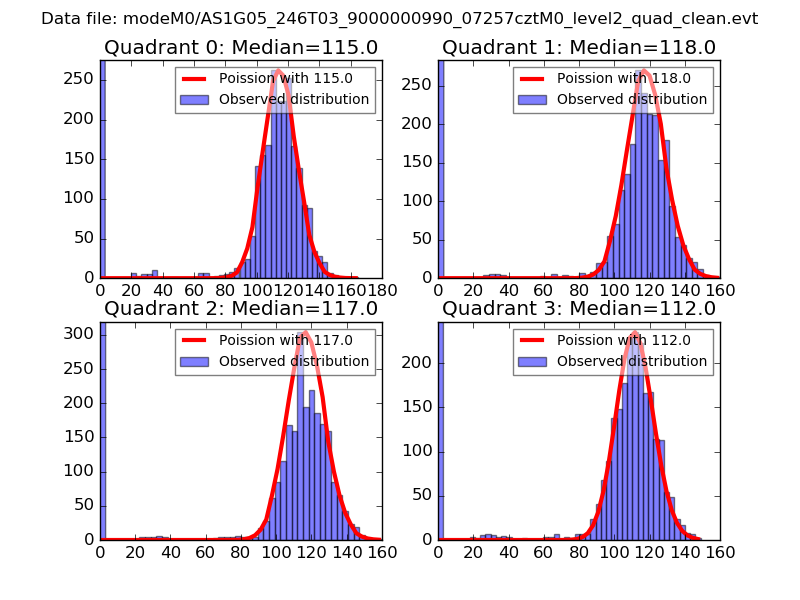 |
 |
| Quadrant-wise count rates Data is divided into 100 sec bins |
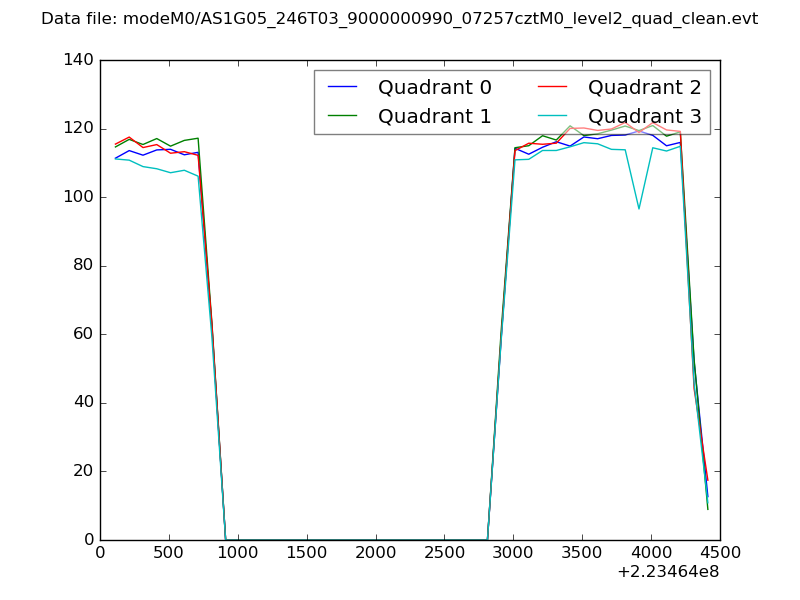 |
|
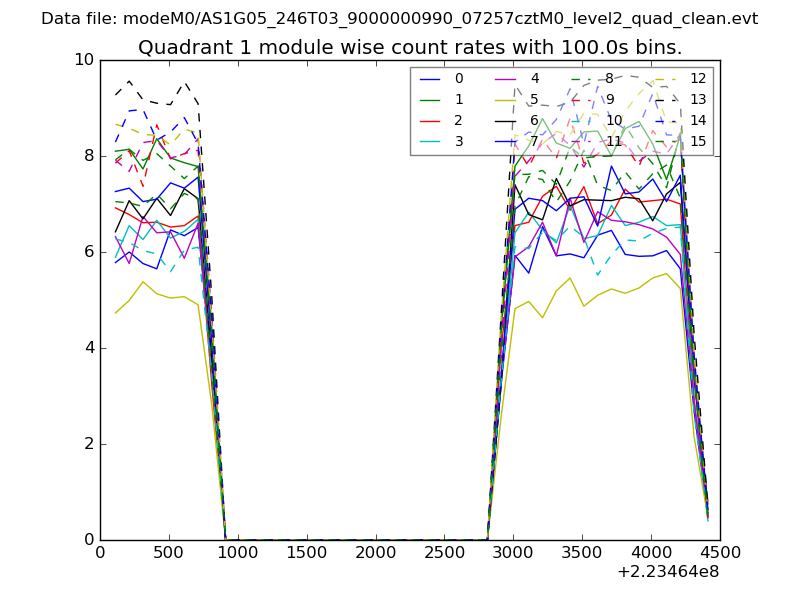
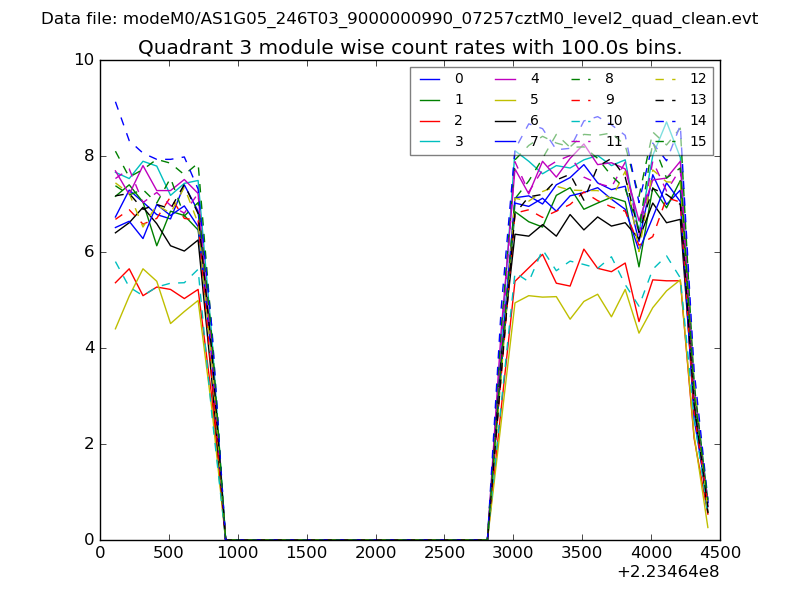
| Module-wise count rates for Quadrant A Data is divided into 100 sec bins |
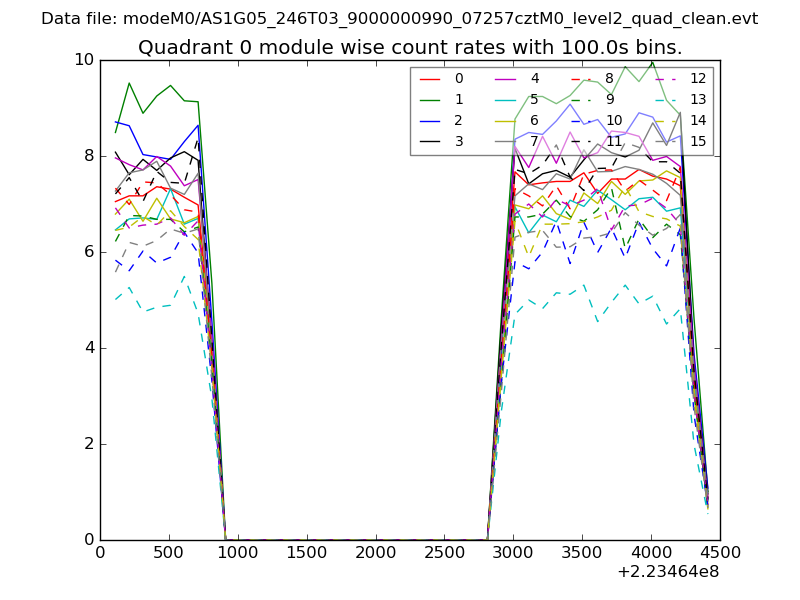 |
 |
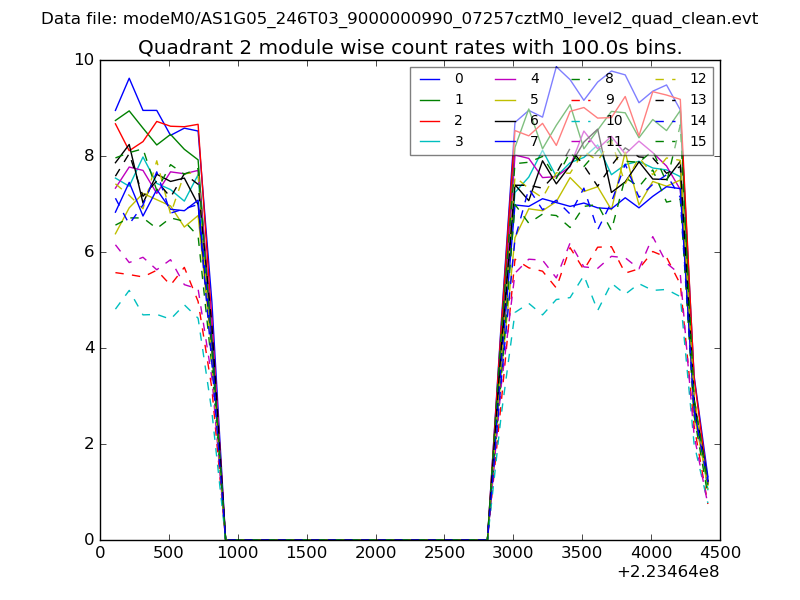
| Module-wise count rates for Quadrant B Data is divided into 100 sec bins |
 |
 |
| Module-wise count rates for Quadrant C Data is divided into 100 sec bins |
 |
 |
| Module-wise count rates for Quadrant D Data is divided into 100 sec bins |
 |
 |
| Parameter | Plot |
|---|---|
| CZT HV Monitor | 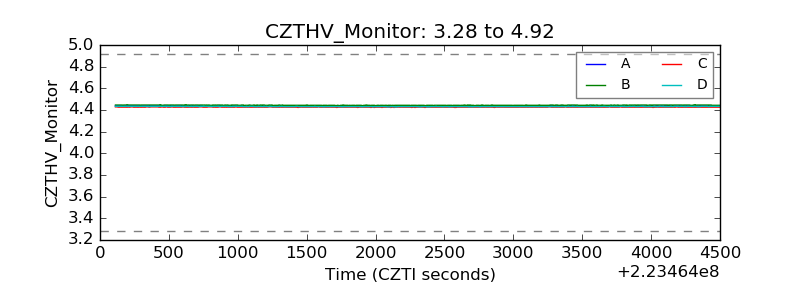 |
| D_VDD | 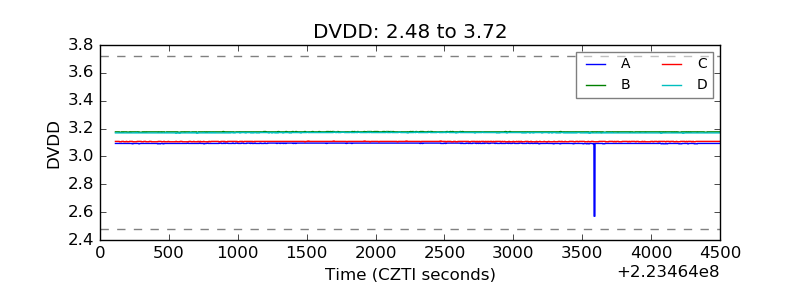 |
| Temperature 1 | 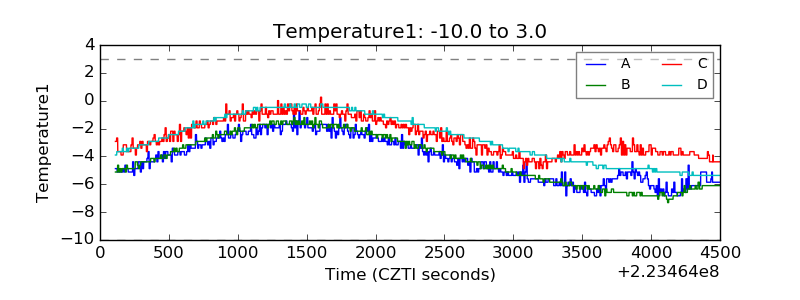 |
| Veto HV Monitor | 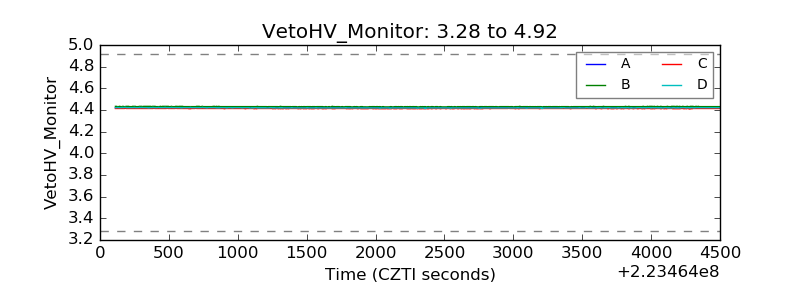 |
| Veto LLD | 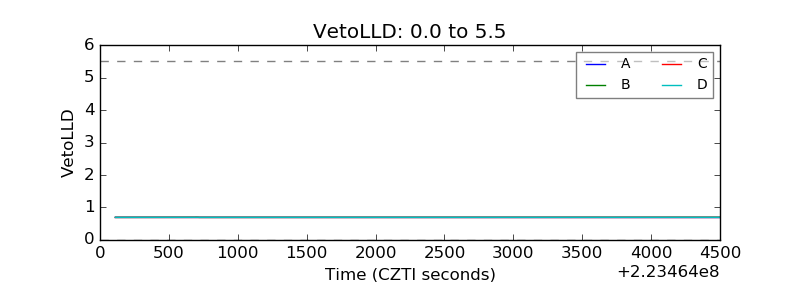 |
| Alpha Counter | 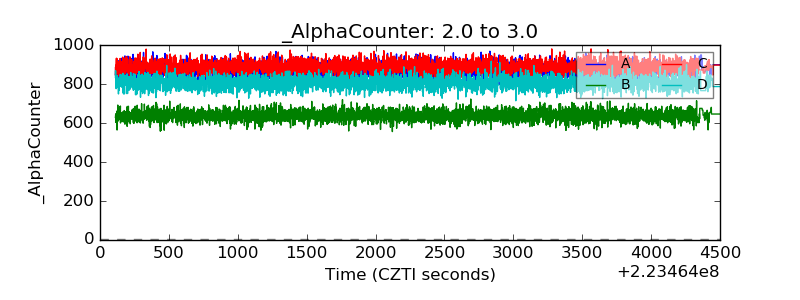 |
| _CPM_Rate | 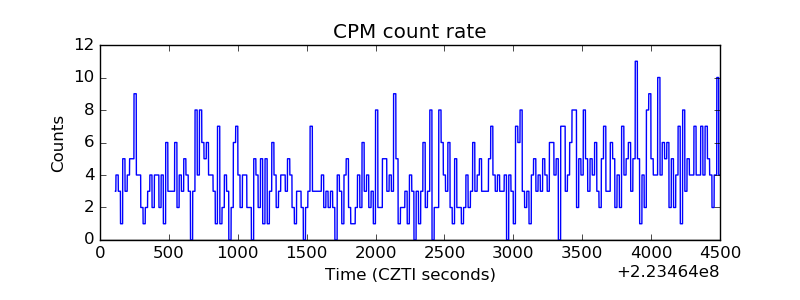 |
| CZT Counter | 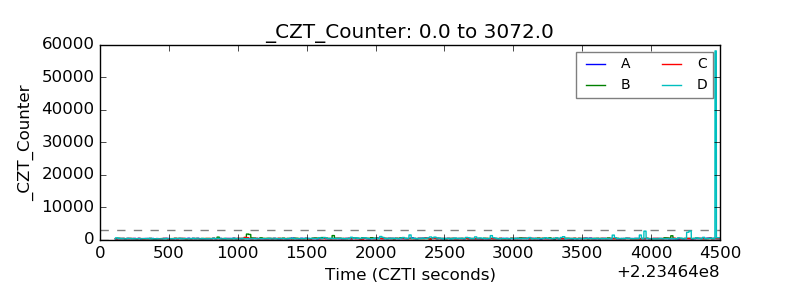 |
| +2.5 Volts monitor | 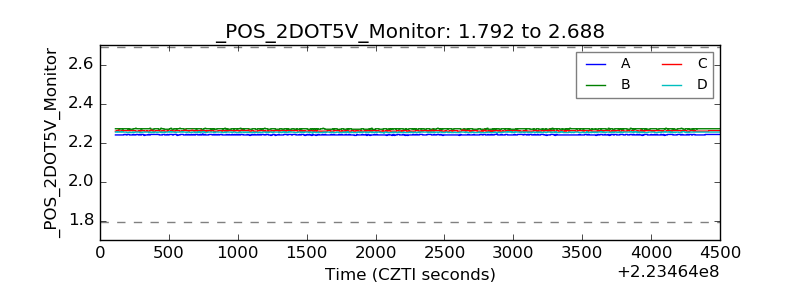 |
| +5 Volts monitor | 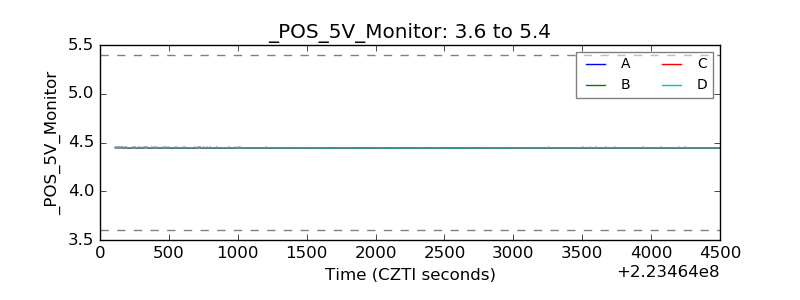 |
| _ROLL_ROT | 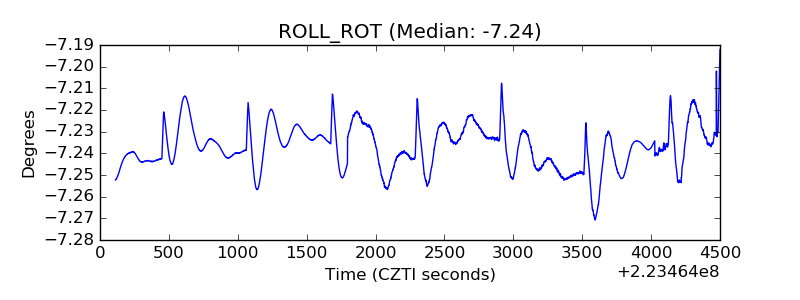 |
| _Roll_DEC | 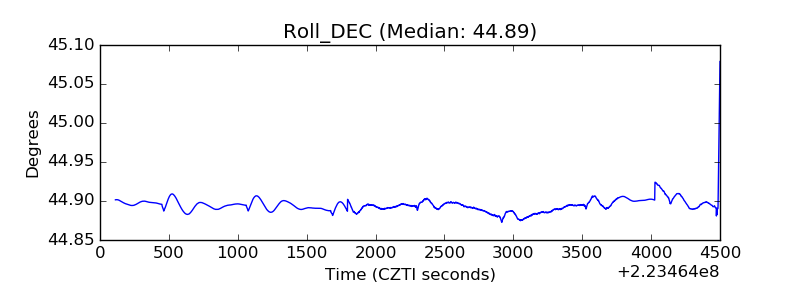 |
| _Roll_RA | 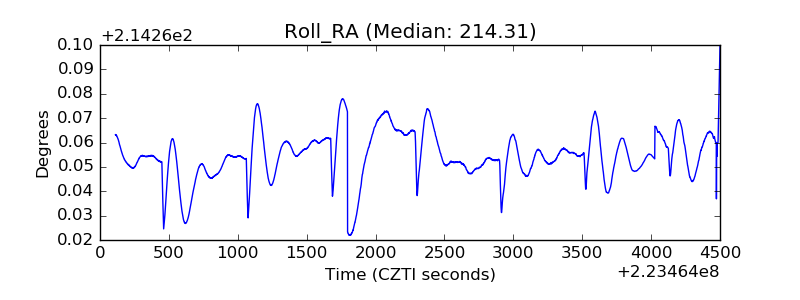 |
| Veto Counter | 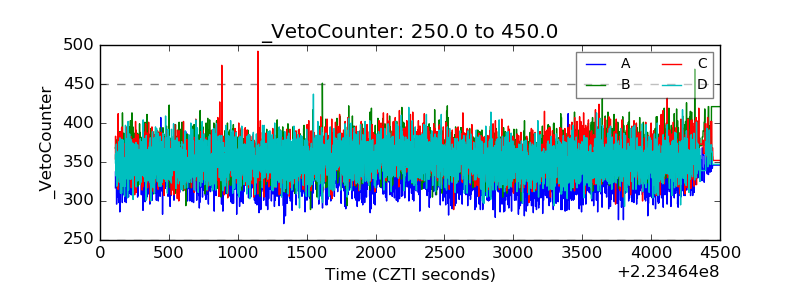 |