| Param | Original file | Final file |
|---|---|---|
| Filename | modeM0/AS1G05_246T03_9000000990_07261cztM0_level2.evt | modeM0/AS1G05_246T03_9000000990_07261cztM0_level2_quad_clean.evt |
| Size (bytes) | 277,361,280 | 45,161,280 |
| Size | 264.5 MB | 43.1 MB |
| Events in quadrant A | 1,902,168 | 266,609 |
| Events in quadrant B | 2,090,348 | 270,975 |
| Events in quadrant C | 1,867,787 | 269,051 |
| Events in quadrant D | 2,244,397 | 256,328 |
| Mode M0 | |||
|---|---|---|---|
| Quadrant | BADHDUFLAG | Total packets | Discarded packets |
| A | 0 | 8667 | 0 |
| B | 0 | 8984 | 0 |
| C | 0 | 8681 | 0 |
| D | 0 | 9785 | 0 |
| Mode SS | |||
|---|---|---|---|
| Quadrant | BADHDUFLAG | Total packets | Discarded packets |
| A | 0 | 86 | 0 |
| B | 0 | 86 | 0 |
| C | 0 | 86 | 0 |
| D | 0 | 86 | 0 |
| Quadrant | Total seconds | Saturated seconds | Saturation percentage |
|---|---|---|---|
| A | 4322 | 2 | 0.046275% |
| B | 4322 | 14 | 0.323924% |
| C | 4322 | 3 | 0.069412% |
| D | 4322 | 57 | 1.318834% |
Noise dominated data is calculated using 1-second bins in cleaned event files. If a bin has >2000 counts, and if more than 50% of those come from <1% of pixels, then it is considered to be noise-dominated and hence unusable.
| Quadrant | # 1 sec bins | Bins with >0 counts | Bins with >2000 counts | High rate bins dominated by noise | Noise dominated (total time) | Noise dominated (detector-on time) | Marked lightcurve |
|---|---|---|---|---|---|---|---|
| A | 4322 | 4322 | 0 | 0 | 0.00% | 0.00% | 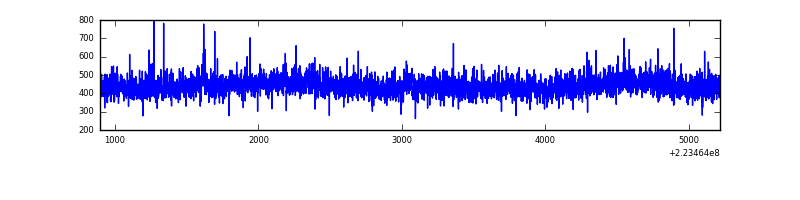 |
| B | 4322 | 4322 | 12 | 12 | 0.28% | 0.28% | 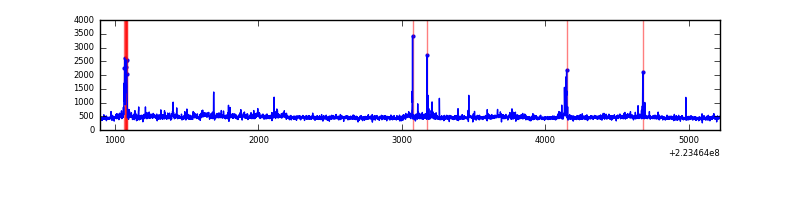 |
| C | 4322 | 4322 | 0 | 0 | 0.00% | 0.00% | 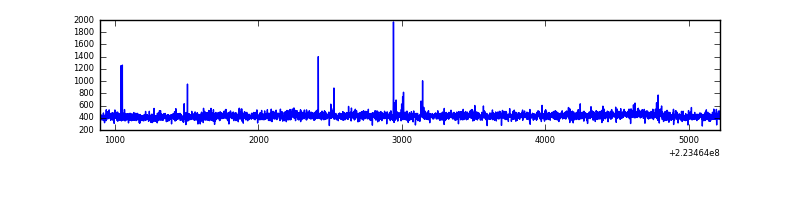 |
| D | 4322 | 4322 | 50 | 50 | 1.16% | 1.16% | 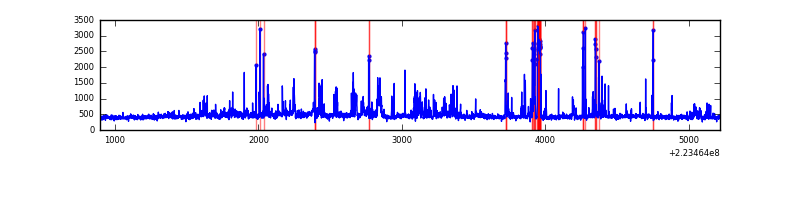 |
Top three noisy pixels from each quadrant. If the there are fewer than three noisy pixels in the level2.evt file, extra rows are filled as -1
| Pixel properties | Quadrant properties | ||||||
|---|---|---|---|---|---|---|---|
| Quadrant | DetID | PixID | Counts | Sigma | Mean | Median | Sigma |
| A | 8 | 15 | 12763 | 121.88 | 484 | 474 | 100.8 |
| A | 3 | 1 | 12099 | 115.3 | 484 | 474 | 100.8 |
| A | 13 | 14 | 6797 | 62.71 | 484 | 474 | 100.8 |
| B | 0 | 214 | 73002 | 761.28 | 489 | 476 | 95.3 |
| B | 4 | 239 | 38395 | 398.02 | 489 | 476 | 95.3 |
| B | 0 | 228 | 29422 | 303.84 | 489 | 476 | 95.3 |
| C | 10 | 22 | 8333 | 70.28 | 474 | 477 | 111.8 |
| C | 9 | 68 | 5710 | 46.82 | 474 | 477 | 111.8 |
| C | 13 | 61 | 3852 | 30.19 | 474 | 477 | 111.8 |
| D | 2 | 14 | 205171 | 1752.3 | 467 | 452 | 116.8 |
| D | 2 | 216 | 200739 | 1714.36 | 467 | 452 | 116.8 |
| D | 2 | 33 | 61394 | 521.64 | 467 | 452 | 116.8 |
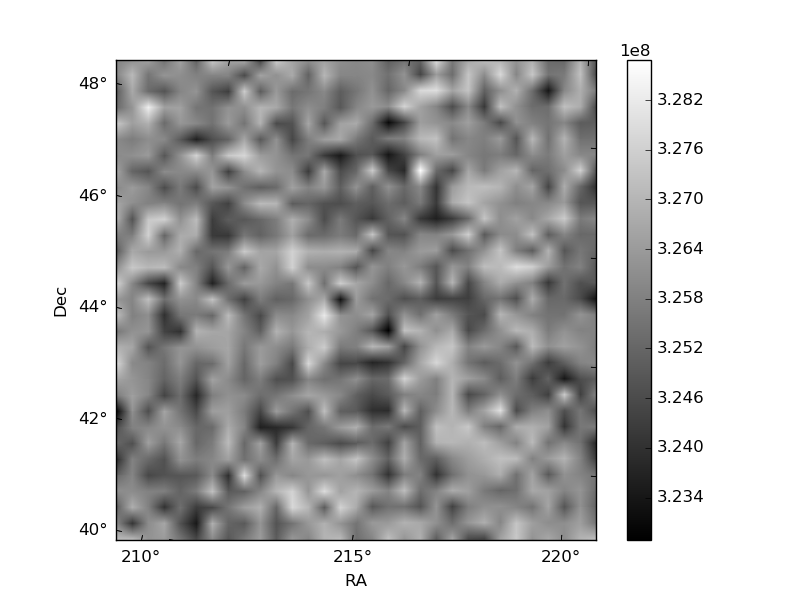
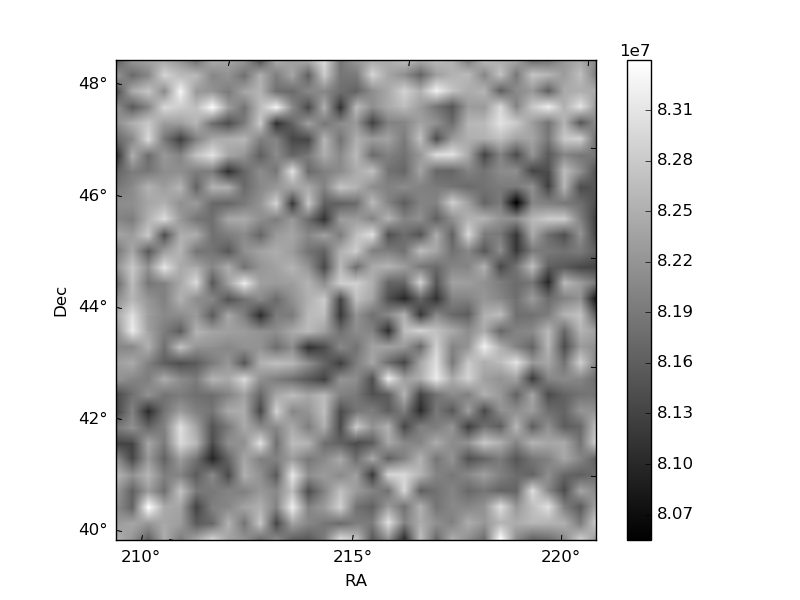
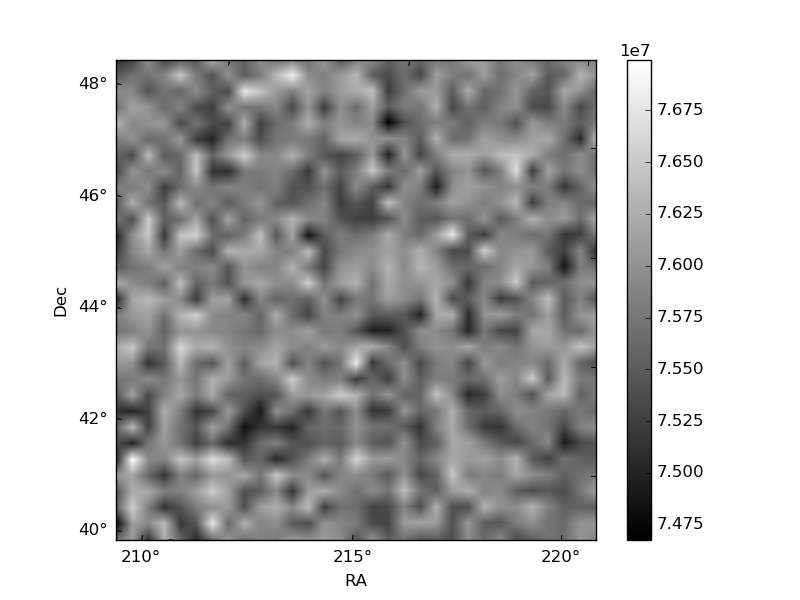
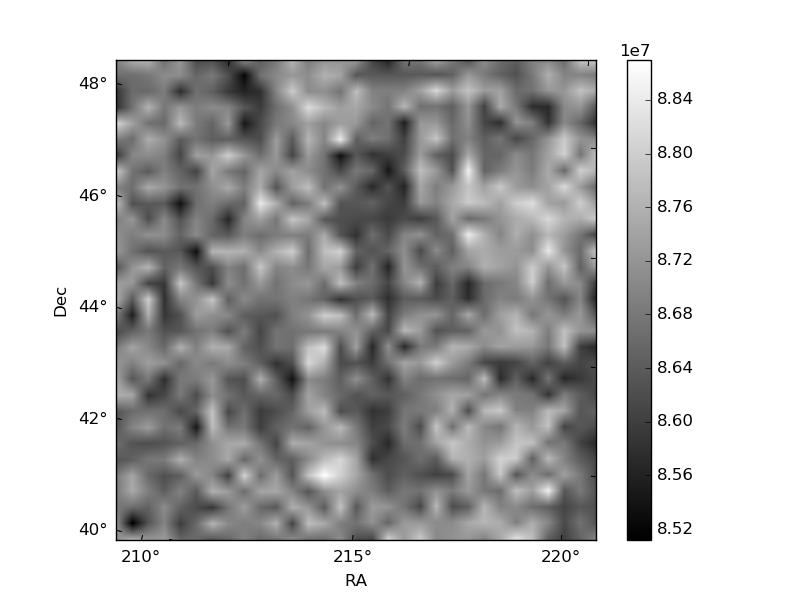
Histogram calculated using DETX and DETY for each event in the final _common_clean file
| Quadrant A | 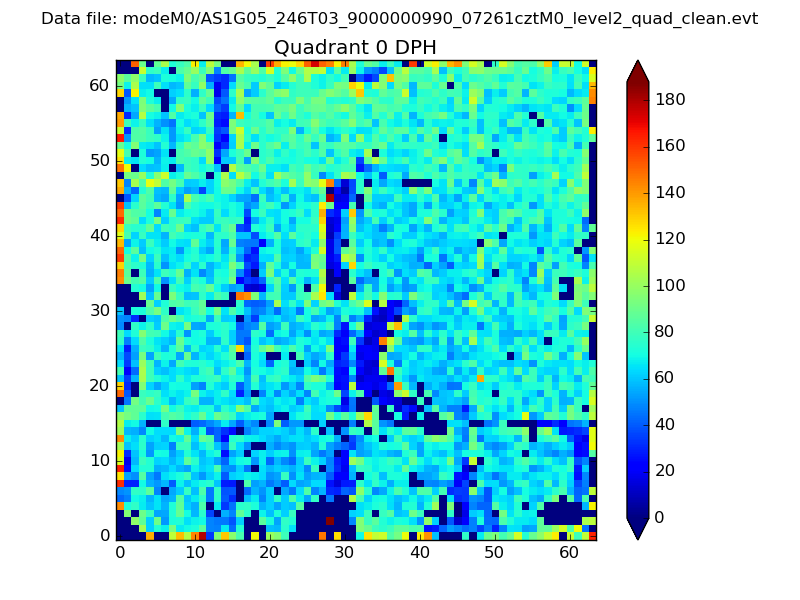 |
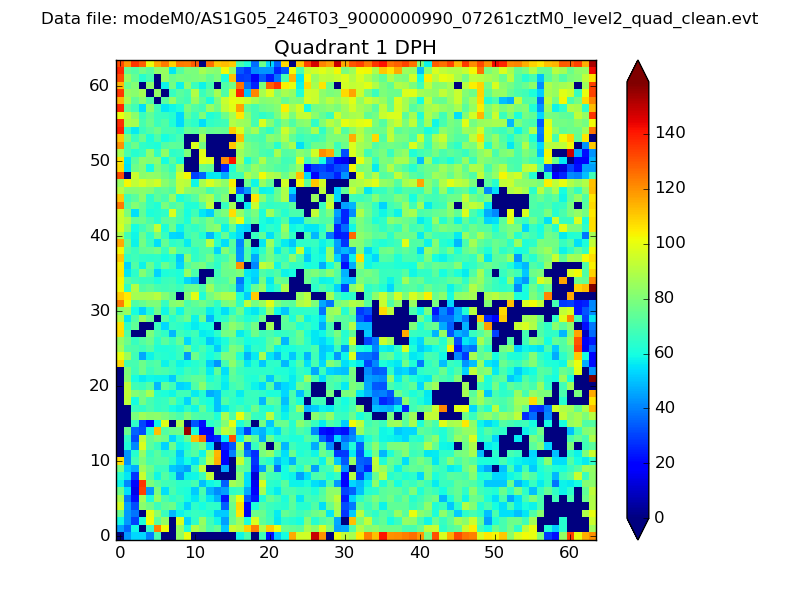 |
Quadrant B |
|---|---|---|---|
| Quadrant D | 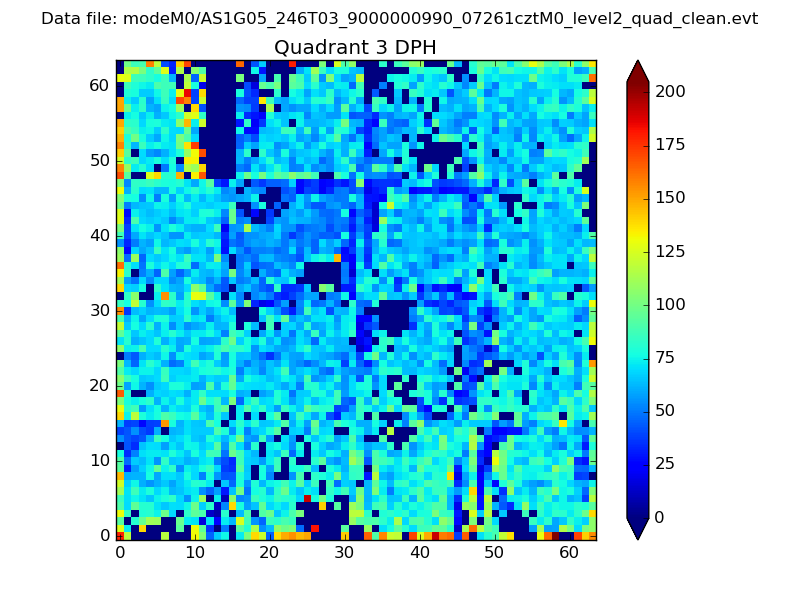 |
 |
Quadrant C |
| Plot type | Count rate plots | Images |
|---|---|---|
| Comparison with Poisson distribution Blue bars denote a histogram of data divided into 1 sec bins. Red curve is a Poisson curve with rate = median count rate of data. |
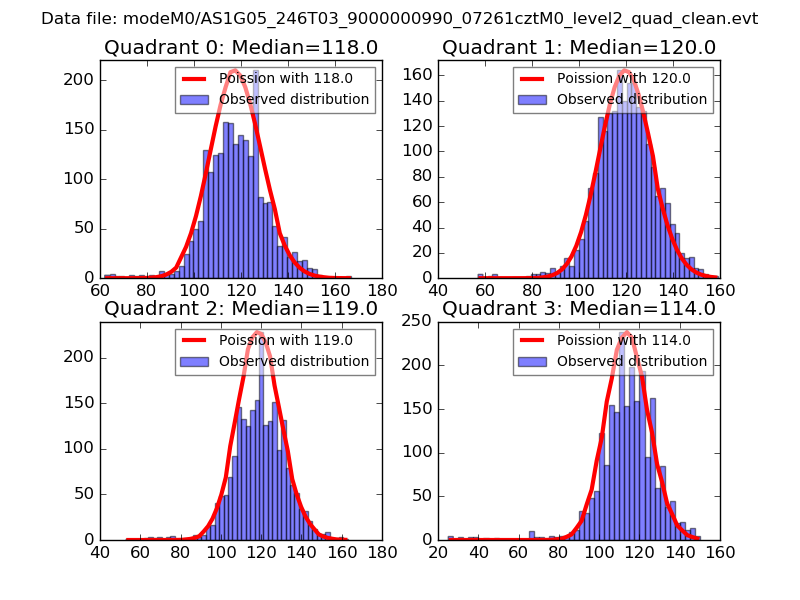 |
 |
| Quadrant-wise count rates Data is divided into 100 sec bins |
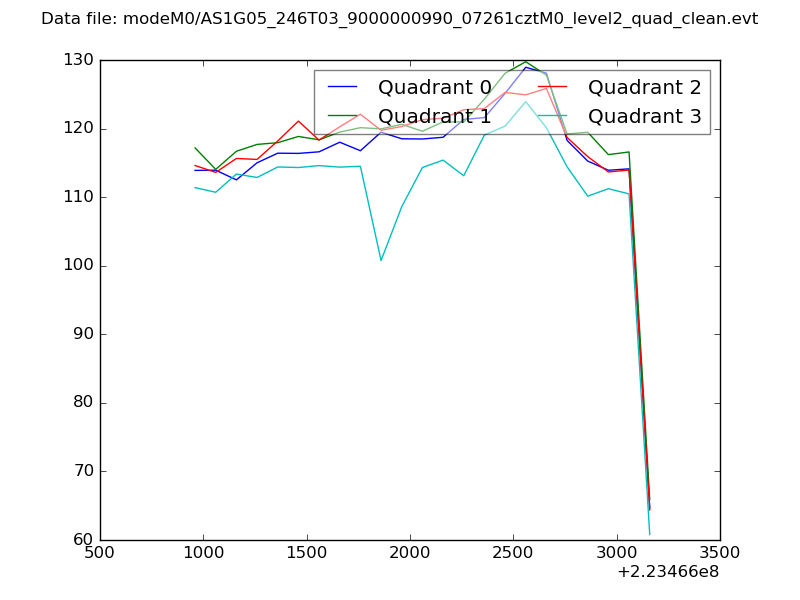 |
|
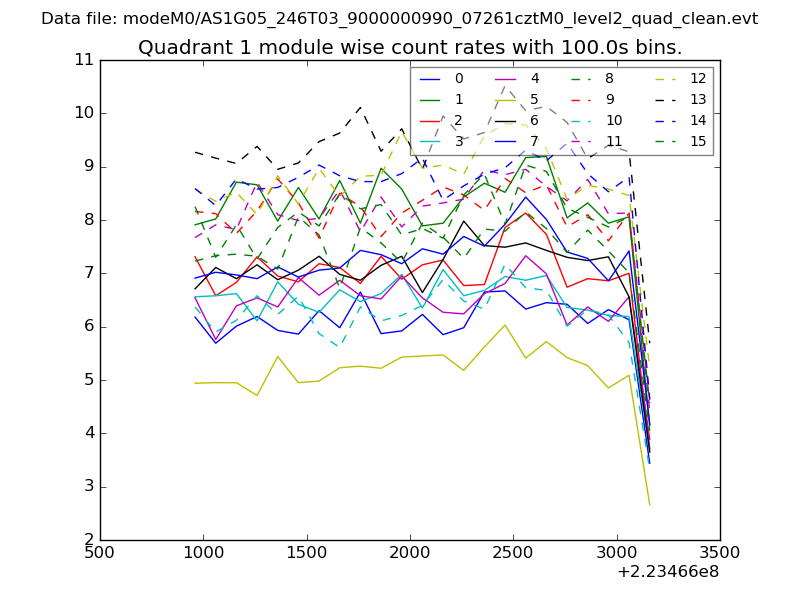
| Module-wise count rates for Quadrant A Data is divided into 100 sec bins |
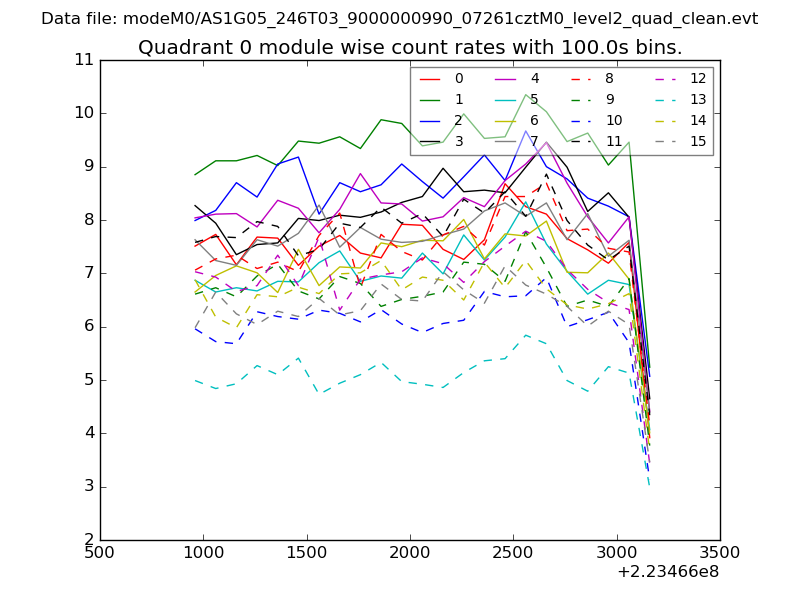 |
 |
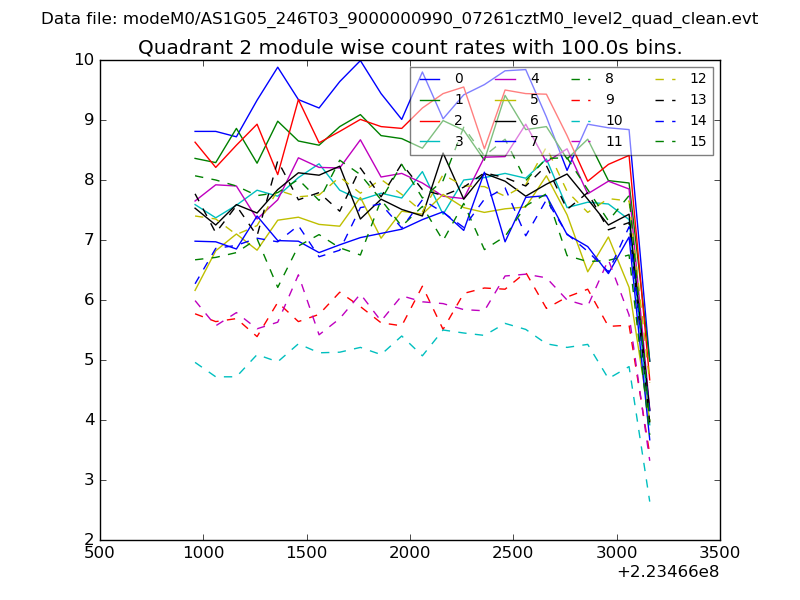
| Module-wise count rates for Quadrant B Data is divided into 100 sec bins |
 |
 |
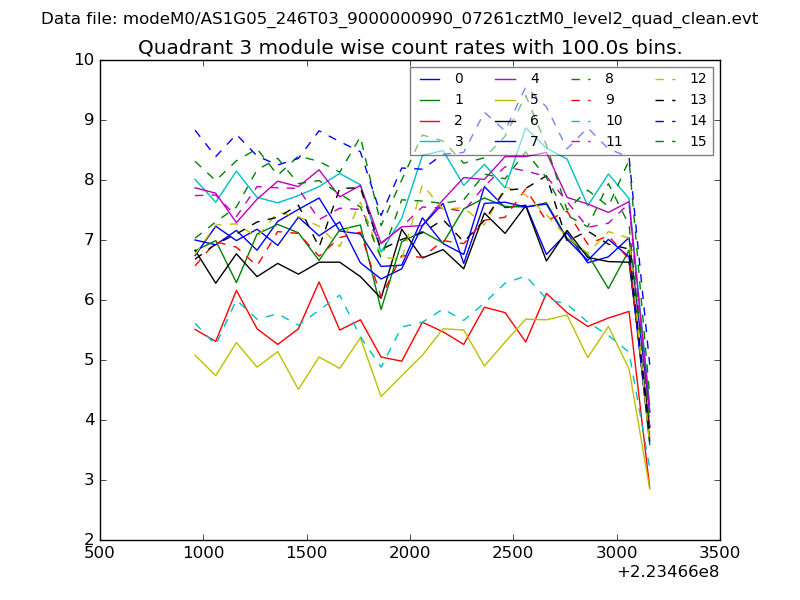
| Module-wise count rates for Quadrant C Data is divided into 100 sec bins |
 |
 |
| Module-wise count rates for Quadrant D Data is divided into 100 sec bins |
 |
 |
| Parameter | Plot |
|---|---|
| CZT HV Monitor | 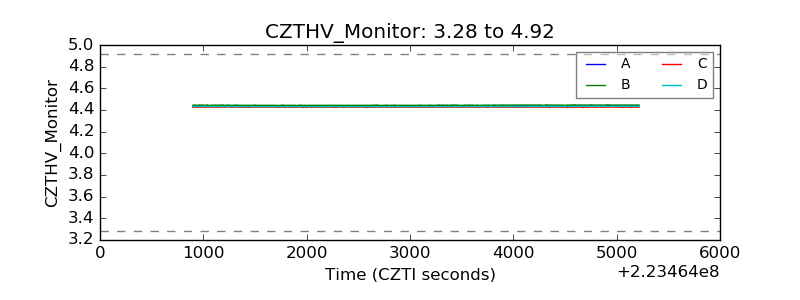 |
| D_VDD | 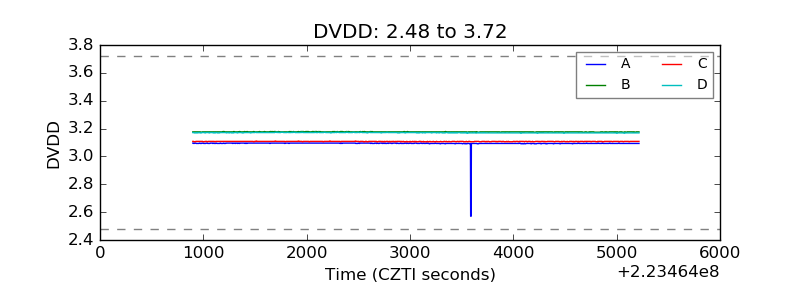 |
| Temperature 1 | 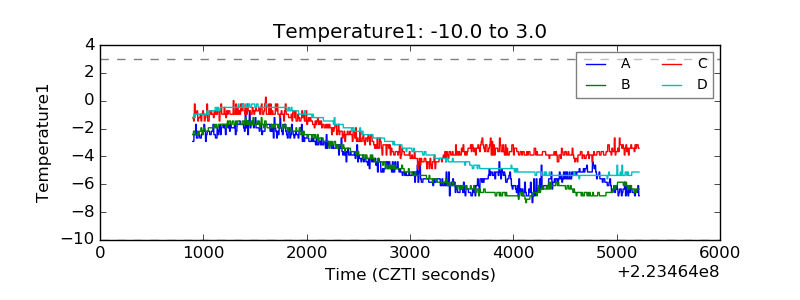 |
| Veto HV Monitor | 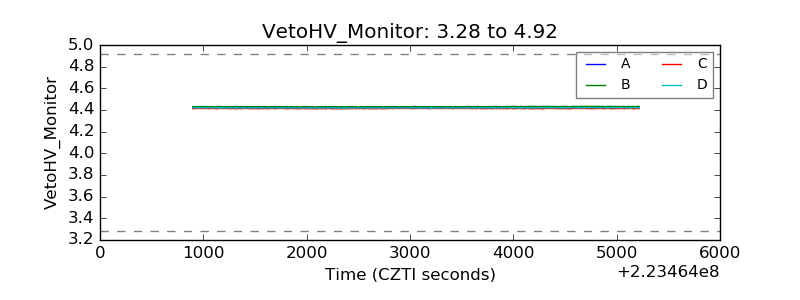 |
| Veto LLD | 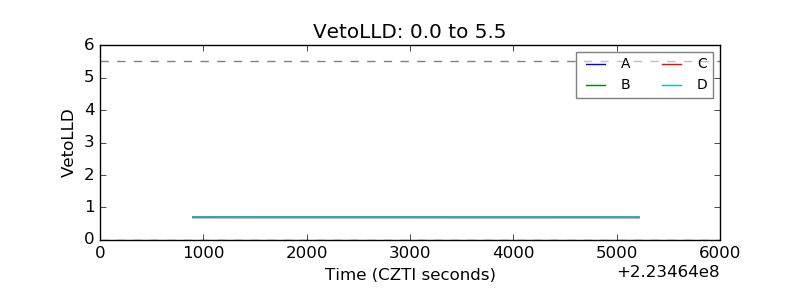 |
| Alpha Counter | 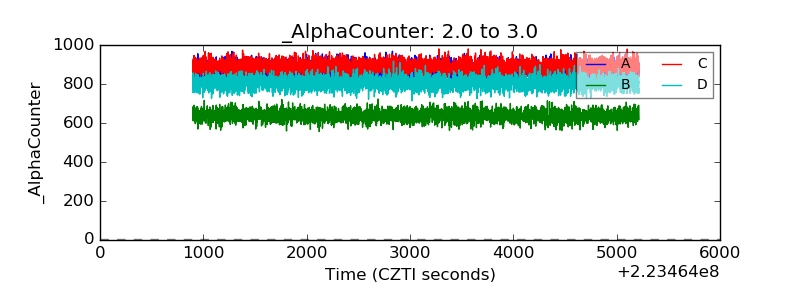 |
| _CPM_Rate | 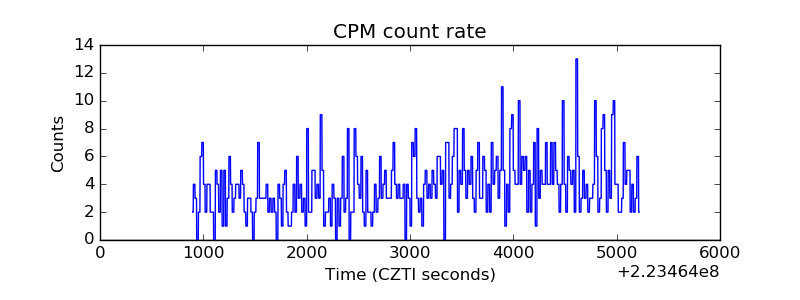 |
| CZT Counter | 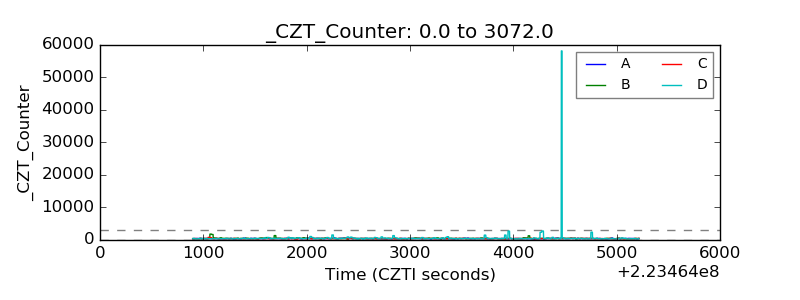 |
| +2.5 Volts monitor |  |
| +5 Volts monitor |  |
| _ROLL_ROT | 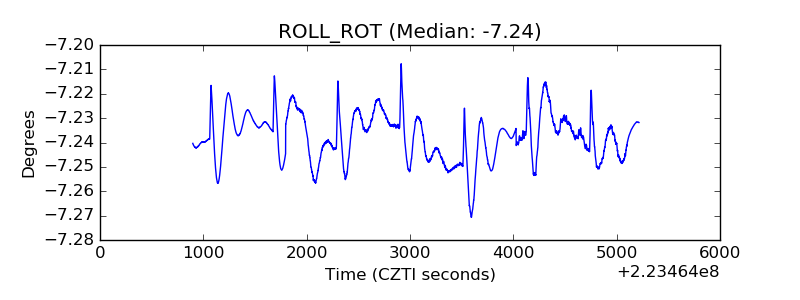 |
| _Roll_DEC | 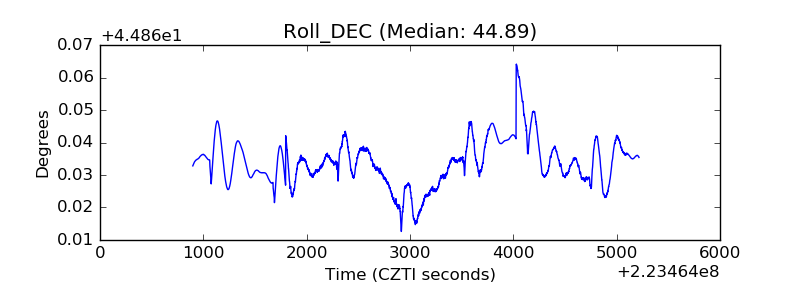 |
| _Roll_RA | 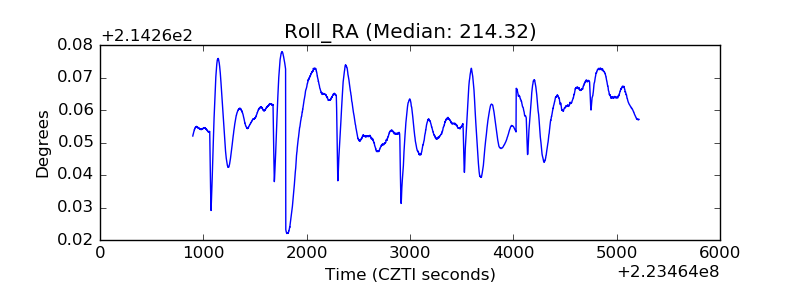 |
| Veto Counter | 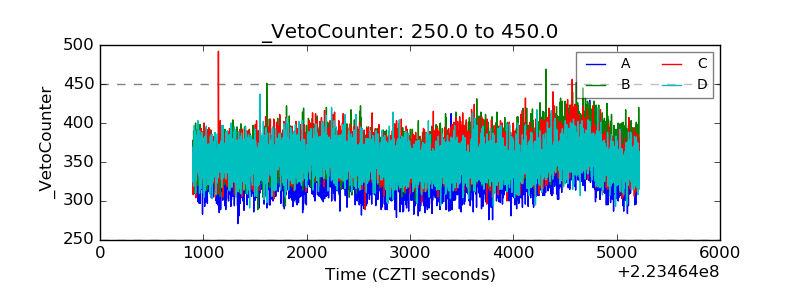 |