| Param | Original file | Final file |
|---|---|---|
| Filename | modeM0/AS1G06_036T01_9000000988_07223cztM0_level2.evt | modeM0/AS1G06_036T01_9000000988_07223cztM0_level2_quad_clean.evt |
| Size (bytes) | 360,967,680 | 51,816,960 |
| Size | 344.2 MB | 49.4 MB |
| Events in quadrant A | 2,428,353 | 302,258 |
| Events in quadrant B | 2,577,036 | 313,701 |
| Events in quadrant C | 2,379,446 | 312,629 |
| Events in quadrant D | 3,209,672 | 292,295 |
| Mode M9 | |||
|---|---|---|---|
| Quadrant | BADHDUFLAG | Total packets | Discarded packets |
| A | 0 | 13 | 0 |
| B | 0 | 13 | 0 |
| C | 0 | 13 | 0 |
| D | 0 | 13 | 0 |
| Mode M0 | |||
|---|---|---|---|
| Quadrant | BADHDUFLAG | Total packets | Discarded packets |
| A | 0 | 10374 | 2 |
| B | 0 | 10862 | 1 |
| C | 0 | 10252 | 1 |
| D | 0 | 12884 | 1 |
| Mode SS | |||
|---|---|---|---|
| Quadrant | BADHDUFLAG | Total packets | Discarded packets |
| A | 0 | 100 | 0 |
| B | 0 | 100 | 0 |
| C | 0 | 100 | 0 |
| D | 0 | 100 | 0 |
| Quadrant | Total seconds | Saturated seconds | Saturation percentage |
|---|---|---|---|
| A | 4960 | 35 | 0.705645% |
| B | 4960 | 41 | 0.826613% |
| C | 4960 | 31 | 0.625000% |
| D | 4960 | 119 | 2.399194% |
Noise dominated data is calculated using 1-second bins in cleaned event files. If a bin has >2000 counts, and if more than 50% of those come from <1% of pixels, then it is considered to be noise-dominated and hence unusable.
| Quadrant | # 1 sec bins | Bins with >0 counts | Bins with >2000 counts | High rate bins dominated by noise | Noise dominated (total time) | Noise dominated (detector-on time) | Marked lightcurve |
|---|---|---|---|---|---|---|---|
| A | 6255 | 4961 | 2 | 2 | 0.03% | 0.04% | 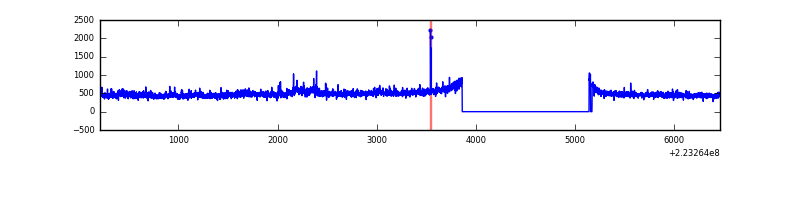 |
| B | 6255 | 4962 | 7 | 7 | 0.11% | 0.14% | 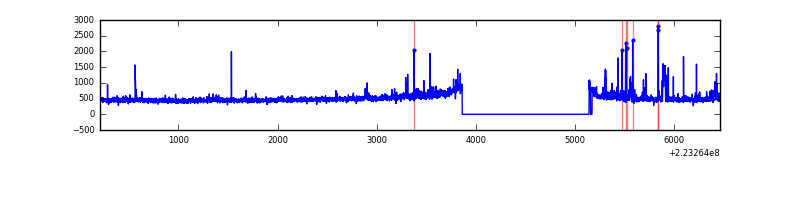 |
| C | 6255 | 4961 | 0 | 0 | 0.00% | 0.00% | 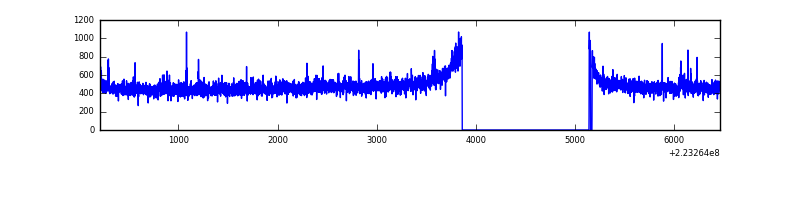 |
| D | 6255 | 4962 | 72 | 72 | 1.15% | 1.45% | 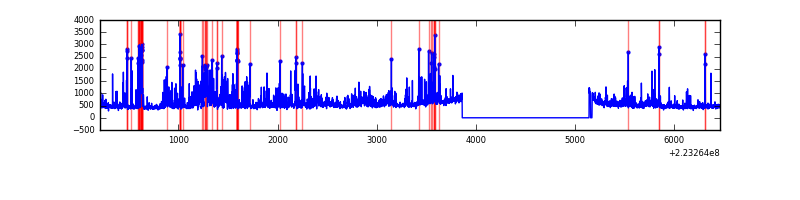 |
Top three noisy pixels from each quadrant. If the there are fewer than three noisy pixels in the level2.evt file, extra rows are filled as -1
| Pixel properties | Quadrant properties | ||||||
|---|---|---|---|---|---|---|---|
| Quadrant | DetID | PixID | Counts | Sigma | Mean | Median | Sigma |
| A | 8 | 15 | 96638 | 779.67 | 599 | 588 | 123.2 |
| A | 15 | 174 | 12479 | 96.52 | 599 | 588 | 123.2 |
| A | 3 | 1 | 9465 | 72.06 | 599 | 588 | 123.2 |
| B | 10 | 16 | 84067 | 711.01 | 612 | 598 | 117.4 |
| B | 0 | 214 | 79001 | 667.85 | 612 | 598 | 117.4 |
| B | 4 | 81 | 15485 | 126.81 | 612 | 598 | 117.4 |
| C | 9 | 68 | 47700 | 334.57 | 596 | 599 | 140.8 |
| C | 13 | 61 | 4667 | 28.9 | 596 | 599 | 140.8 |
| C | 12 | 4 | 3994 | 24.12 | 596 | 599 | 140.8 |
| D | 2 | 216 | 627635 | 4375.08 | 584 | 567 | 143.3 |
| D | 12 | 233 | 120625 | 837.65 | 584 | 567 | 143.3 |
| D | 2 | 63 | 77996 | 540.23 | 584 | 567 | 143.3 |
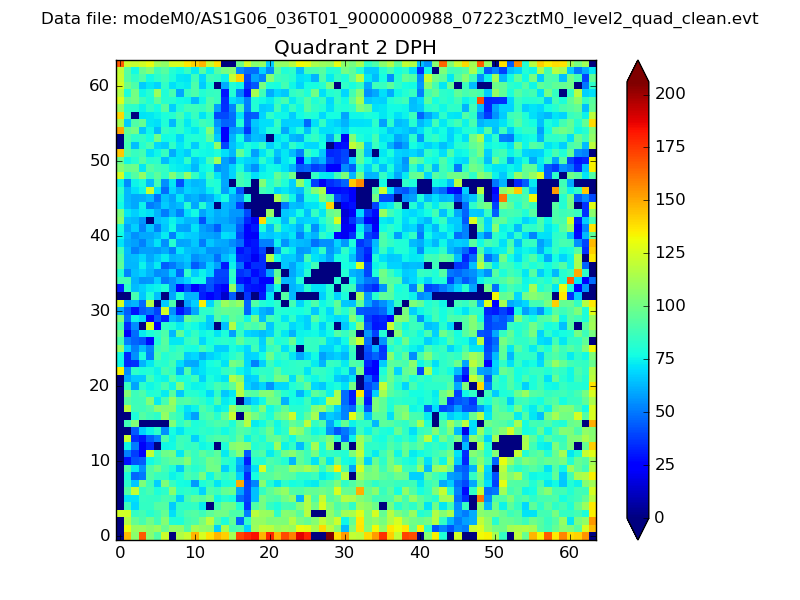
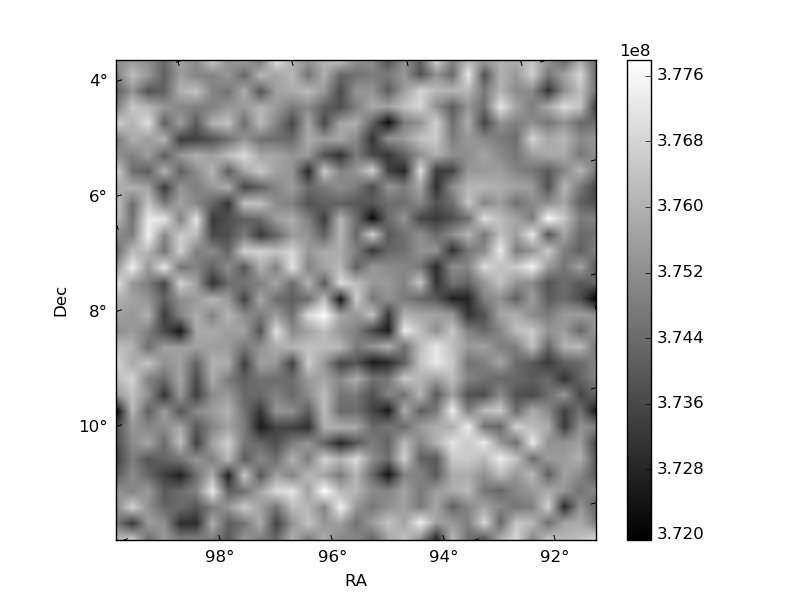
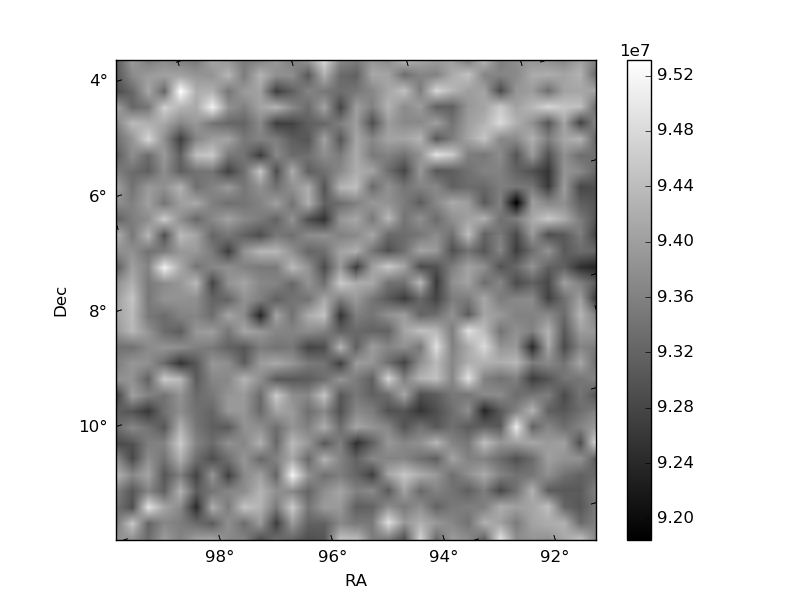
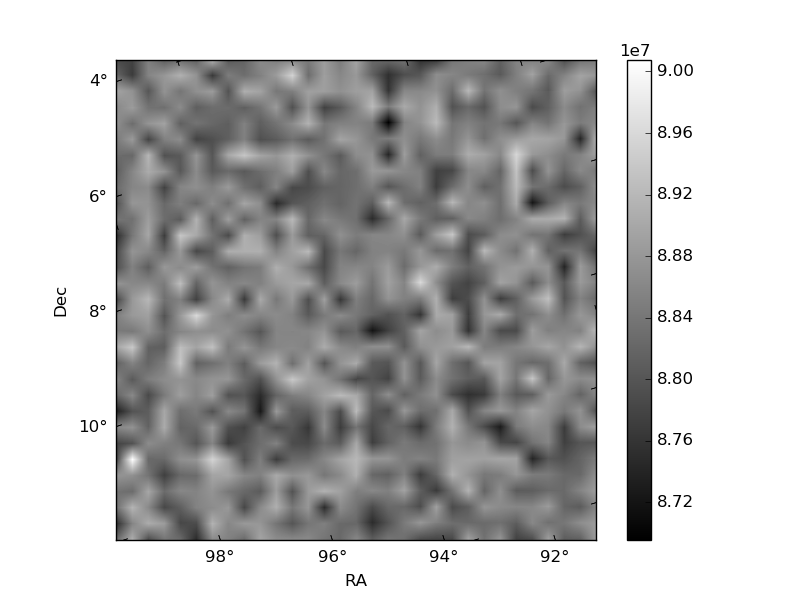
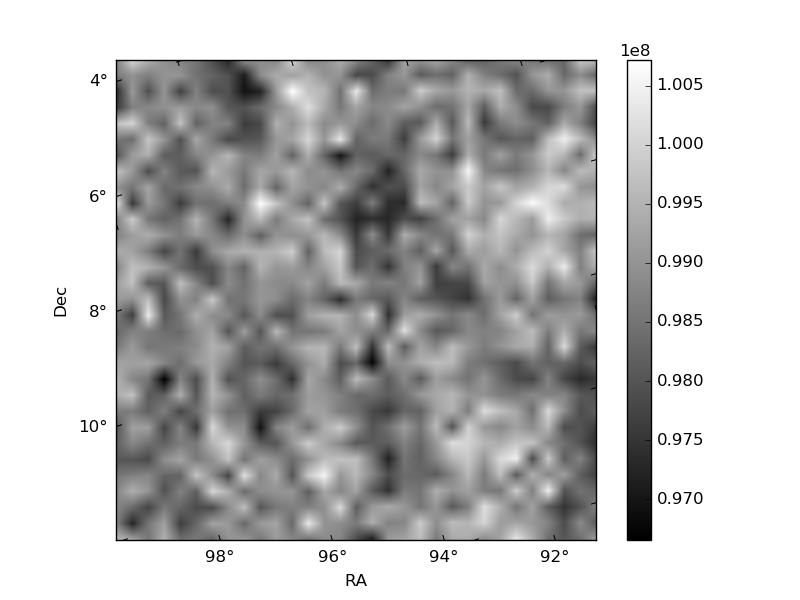
Histogram calculated using DETX and DETY for each event in the final _common_clean file
| Quadrant A | 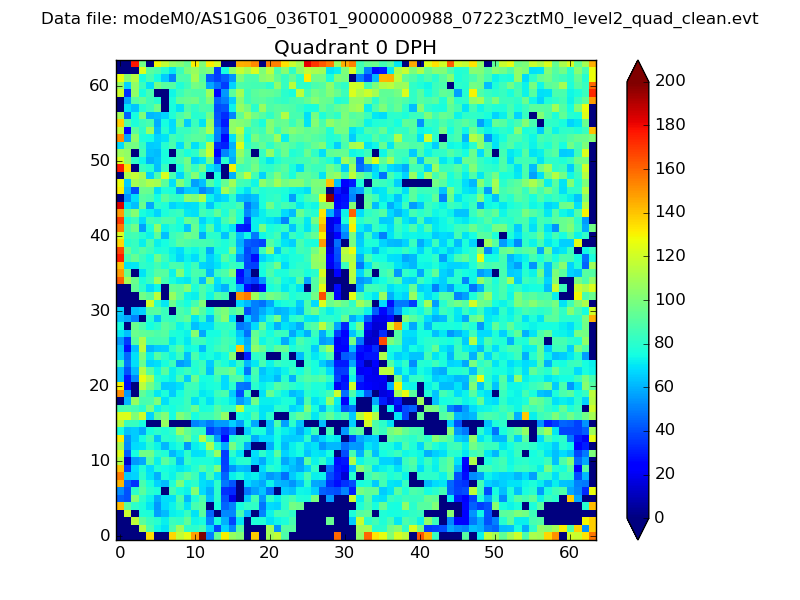 |
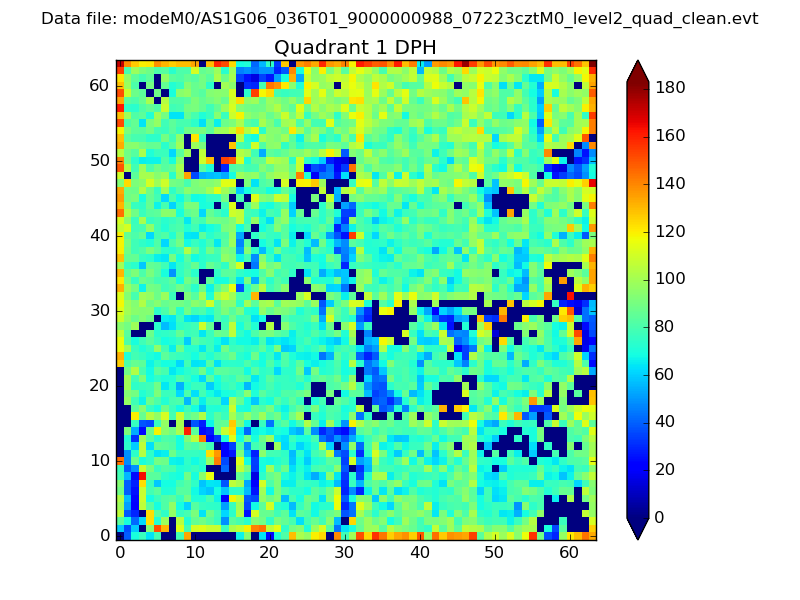 |
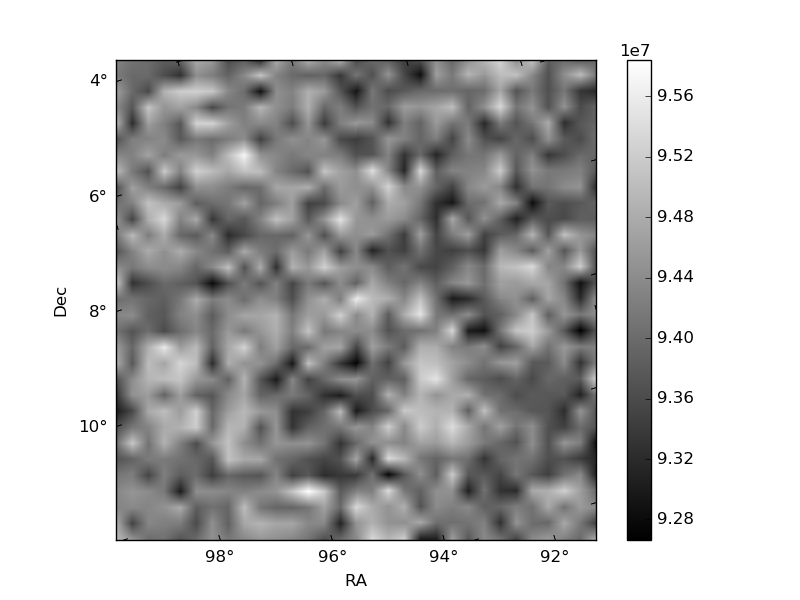
Quadrant B |
|---|---|---|---|
| Quadrant D | 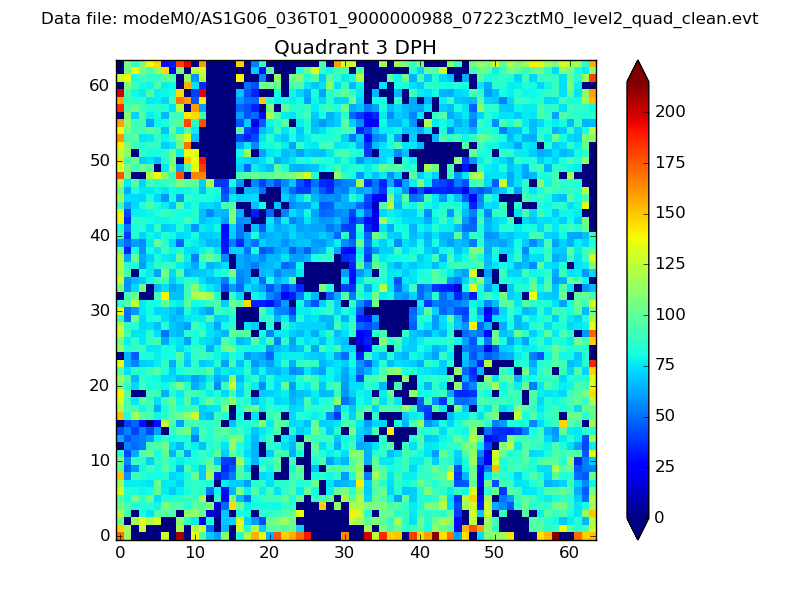 |
 |
Quadrant C |
| Plot type | Count rate plots | Images |
|---|---|---|
| Comparison with Poisson distribution Blue bars denote a histogram of data divided into 1 sec bins. Red curve is a Poisson curve with rate = median count rate of data. |
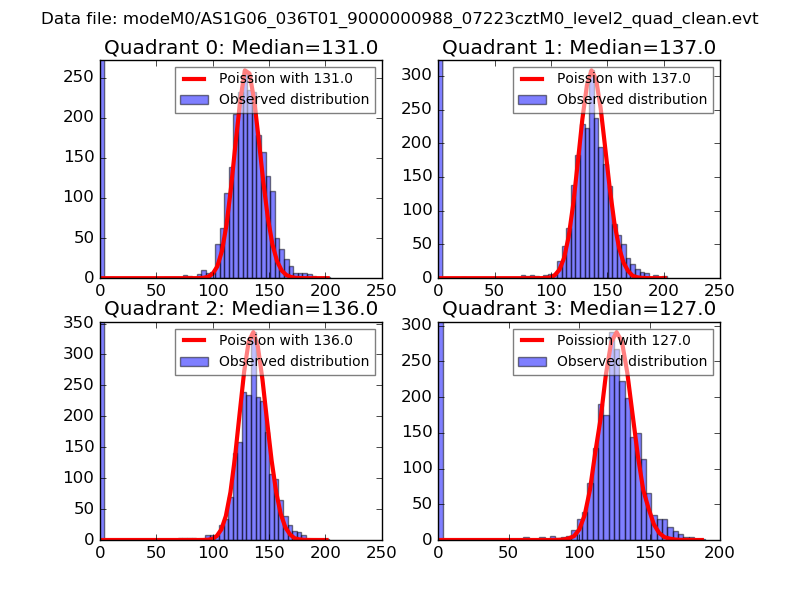 |
 |
| Quadrant-wise count rates Data is divided into 100 sec bins |
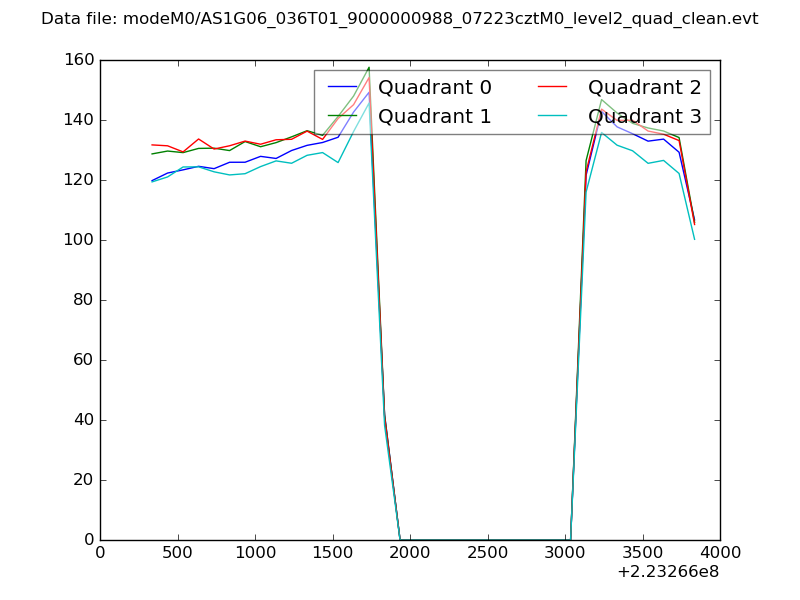 |
|
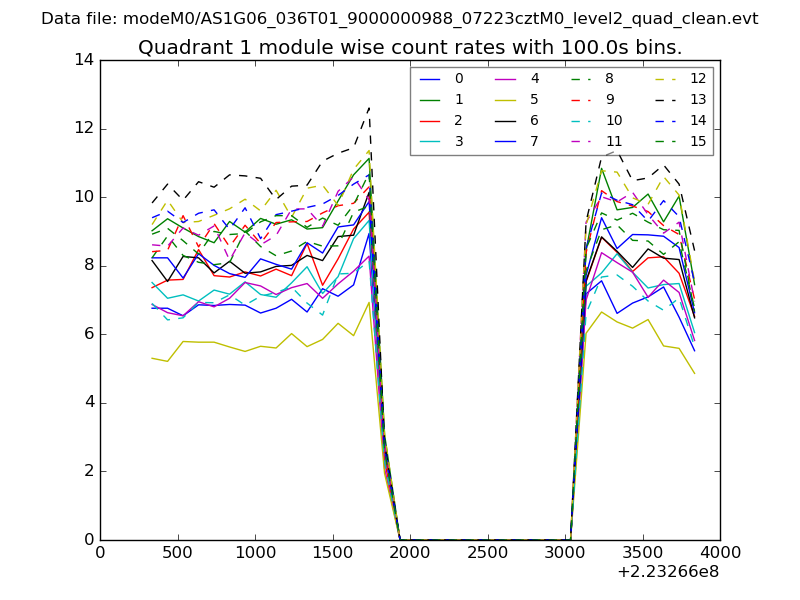
| Module-wise count rates for Quadrant A Data is divided into 100 sec bins |
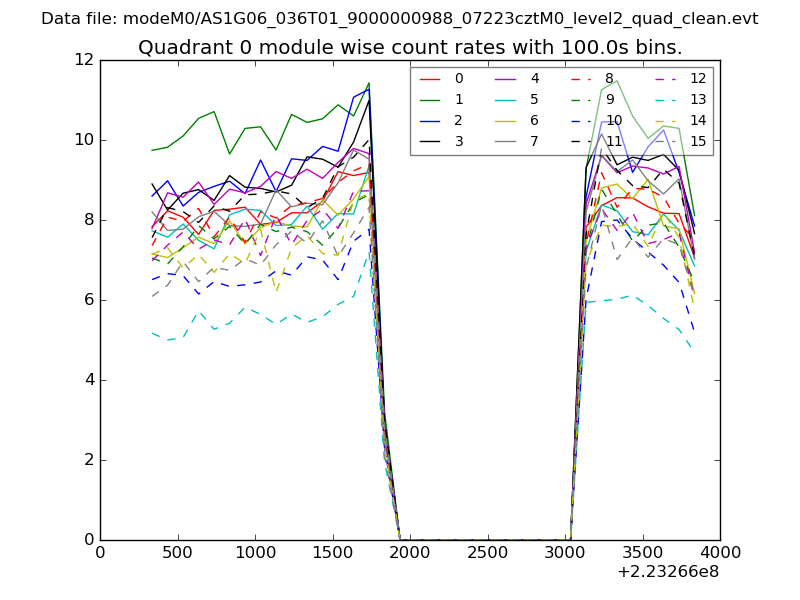 |
 |
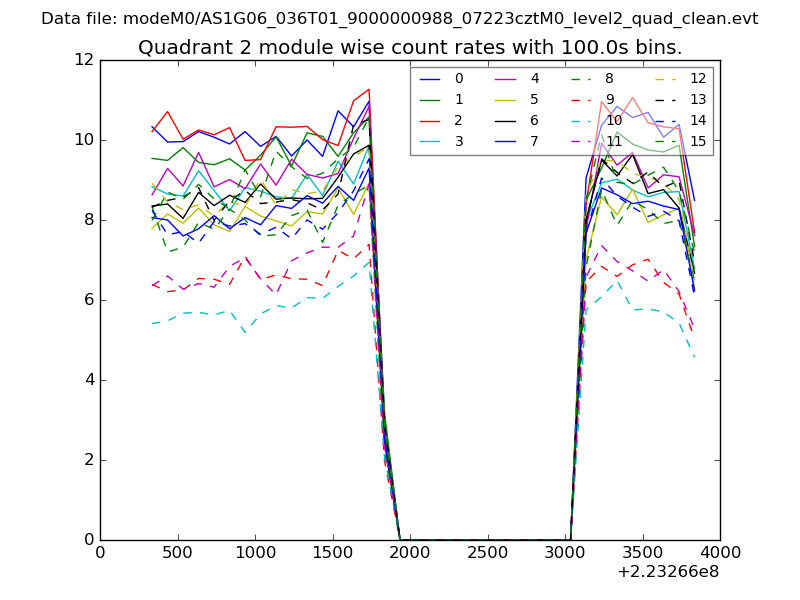
| Module-wise count rates for Quadrant B Data is divided into 100 sec bins |
 |
 |
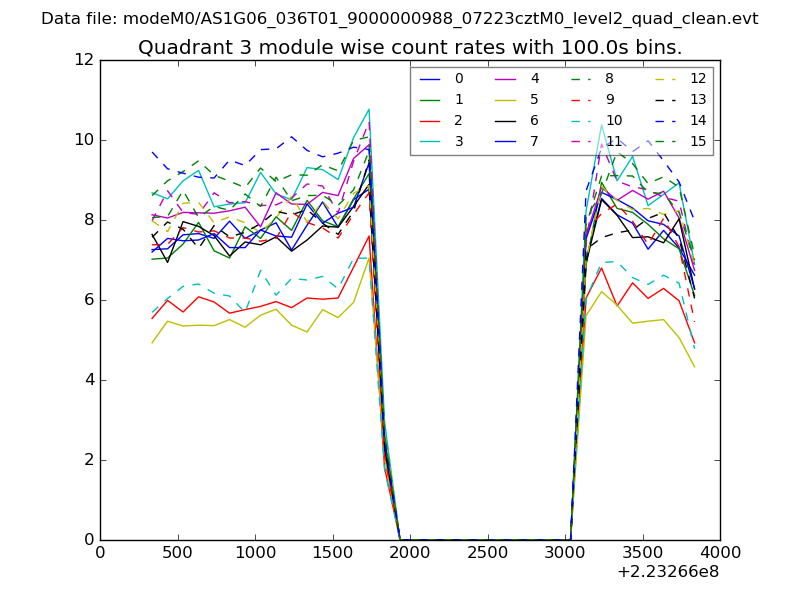
| Module-wise count rates for Quadrant C Data is divided into 100 sec bins |
 |
 |
| Module-wise count rates for Quadrant D Data is divided into 100 sec bins |
 |
 |
| Parameter | Plot |
|---|---|
| CZT HV Monitor | 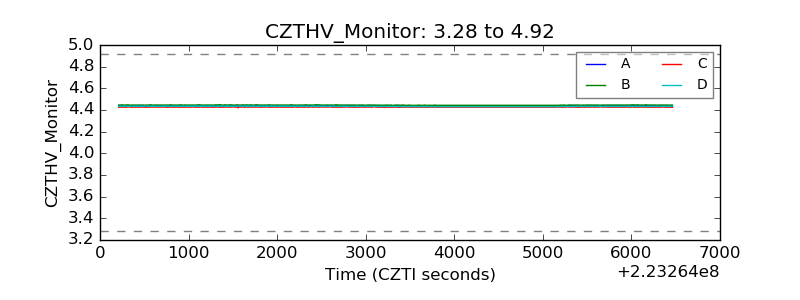 |
| D_VDD | 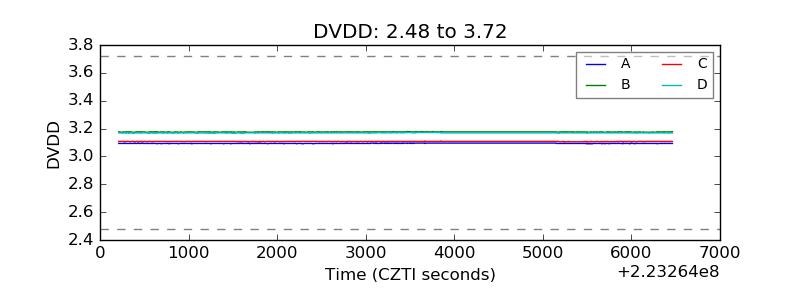 |
| Temperature 1 |  |
| Veto HV Monitor | 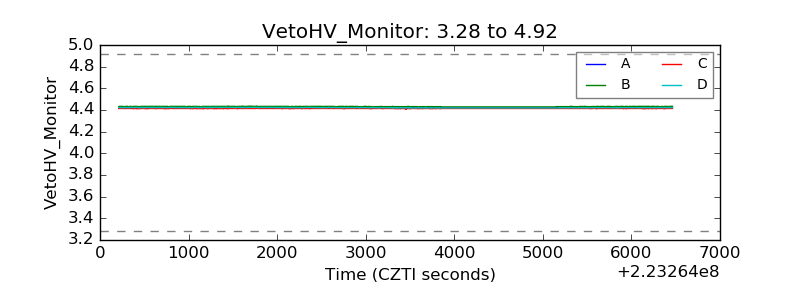 |
| Veto LLD |  |
| Alpha Counter | 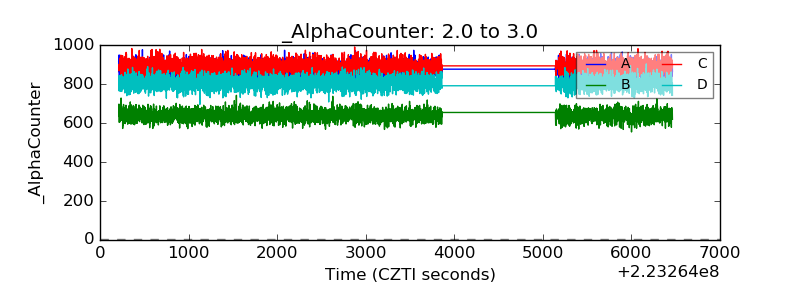 |
| _CPM_Rate | 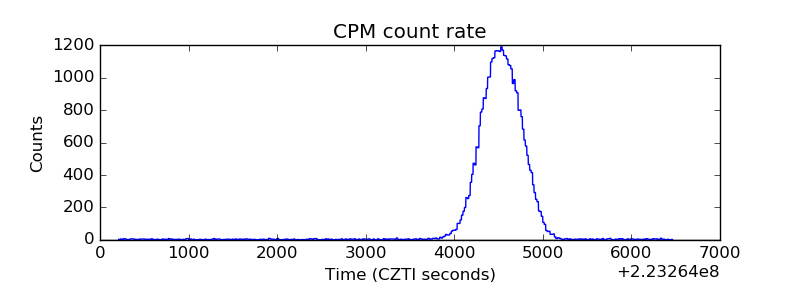 |
| CZT Counter | 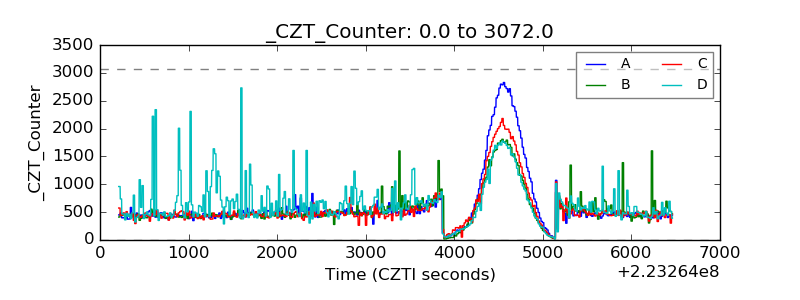 |
| +2.5 Volts monitor |  |
| +5 Volts monitor |  |
| _ROLL_ROT | 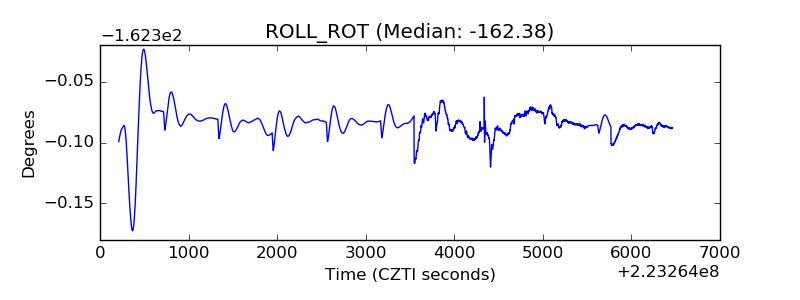 |
| _Roll_DEC | 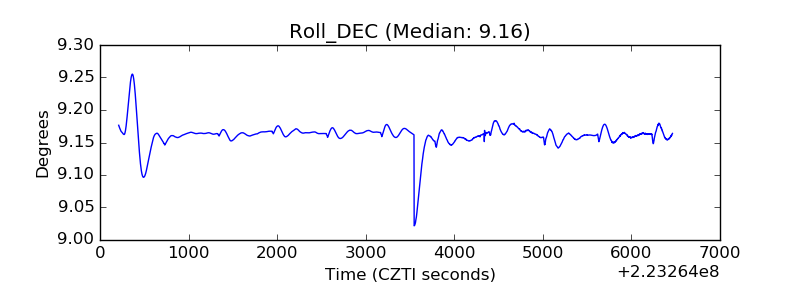 |
| _Roll_RA | 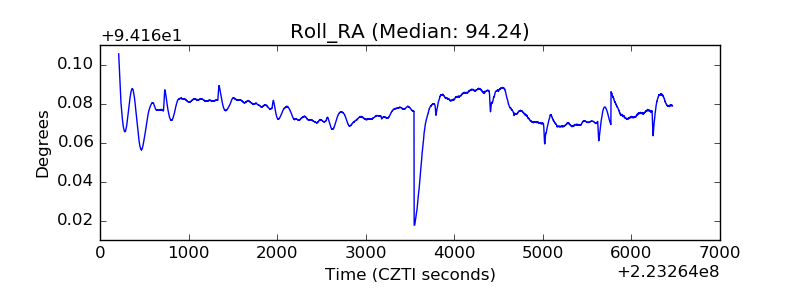 |
| Veto Counter | 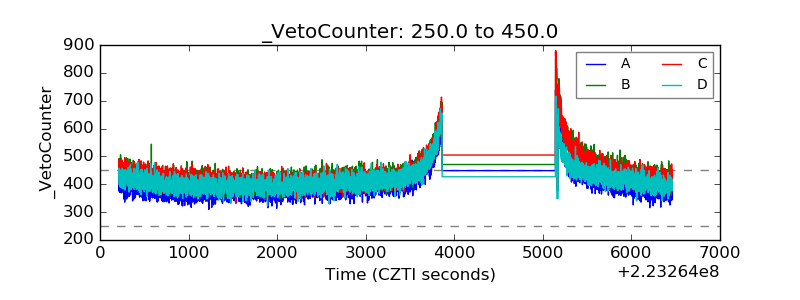 |