| Param | Original file | Final file |
|---|---|---|
| Filename | modeM0/AS1G06_036T01_9000000988_07226cztM0_level2.evt | modeM0/AS1G06_036T01_9000000988_07226cztM0_level2_quad_clean.evt |
| Size (bytes) | 474,773,760 | 72,408,960 |
| Size | 452.8 MB | 69.1 MB |
| Events in quadrant A | 3,217,319 | 428,169 |
| Events in quadrant B | 3,274,570 | 440,170 |
| Events in quadrant C | 3,573,543 | 435,550 |
| Events in quadrant D | 3,854,027 | 417,820 |
| Mode M9 | |||
|---|---|---|---|
| Quadrant | BADHDUFLAG | Total packets | Discarded packets |
| A | 0 | 2 | 0 |
| B | 0 | 2 | 0 |
| C | 0 | 2 | 0 |
| D | 0 | 2 | 0 |
| Mode M0 | |||
|---|---|---|---|
| Quadrant | BADHDUFLAG | Total packets | Discarded packets |
| A | 0 | 14391 | 288 |
| B | 0 | 14434 | 276 |
| C | 0 | 15519 | 286 |
| D | 0 | 16678 | 603 |
| Mode SS | |||
|---|---|---|---|
| Quadrant | BADHDUFLAG | Total packets | Discarded packets |
| A | 0 | 143 | 5 |
| B | 0 | 142 | 2 |
| C | 0 | 140 | 4 |
| D | 0 | 140 | 4 |
| Quadrant | Total seconds | Saturated seconds | Saturation percentage |
|---|---|---|---|
| A | 6751 | 176 | 2.607021% |
| B | 6752 | 188 | 2.784360% |
| C | 6759 | 137 | 2.026927% |
| D | 6747 | 146 | 2.163925% |
Noise dominated data is calculated using 1-second bins in cleaned event files. If a bin has >2000 counts, and if more than 50% of those come from <1% of pixels, then it is considered to be noise-dominated and hence unusable.
| Quadrant | # 1 sec bins | Bins with >0 counts | Bins with >2000 counts | High rate bins dominated by noise | Noise dominated (total time) | Noise dominated (detector-on time) | Marked lightcurve |
|---|---|---|---|---|---|---|---|
| A | 7031 | 6776 | 1 | 1 | 0.01% | 0.01% | 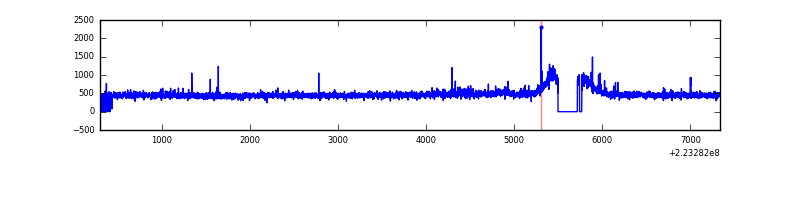 |
| B | 7040 | 6773 | 0 | 0 | 0.00% | 0.00% | 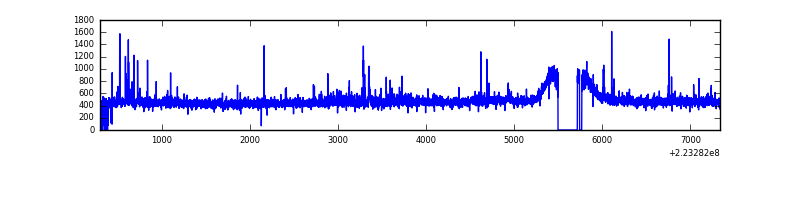 |
| C | 7041 | 6787 | 28 | 28 | 0.40% | 0.41% | 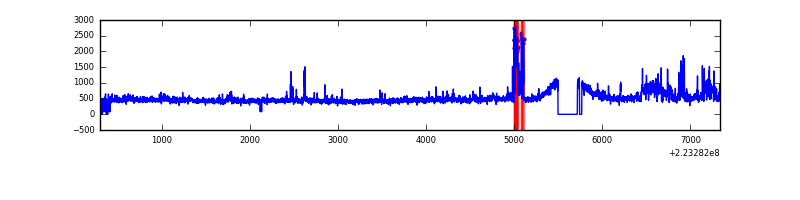 |
| D | 7025 | 6766 | 42 | 42 | 0.60% | 0.62% | 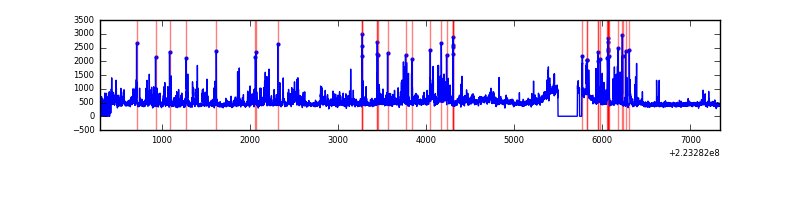 |
Top three noisy pixels from each quadrant. If the there are fewer than three noisy pixels in the level2.evt file, extra rows are filled as -1
| Pixel properties | Quadrant properties | ||||||
|---|---|---|---|---|---|---|---|
| Quadrant | DetID | PixID | Counts | Sigma | Mean | Median | Sigma |
| A | 8 | 15 | 77715 | 461.38 | 804 | 782 | 166.7 |
| A | 13 | 248 | 27252 | 158.75 | 804 | 782 | 166.7 |
| A | 3 | 1 | 9508 | 52.33 | 804 | 782 | 166.7 |
| B | 0 | 214 | 50593 | 312.11 | 814 | 794 | 159.6 |
| B | 12 | 0 | 17523 | 104.85 | 814 | 794 | 159.6 |
| B | 12 | 111 | 16628 | 99.24 | 814 | 794 | 159.6 |
| C | 9 | 68 | 479787 | 2576.98 | 789 | 792 | 185.9 |
| C | 13 | 61 | 5959 | 27.8 | 789 | 792 | 185.9 |
| C | 8 | 128 | 5896 | 27.46 | 789 | 792 | 185.9 |
| D | 2 | 216 | 289744 | 1484.7 | 783 | 760 | 194.6 |
| D | 13 | 137 | 261696 | 1340.6 | 783 | 760 | 194.6 |
| D | 14 | 34 | 148817 | 760.66 | 783 | 760 | 194.6 |
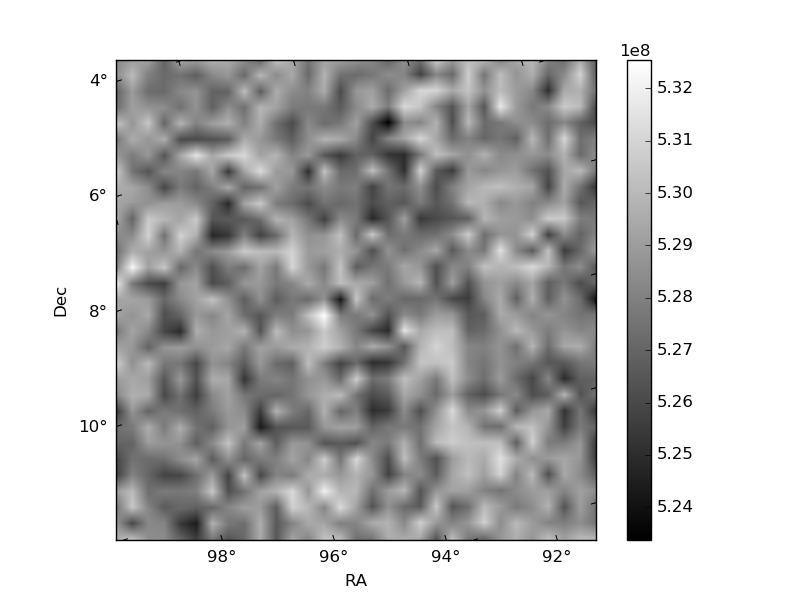
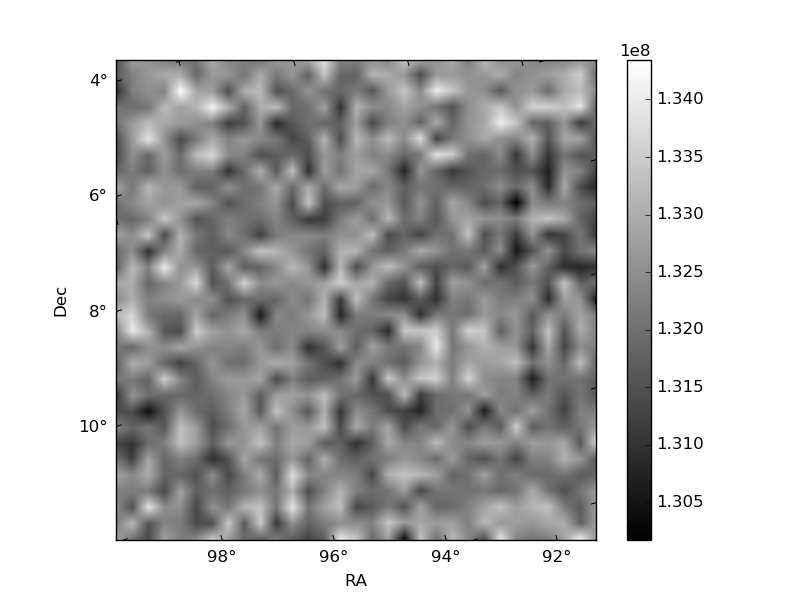
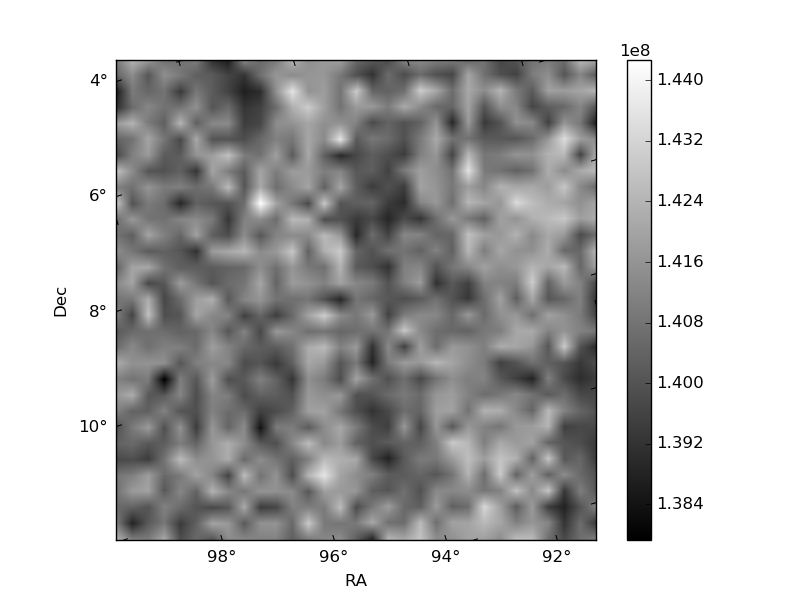
Histogram calculated using DETX and DETY for each event in the final _common_clean file
| Quadrant A | 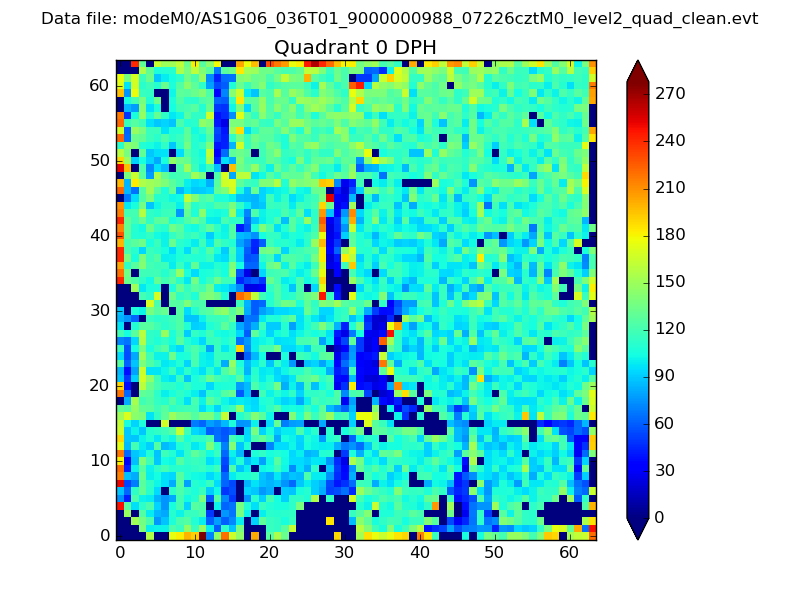 |
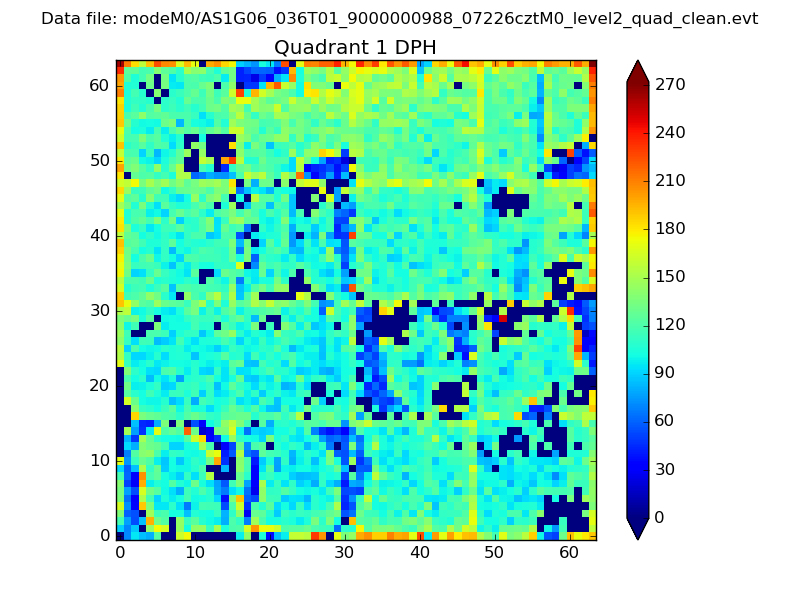 |
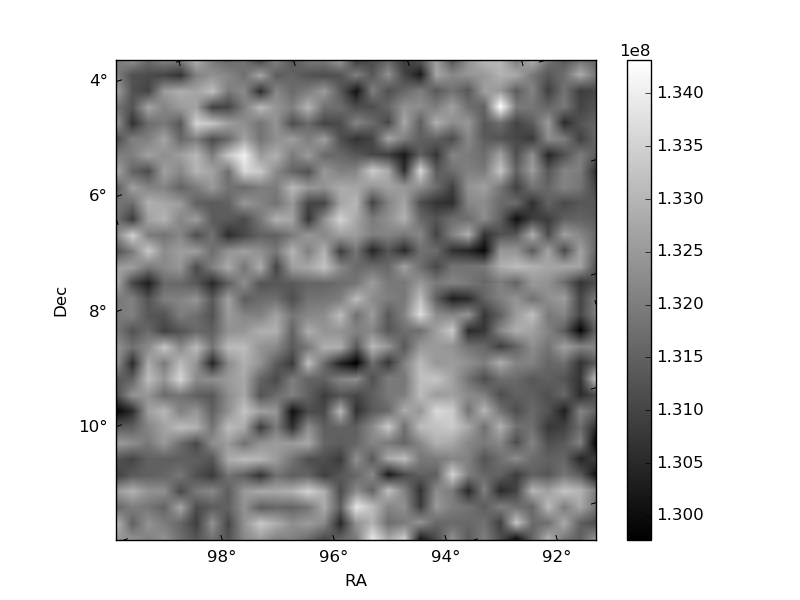
Quadrant B |
|---|---|---|---|
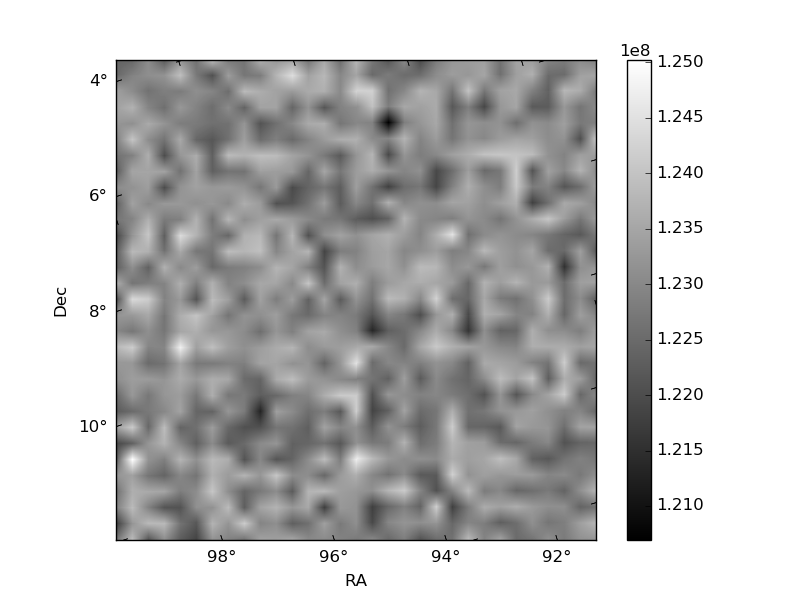
| Quadrant D | 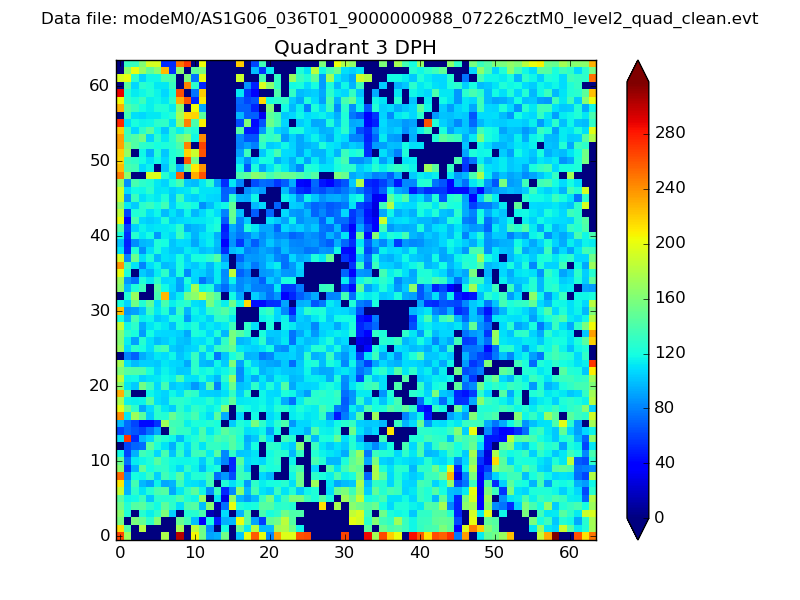 |
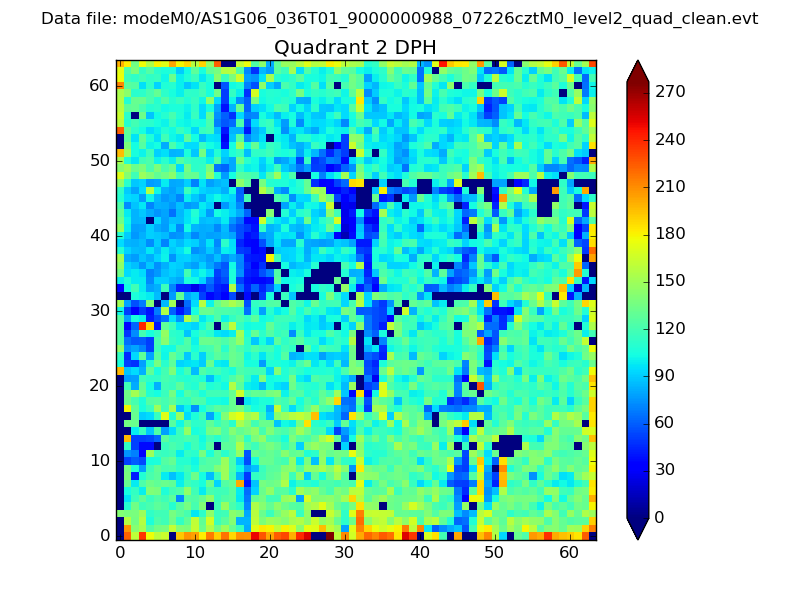 |
Quadrant C |
| Plot type | Count rate plots | Images |
|---|---|---|
| Comparison with Poisson distribution Blue bars denote a histogram of data divided into 1 sec bins. Red curve is a Poisson curve with rate = median count rate of data. |
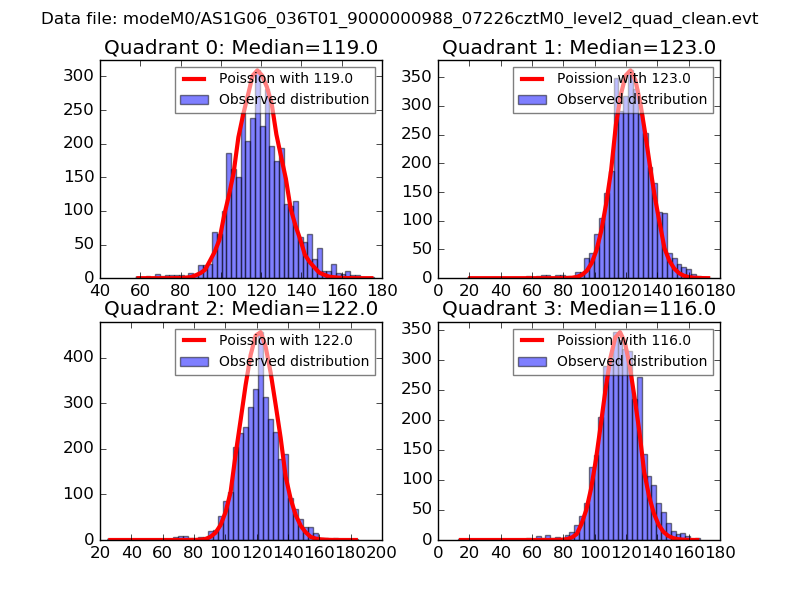 |
 |
| Quadrant-wise count rates Data is divided into 100 sec bins |
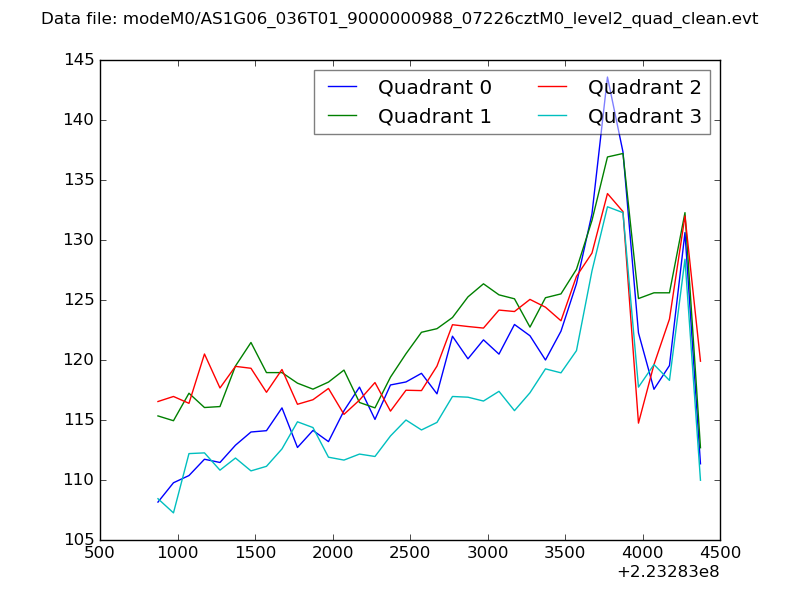 |
|
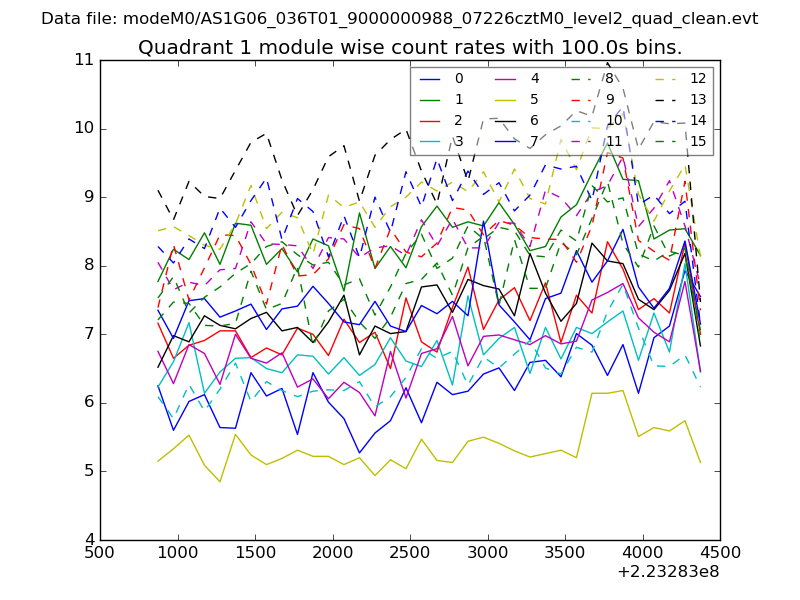
| Module-wise count rates for Quadrant A Data is divided into 100 sec bins |
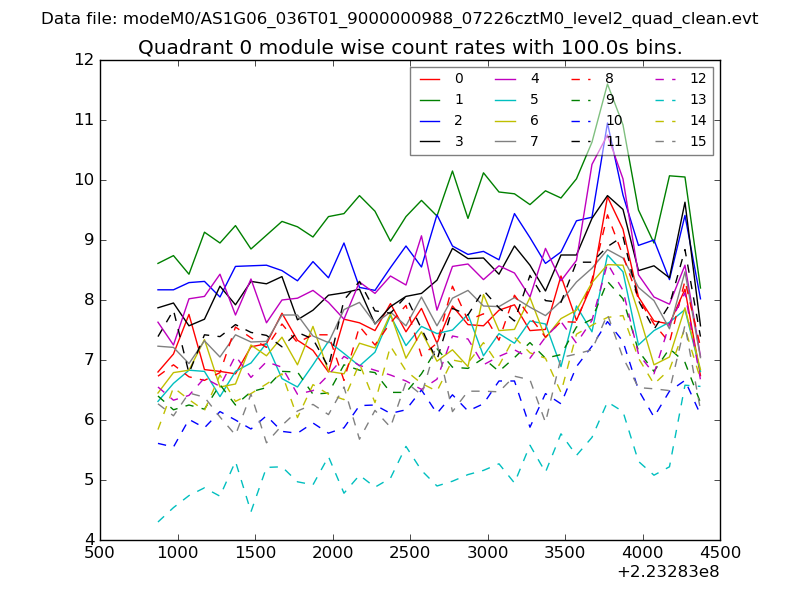 |
 |
| Module-wise count rates for Quadrant B Data is divided into 100 sec bins |
 |
 |
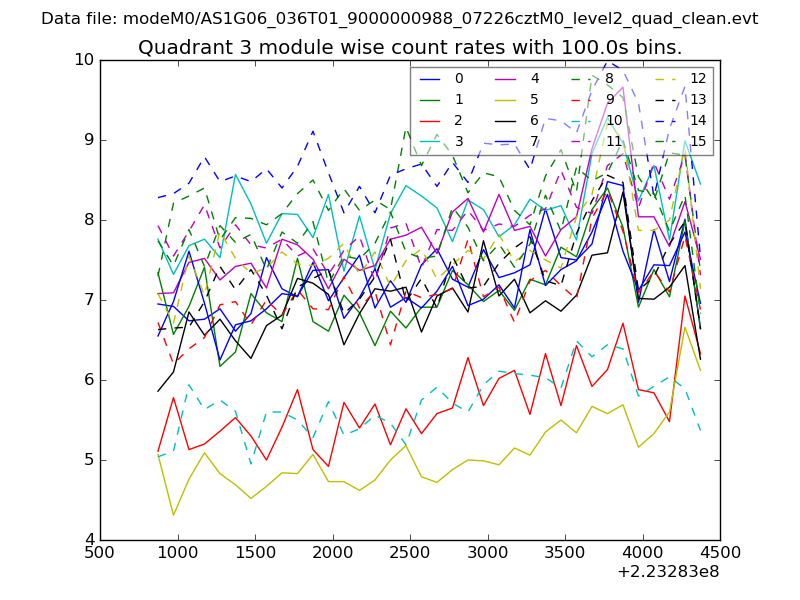
| Module-wise count rates for Quadrant C Data is divided into 100 sec bins |
 |
 |
| Module-wise count rates for Quadrant D Data is divided into 100 sec bins |
 |
 |
| Parameter | Plot |
|---|---|
| CZT HV Monitor | 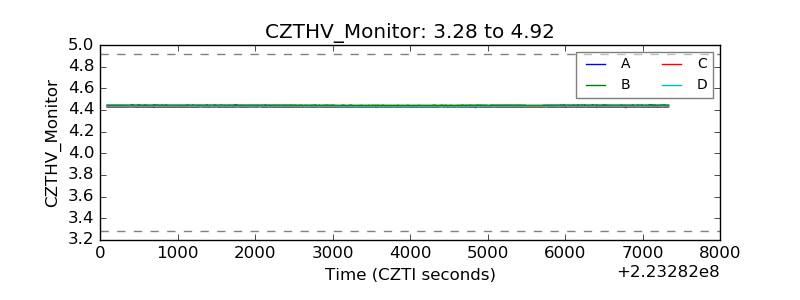 |
| D_VDD | 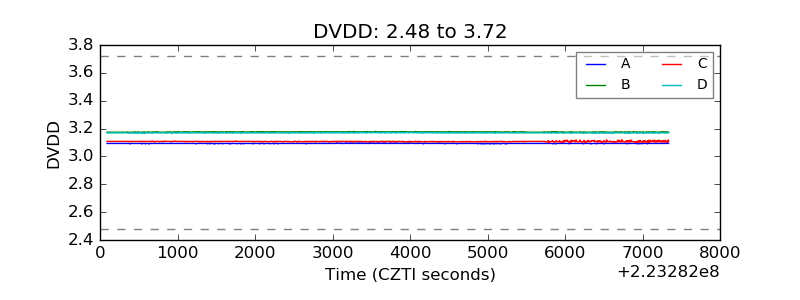 |
| Temperature 1 | 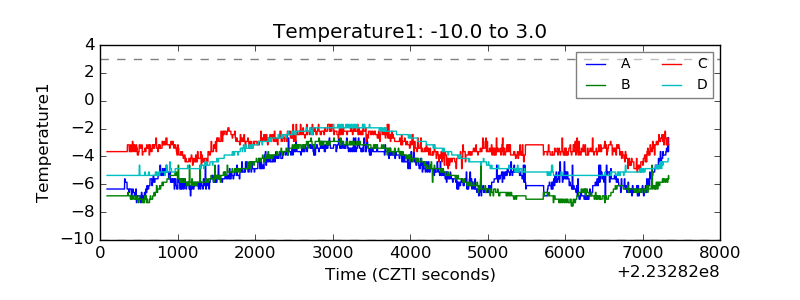 |
| Veto HV Monitor | 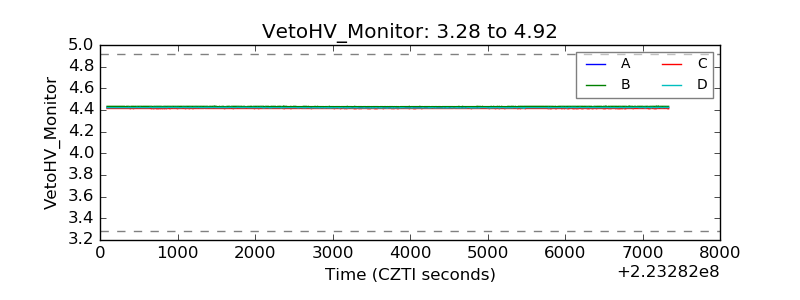 |
| Veto LLD | 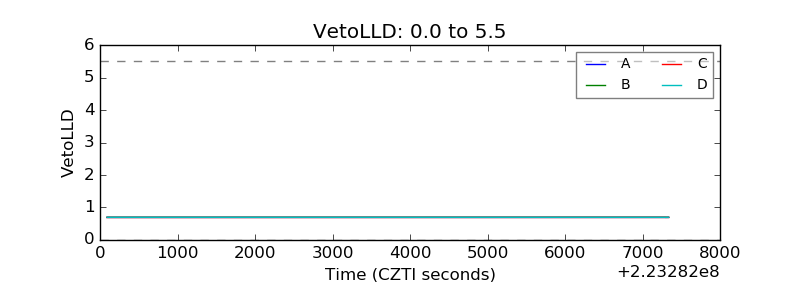 |
| Alpha Counter | 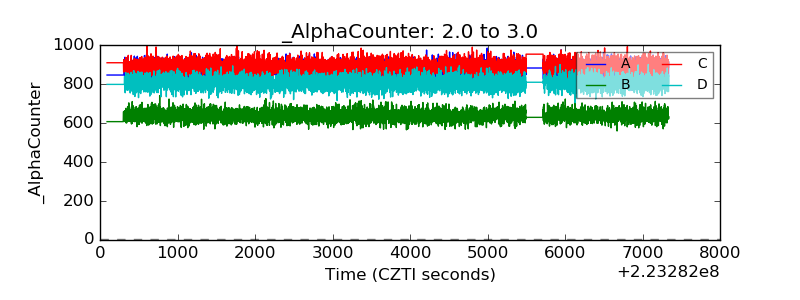 |
| _CPM_Rate | 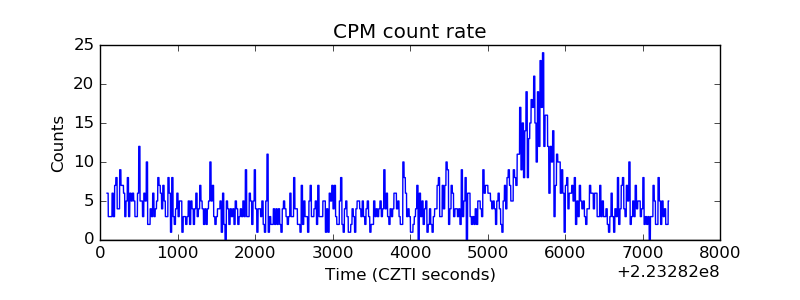 |
| CZT Counter | 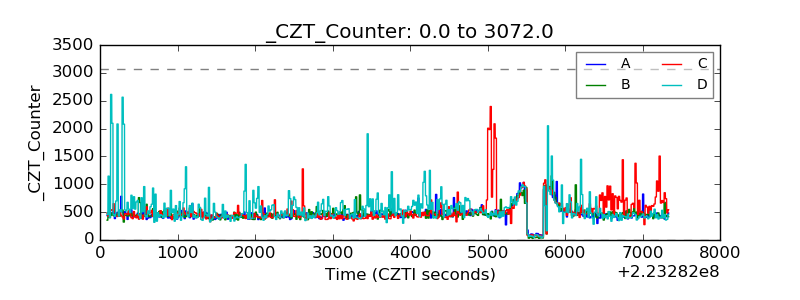 |
| +2.5 Volts monitor |  |
| +5 Volts monitor |  |
| _ROLL_ROT | 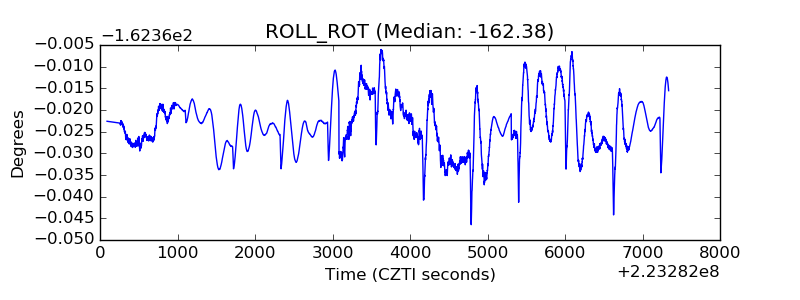 |
| _Roll_DEC | 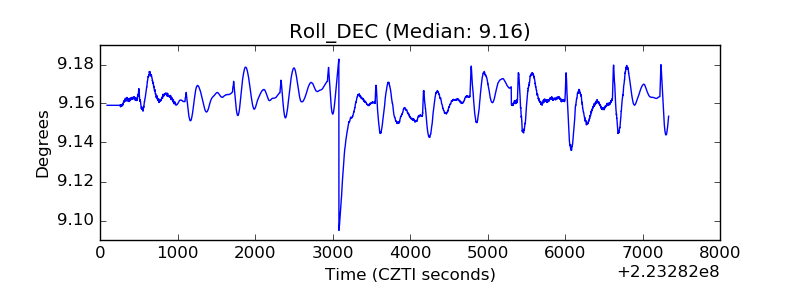 |
| _Roll_RA |  |
| Veto Counter | 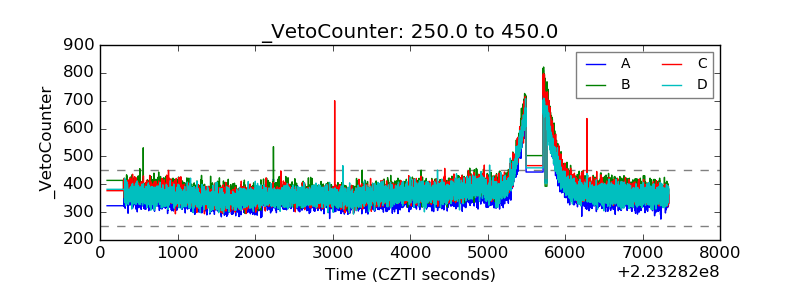 |