| Param | Original file | Final file |
|---|---|---|
| Filename | modeM0/AS1G06_036T01_9000000988_07228cztM0_level2.evt | modeM0/AS1G06_036T01_9000000988_07228cztM0_level2_quad_clean.evt |
| Size (bytes) | 580,547,520 | 84,251,520 |
| Size | 553.7 MB | 80.3 MB |
| Events in quadrant A | 4,079,607 | 485,533 |
| Events in quadrant B | 4,189,531 | 499,382 |
| Events in quadrant C | 4,272,625 | 498,980 |
| Events in quadrant D | 4,462,286 | 476,288 |
| Mode M9 | |||
|---|---|---|---|
| Quadrant | BADHDUFLAG | Total packets | Discarded packets |
| A | 0 | 3 | 0 |
| B | 0 | 3 | 0 |
| C | 0 | 3 | 0 |
| D | 0 | 3 | 0 |
| Mode M0 | |||
|---|---|---|---|
| Quadrant | BADHDUFLAG | Total packets | Discarded packets |
| A | 0 | 17773 | 3 |
| B | 0 | 17989 | 2 |
| C | 0 | 18335 | 2 |
| D | 0 | 19187 | 2 |
| Mode SS | |||
|---|---|---|---|
| Quadrant | BADHDUFLAG | Total packets | Discarded packets |
| A | 0 | 172 | 0 |
| B | 0 | 172 | 0 |
| C | 0 | 172 | 0 |
| D | 0 | 172 | 0 |
| Quadrant | Total seconds | Saturated seconds | Saturation percentage |
|---|---|---|---|
| A | 8508 | 336 | 3.949224% |
| B | 8508 | 382 | 4.489892% |
| C | 8508 | 194 | 2.280207% |
| D | 8508 | 266 | 3.126469% |
Noise dominated data is calculated using 1-second bins in cleaned event files. If a bin has >2000 counts, and if more than 50% of those come from <1% of pixels, then it is considered to be noise-dominated and hence unusable.
| Quadrant | # 1 sec bins | Bins with >0 counts | Bins with >2000 counts | High rate bins dominated by noise | Noise dominated (total time) | Noise dominated (detector-on time) | Marked lightcurve |
|---|---|---|---|---|---|---|---|
| A | 8798 | 8508 | 0 | 0 | 0.00% | 0.00% | 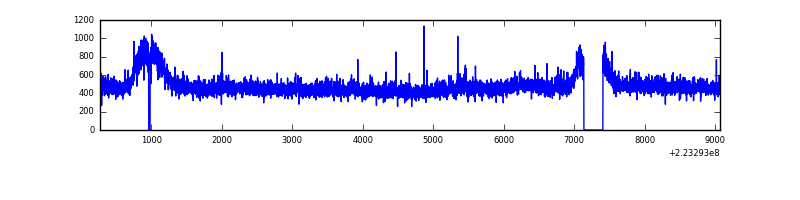 |
| B | 8798 | 8509 | 5 | 5 | 0.06% | 0.06% | 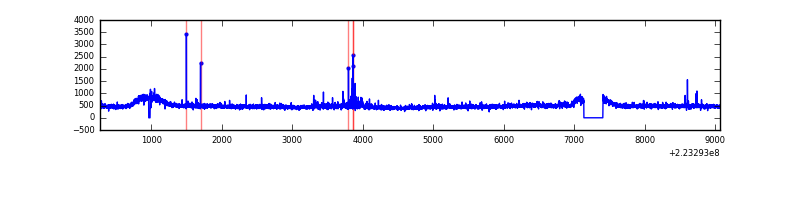 |
| C | 8798 | 8508 | 9 | 9 | 0.10% | 0.11% | 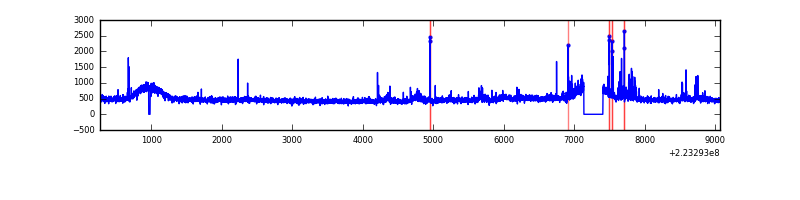 |
| D | 8798 | 8509 | 37 | 37 | 0.42% | 0.43% | 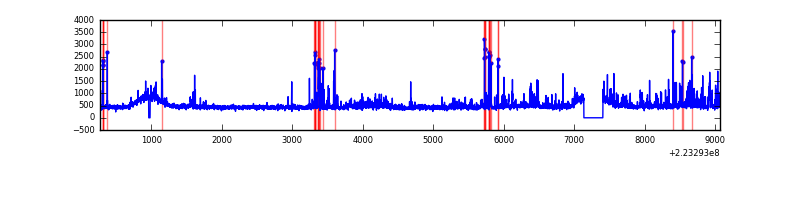 |
Top three noisy pixels from each quadrant. If the there are fewer than three noisy pixels in the level2.evt file, extra rows are filled as -1
| Pixel properties | Quadrant properties | ||||||
|---|---|---|---|---|---|---|---|
| Quadrant | DetID | PixID | Counts | Sigma | Mean | Median | Sigma |
| A | 8 | 15 | 81093 | 374.33 | 1032 | 1003 | 214.0 |
| A | 13 | 14 | 11760 | 50.28 | 1032 | 1003 | 214.0 |
| A | 0 | 226 | 9770 | 40.98 | 1032 | 1003 | 214.0 |
| B | 0 | 214 | 53097 | 255.52 | 1042 | 1013 | 203.8 |
| B | 10 | 16 | 45657 | 219.02 | 1042 | 1013 | 203.8 |
| B | 4 | 81 | 43712 | 209.47 | 1042 | 1013 | 203.8 |
| C | 9 | 68 | 276514 | 1143.97 | 1017 | 1018 | 240.8 |
| C | 9 | 243 | 20098 | 79.23 | 1017 | 1018 | 240.8 |
| C | 13 | 61 | 7737 | 27.9 | 1017 | 1018 | 240.8 |
| D | 2 | 216 | 347399 | 1395.17 | 1010 | 976 | 248.3 |
| D | 2 | 14 | 213447 | 855.7 | 1010 | 976 | 248.3 |
| D | 14 | 34 | 93409 | 372.26 | 1010 | 976 | 248.3 |
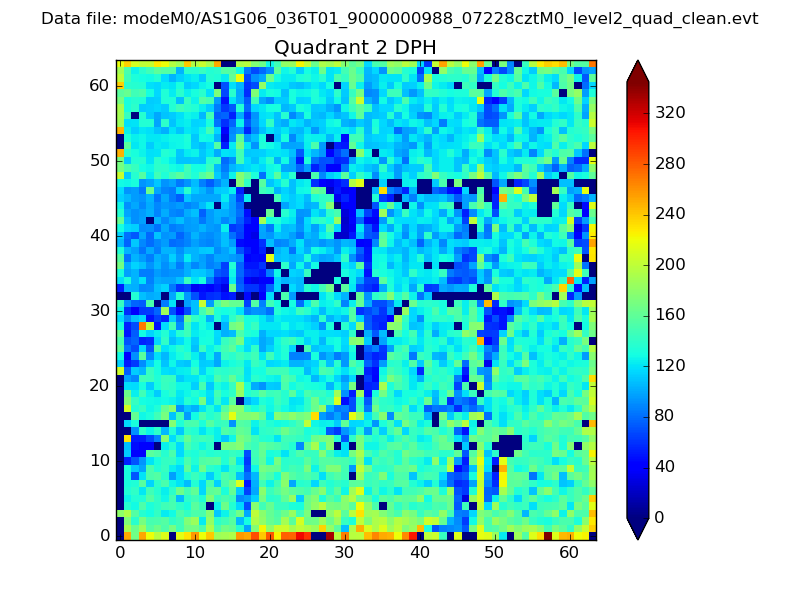
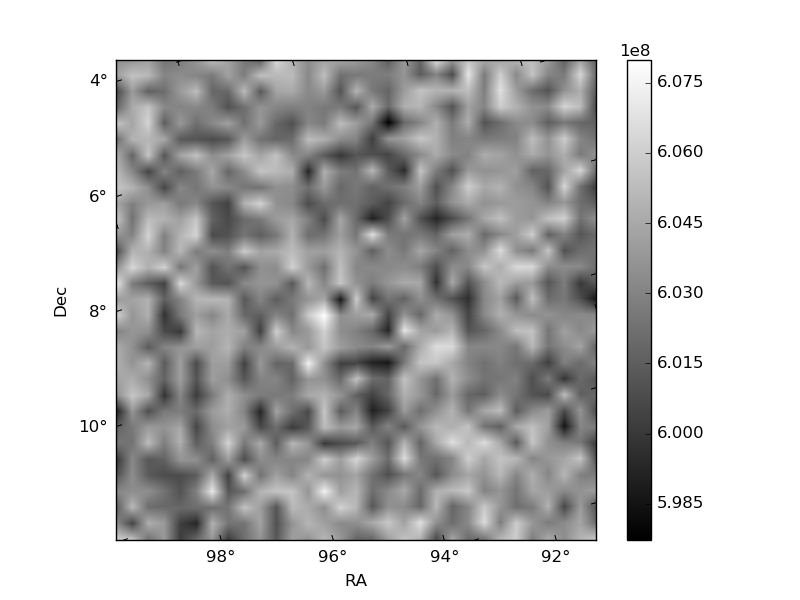
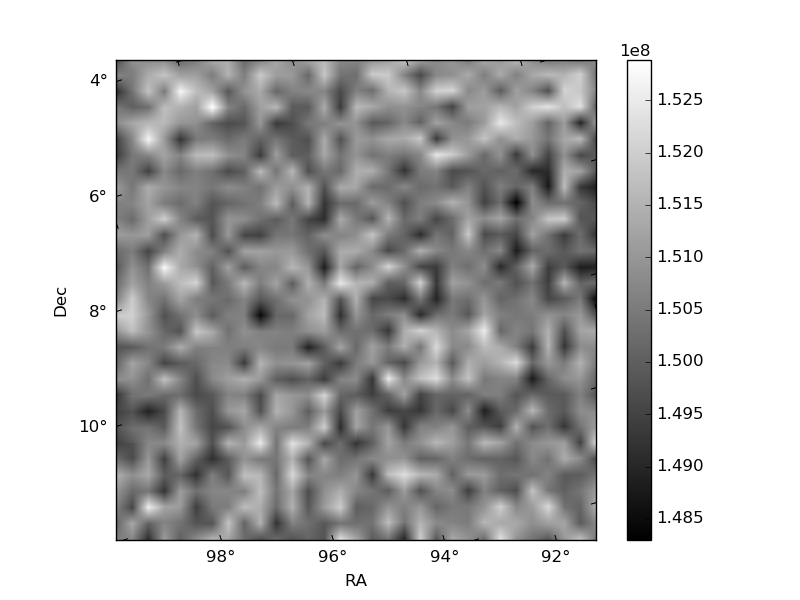
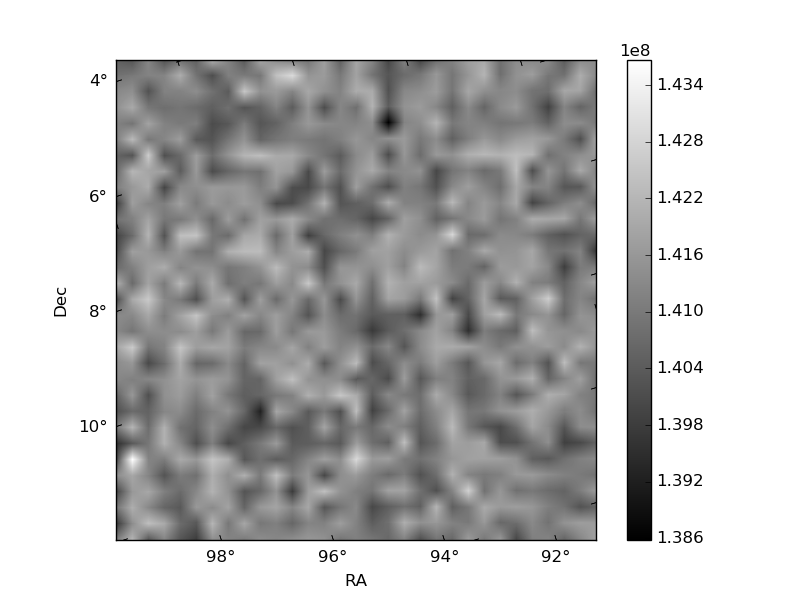
Histogram calculated using DETX and DETY for each event in the final _common_clean file
| Quadrant A | 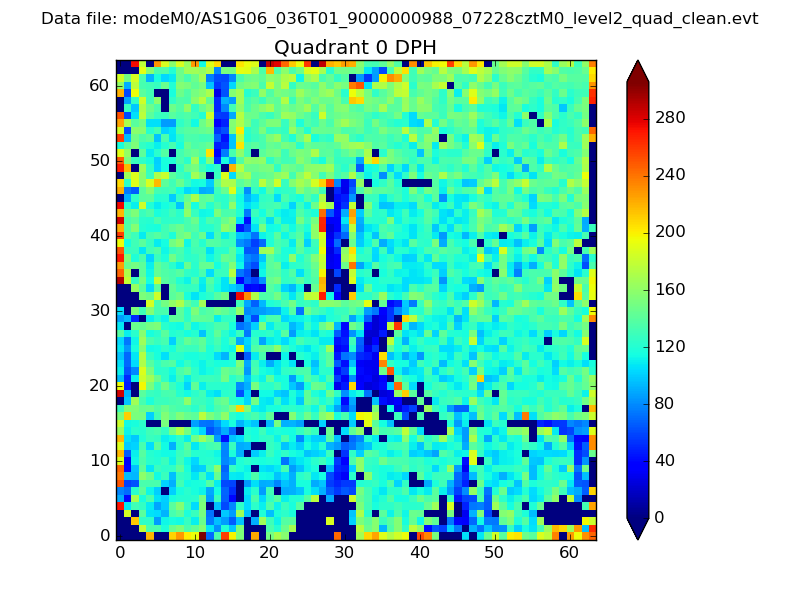 |
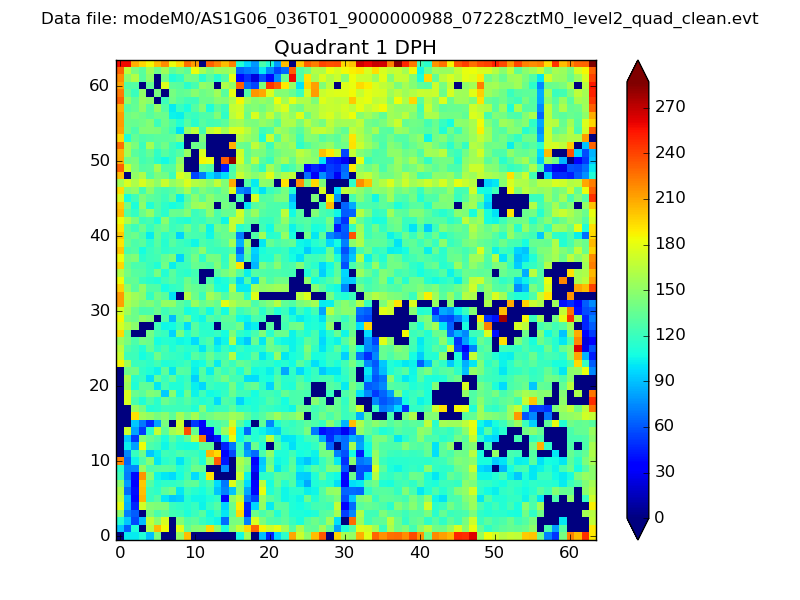 |
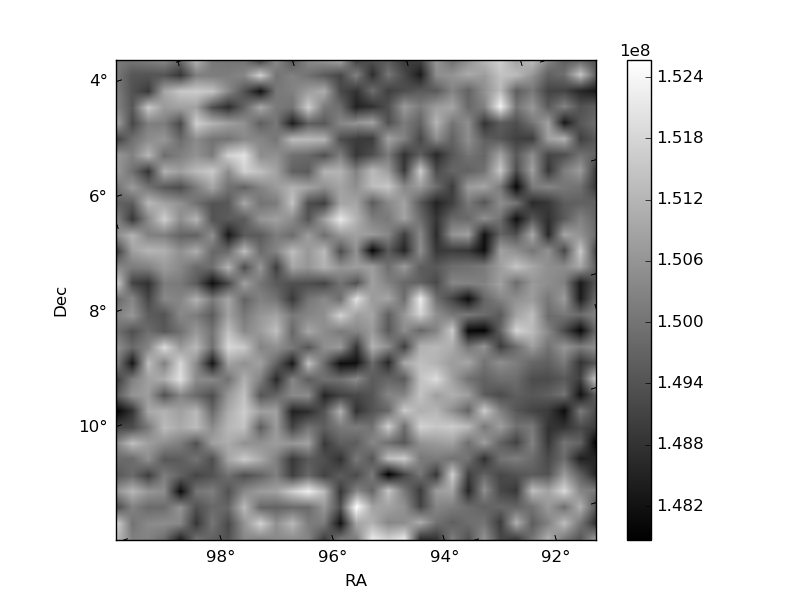
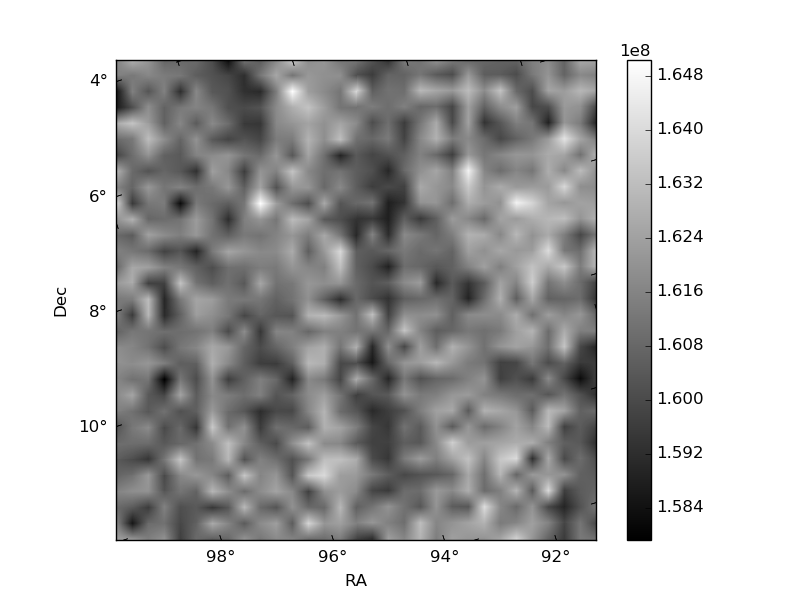
Quadrant B |
|---|---|---|---|
| Quadrant D | 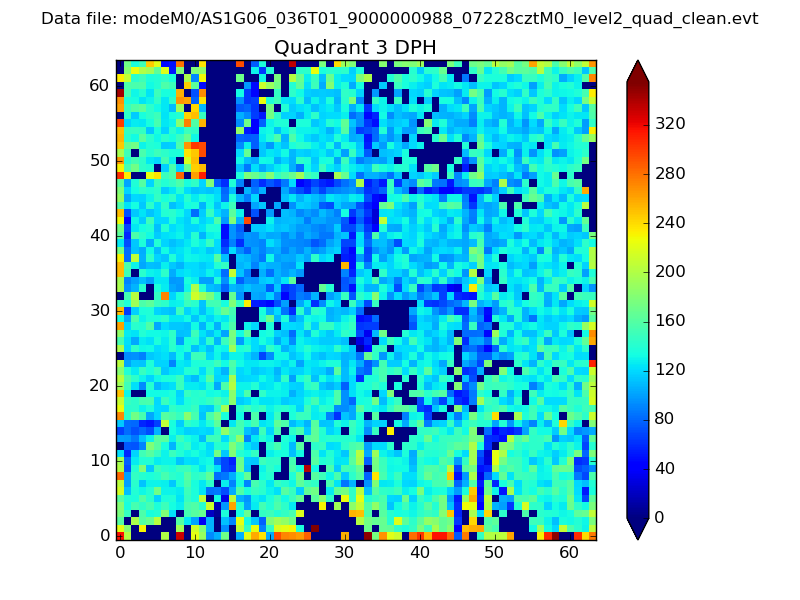 |
 |
Quadrant C |
| Plot type | Count rate plots | Images |
|---|---|---|
| Comparison with Poisson distribution Blue bars denote a histogram of data divided into 1 sec bins. Red curve is a Poisson curve with rate = median count rate of data. |
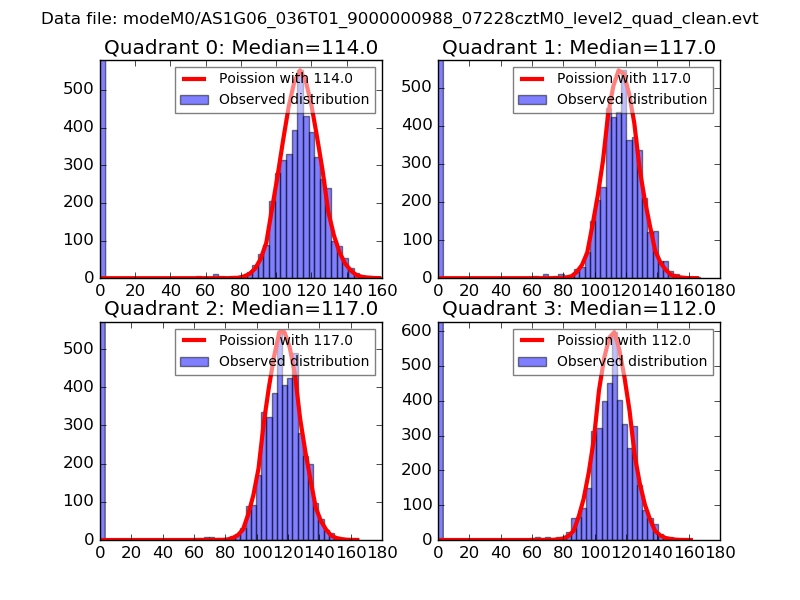 |
 |
| Quadrant-wise count rates Data is divided into 100 sec bins |
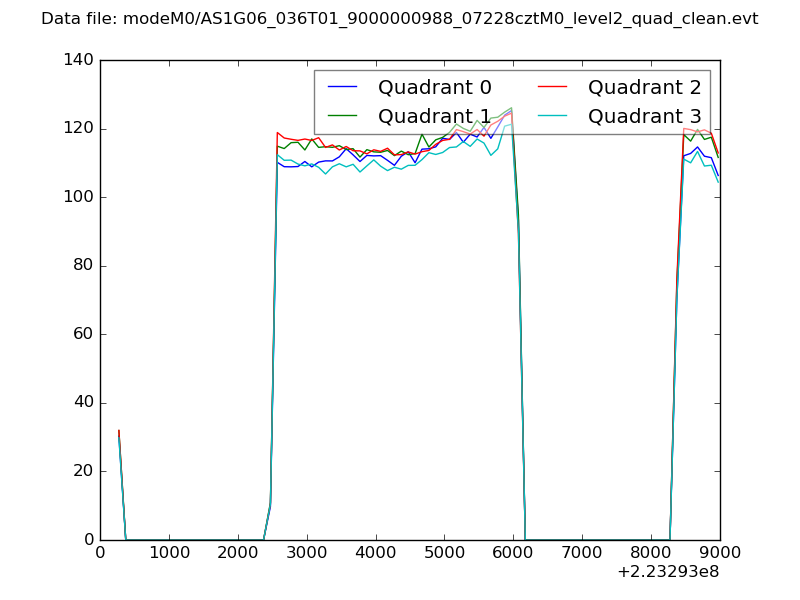 |
|
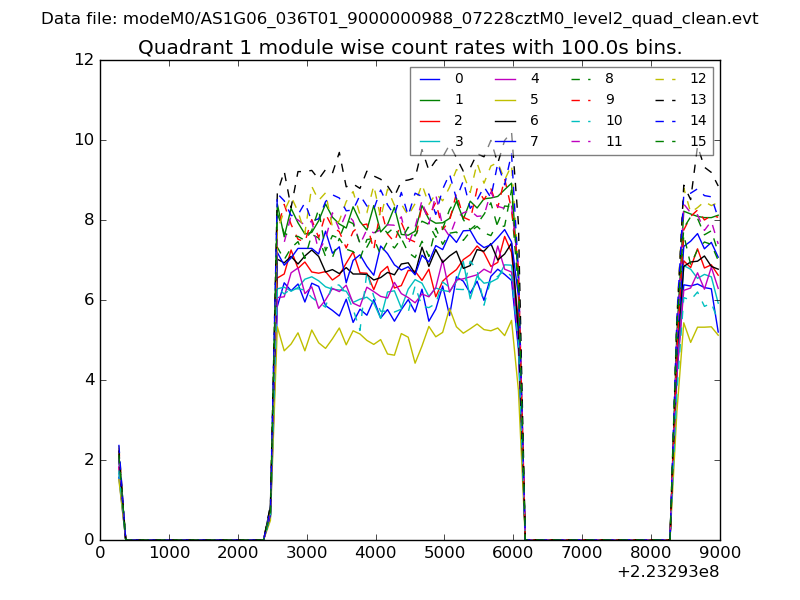
| Module-wise count rates for Quadrant A Data is divided into 100 sec bins |
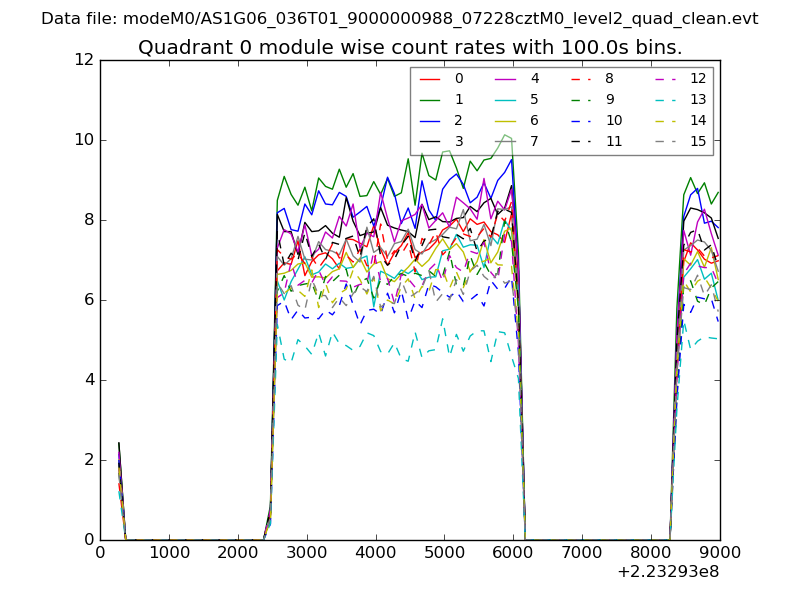 |
 |
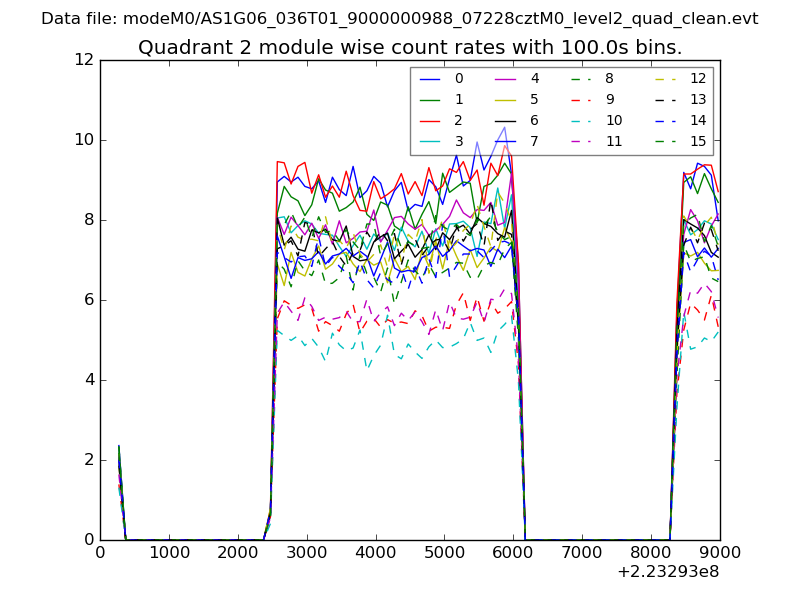
| Module-wise count rates for Quadrant B Data is divided into 100 sec bins |
 |
 |
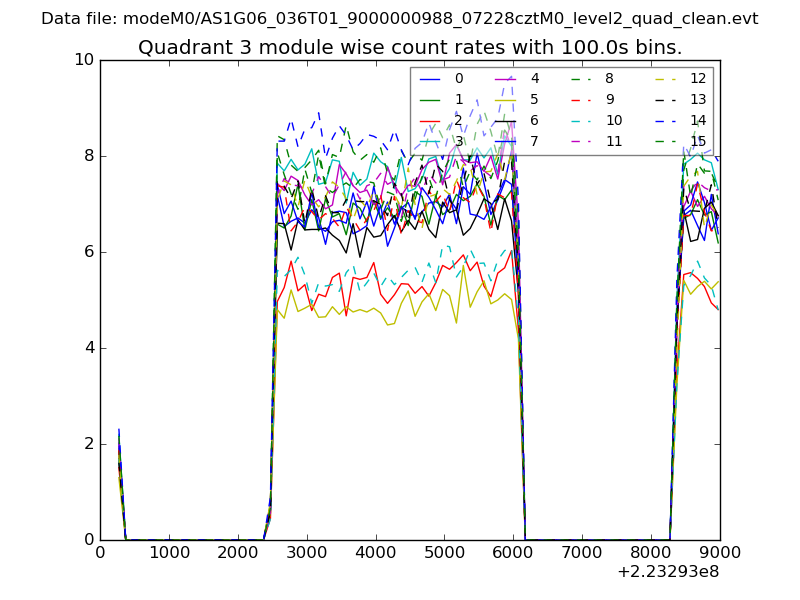
| Module-wise count rates for Quadrant C Data is divided into 100 sec bins |
 |
 |
| Module-wise count rates for Quadrant D Data is divided into 100 sec bins |
 |
 |
| Parameter | Plot |
|---|---|
| CZT HV Monitor | 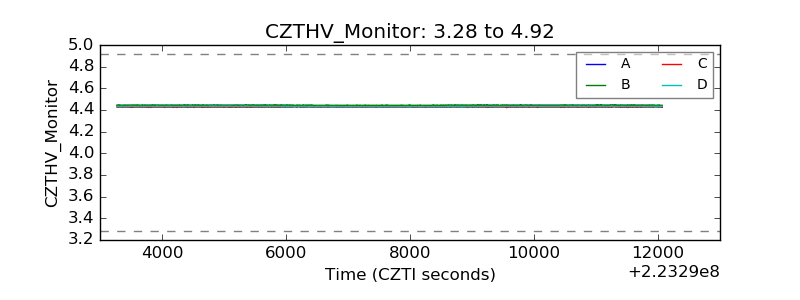 |
| D_VDD |  |
| Temperature 1 | 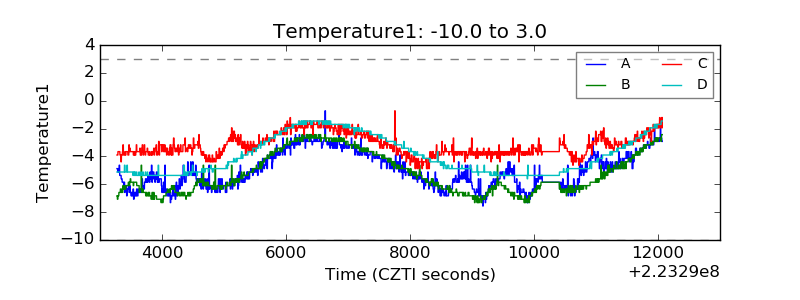 |
| Veto HV Monitor | 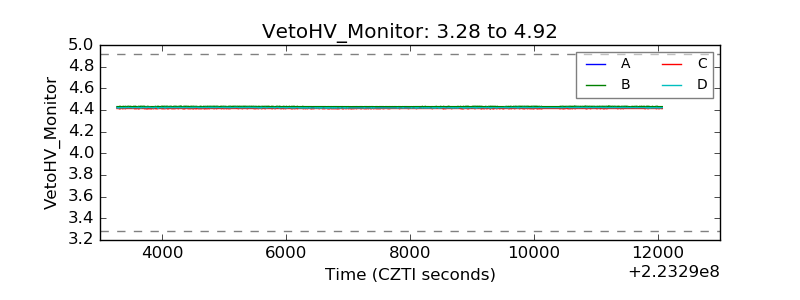 |
| Veto LLD | 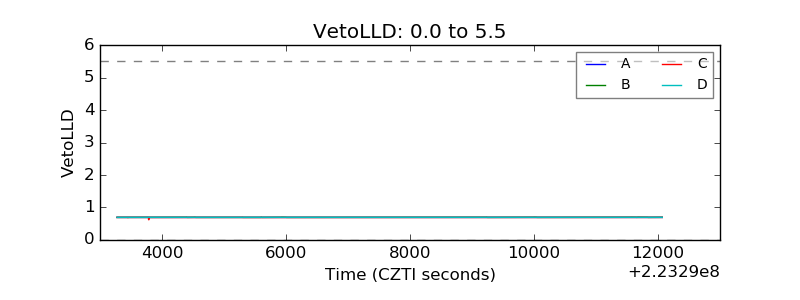 |
| Alpha Counter | 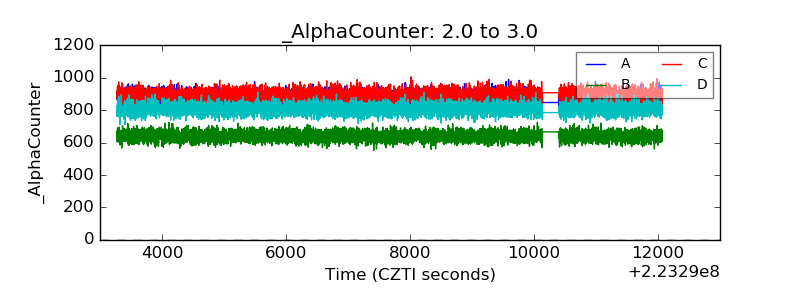 |
| _CPM_Rate | 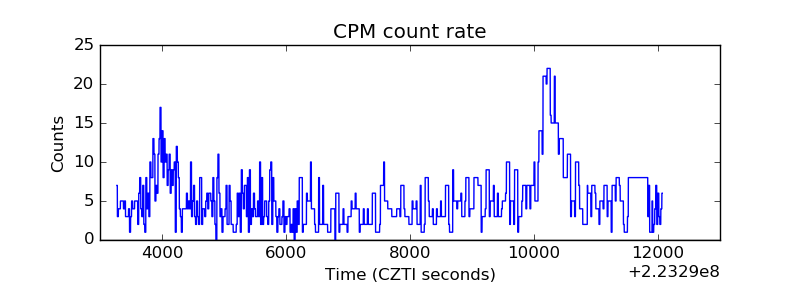 |
| CZT Counter | 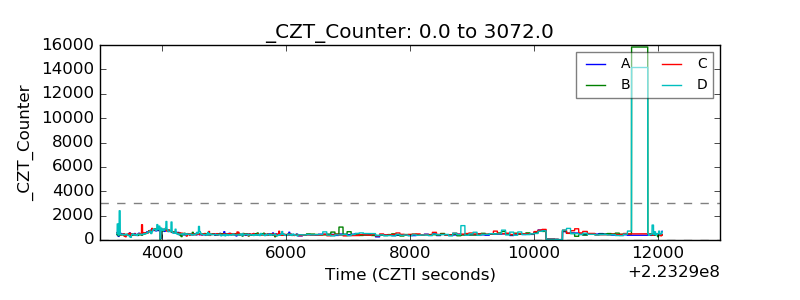 |
| +2.5 Volts monitor |  |
| +5 Volts monitor |  |
| _ROLL_ROT | 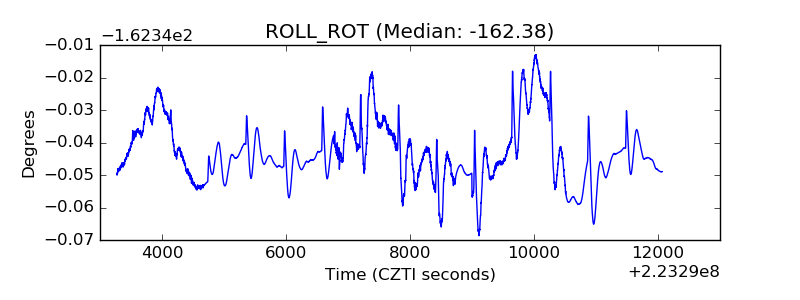 |
| _Roll_DEC | 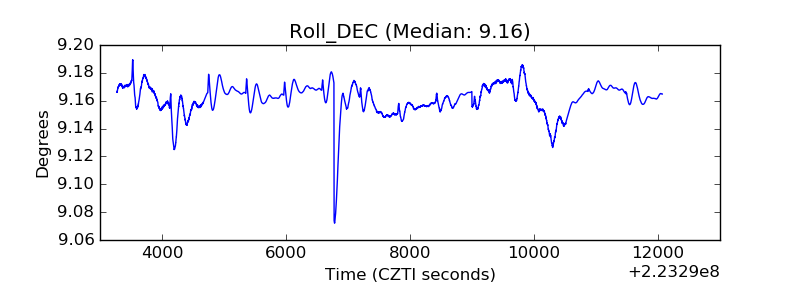 |
| _Roll_RA | 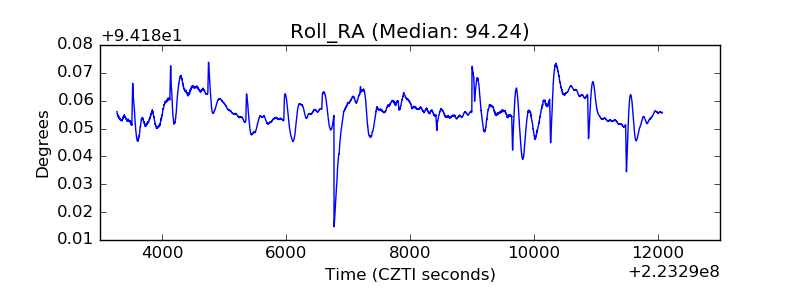 |
| Veto Counter | 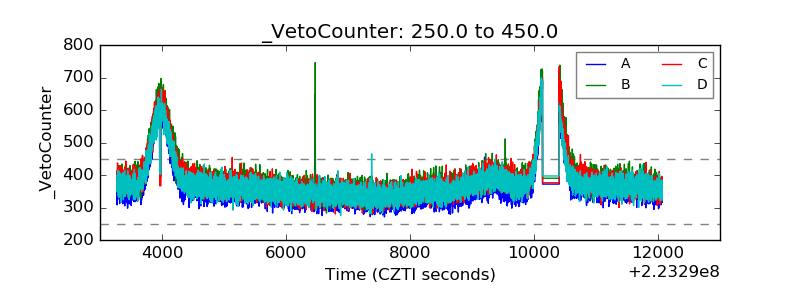 |