| Param | Original file | Final file |
|---|---|---|
| Filename | modeM0/AS1G06_036T01_9000000988_07230cztM0_level2.evt | modeM0/AS1G06_036T01_9000000988_07230cztM0_level2_quad_clean.evt |
| Size (bytes) | 995,532,480 | 163,949,760 |
| Size | 949.4 MB | 156.4 MB |
| Events in quadrant A | 6,484,008 | 1,000,457 |
| Events in quadrant B | 6,729,256 | 1,019,090 |
| Events in quadrant C | 8,029,010 | 1,016,094 |
| Events in quadrant D | 7,969,274 | 972,014 |
| Mode M9 | |||
|---|---|---|---|
| Quadrant | BADHDUFLAG | Total packets | Discarded packets |
| A | 0 | 14 | 0 |
| B | 0 | 14 | 0 |
| C | 0 | 14 | 0 |
| D | 0 | 14 | 0 |
| Mode M0 | |||
|---|---|---|---|
| Quadrant | BADHDUFLAG | Total packets | Discarded packets |
| A | 0 | 28541 | 4 |
| B | 0 | 28980 | 3 |
| C | 0 | 33192 | 3 |
| D | 0 | 33532 | 3 |
| Mode SS | |||
|---|---|---|---|
| Quadrant | BADHDUFLAG | Total packets | Discarded packets |
| A | 0 | 284 | 0 |
| B | 0 | 284 | 0 |
| C | 0 | 284 | 0 |
| D | 0 | 284 | 0 |
| Quadrant | Total seconds | Saturated seconds | Saturation percentage |
|---|---|---|---|
| A | 13866 | 297 | 2.141930% |
| B | 13866 | 303 | 2.185201% |
| C | 13866 | 320 | 2.307803% |
| D | 13866 | 398 | 2.870330% |
Noise dominated data is calculated using 1-second bins in cleaned event files. If a bin has >2000 counts, and if more than 50% of those come from <1% of pixels, then it is considered to be noise-dominated and hence unusable.
| Quadrant | # 1 sec bins | Bins with >0 counts | Bins with >2000 counts | High rate bins dominated by noise | Noise dominated (total time) | Noise dominated (detector-on time) | Marked lightcurve |
|---|---|---|---|---|---|---|---|
| A | 15261 | 13866 | 0 | 0 | 0.00% | 0.00% | 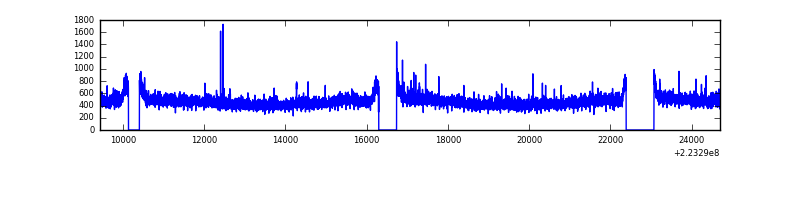 |
| B | 15261 | 13866 | 5 | 5 | 0.03% | 0.04% | 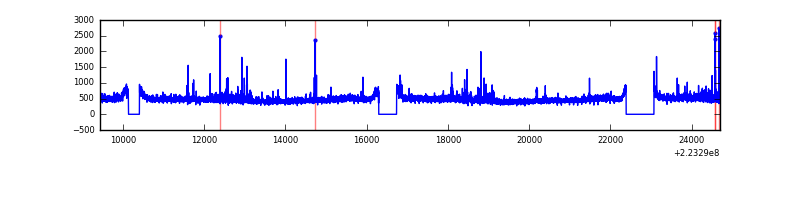 |
| C | 15261 | 13866 | 58 | 58 | 0.38% | 0.42% | 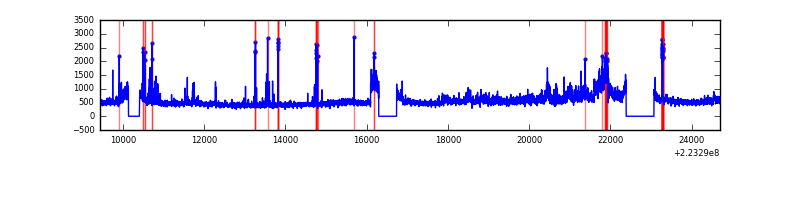 |
| D | 15261 | 13866 | 127 | 127 | 0.83% | 0.92% | 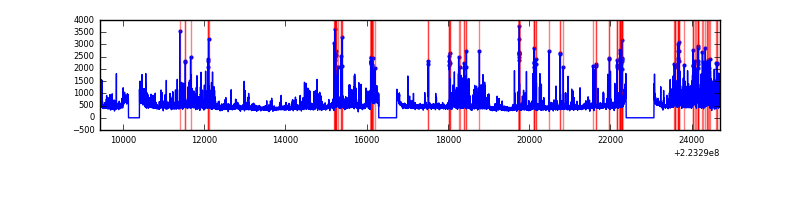 |
Top three noisy pixels from each quadrant. If the there are fewer than three noisy pixels in the level2.evt file, extra rows are filled as -1
| Pixel properties | Quadrant properties | ||||||
|---|---|---|---|---|---|---|---|
| Quadrant | DetID | PixID | Counts | Sigma | Mean | Median | Sigma |
| A | 8 | 15 | 143834 | 424.46 | 1635 | 1596 | 335.1 |
| A | 14 | 238 | 17035 | 46.07 | 1635 | 1596 | 335.1 |
| A | 0 | 226 | 15459 | 41.37 | 1635 | 1596 | 335.1 |
| B | 0 | 214 | 172932 | 540.58 | 1649 | 1606 | 316.9 |
| B | 4 | 81 | 54217 | 166.0 | 1649 | 1606 | 316.9 |
| B | 12 | 111 | 33745 | 101.41 | 1649 | 1606 | 316.9 |
| C | 9 | 68 | 1789356 | 4792.33 | 1595 | 1603 | 373.0 |
| C | 13 | 61 | 12278 | 28.61 | 1595 | 1603 | 373.0 |
| C | 9 | 243 | 9348 | 20.76 | 1595 | 1603 | 373.0 |
| D | 2 | 216 | 1337728 | 3446.78 | 1592 | 1544 | 387.7 |
| D | 2 | 14 | 356971 | 916.85 | 1592 | 1544 | 387.7 |
| D | 14 | 34 | 181709 | 464.75 | 1592 | 1544 | 387.7 |
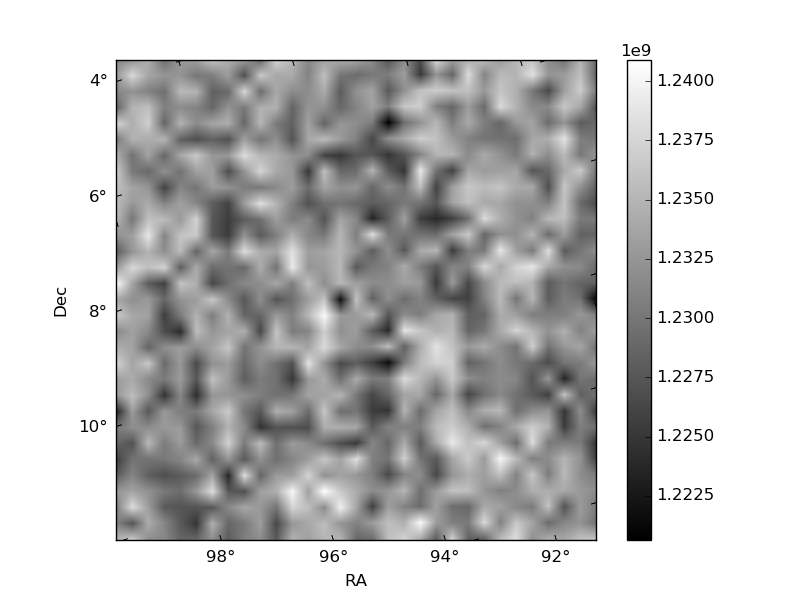
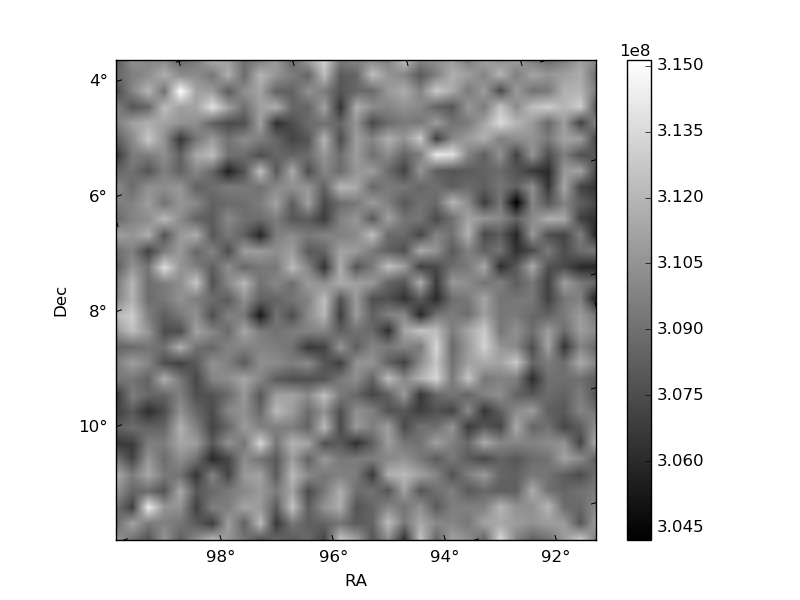
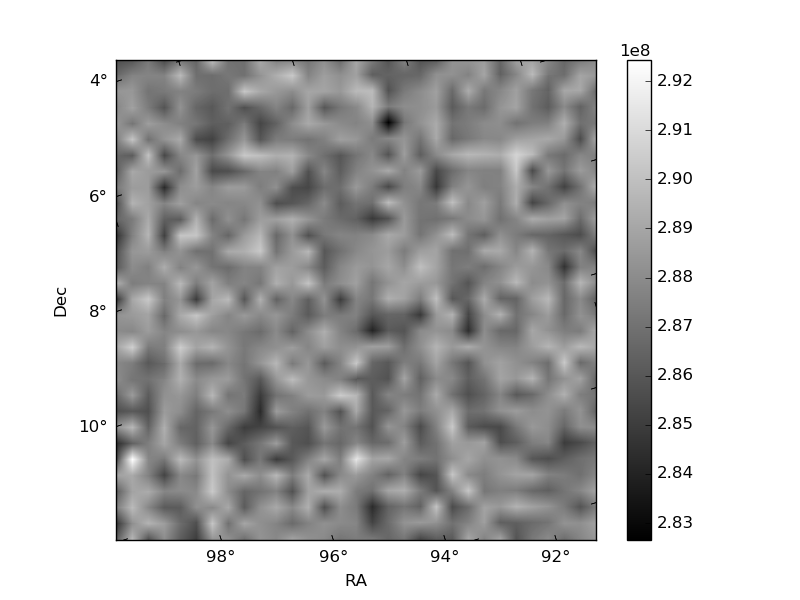
Histogram calculated using DETX and DETY for each event in the final _common_clean file
| Quadrant A | 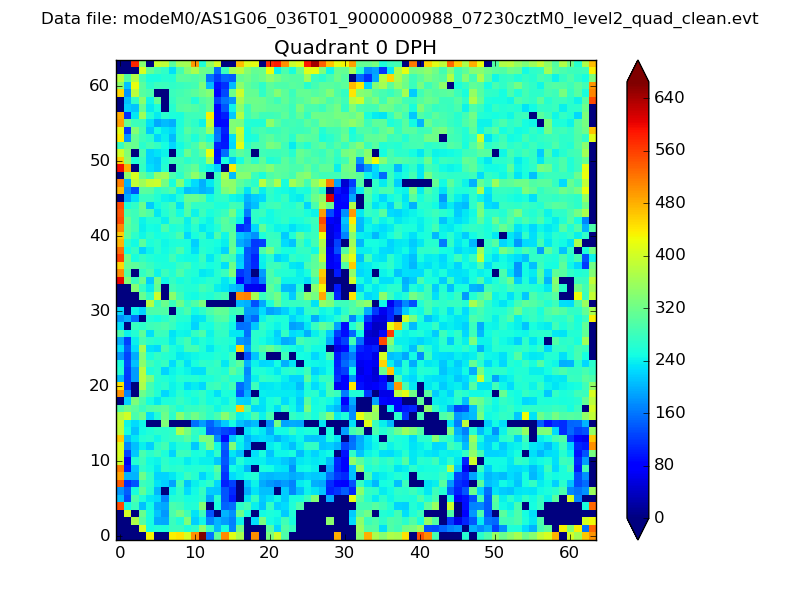 |
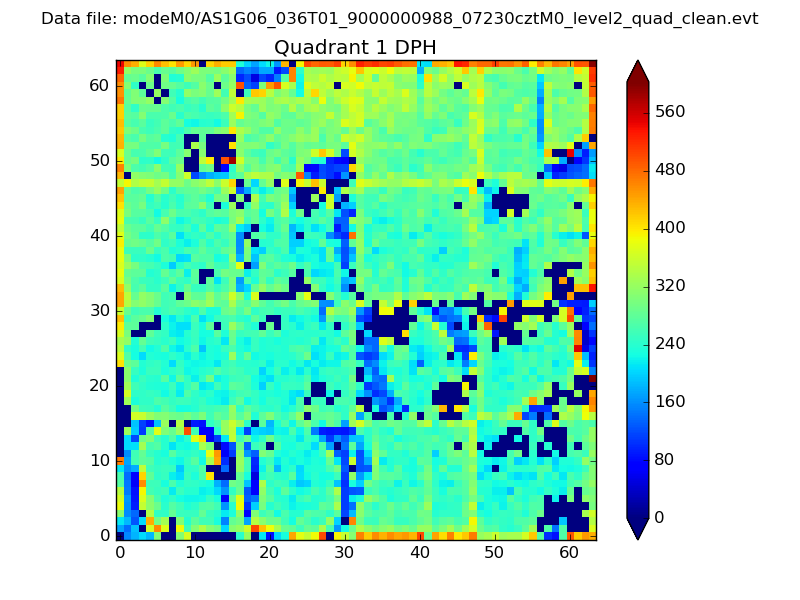 |
Quadrant B |
|---|---|---|---|
| Quadrant D | 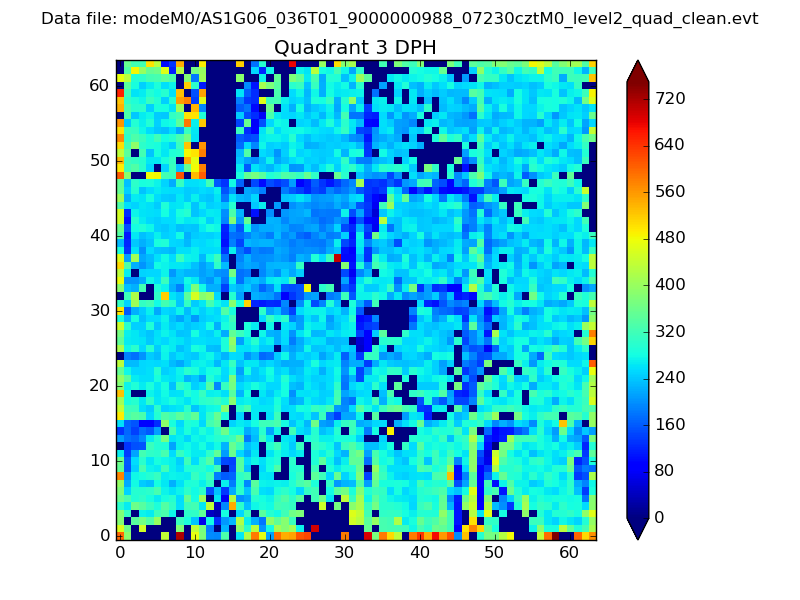 |
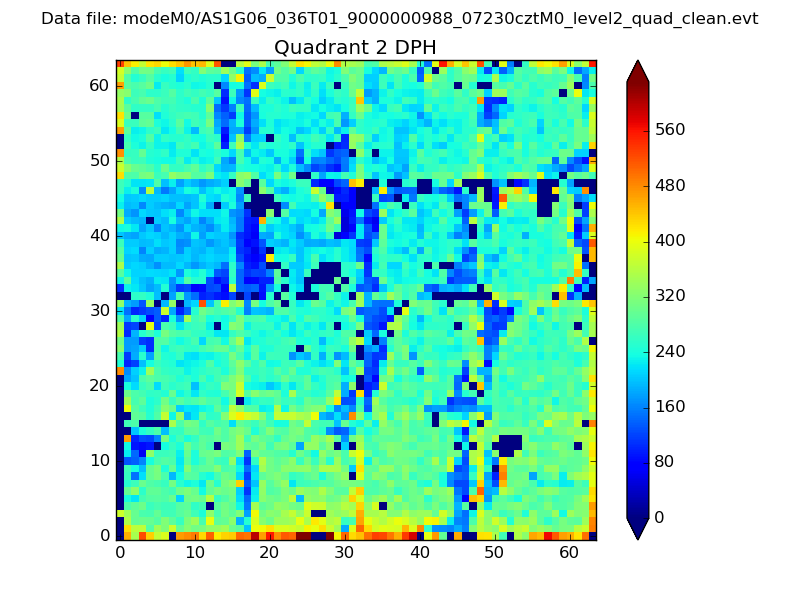 |
Quadrant C |
| Plot type | Count rate plots | Images |
|---|---|---|
| Comparison with Poisson distribution Blue bars denote a histogram of data divided into 1 sec bins. Red curve is a Poisson curve with rate = median count rate of data. |
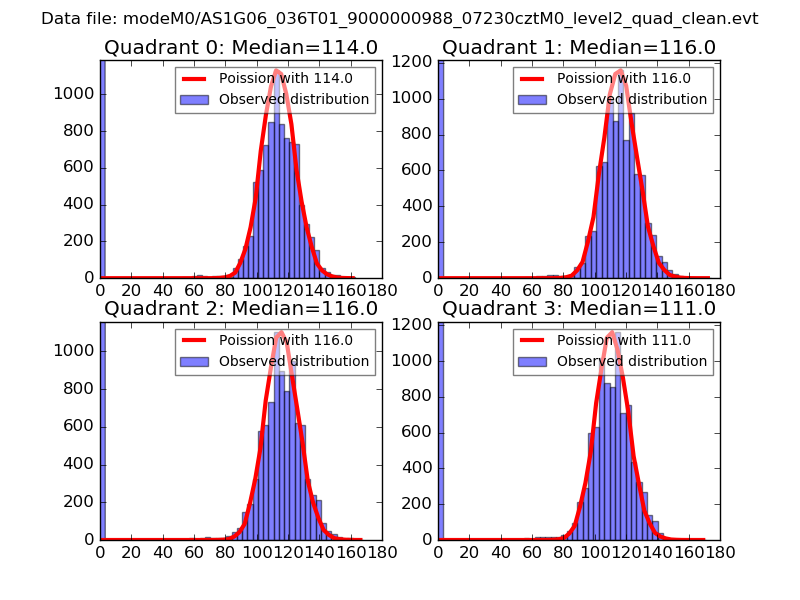 |
 |
| Quadrant-wise count rates Data is divided into 100 sec bins |
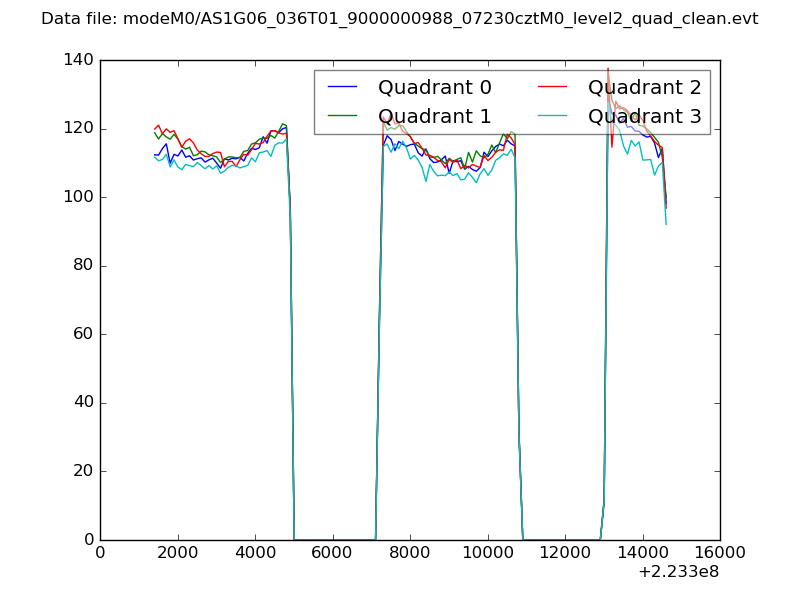 |
|
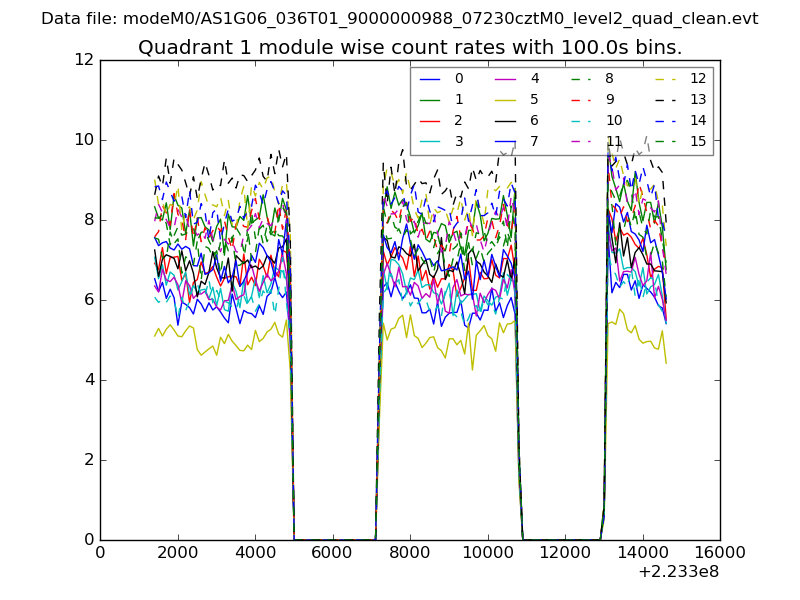
| Module-wise count rates for Quadrant A Data is divided into 100 sec bins |
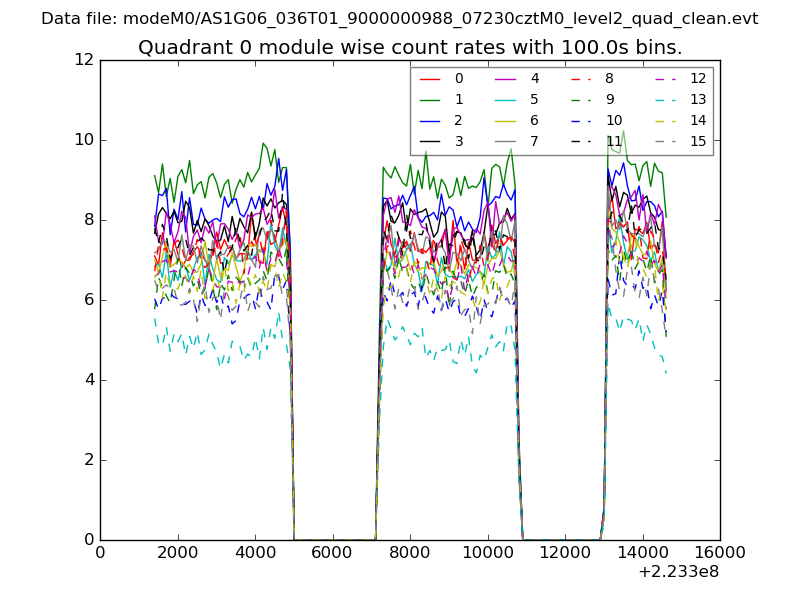 |
 |
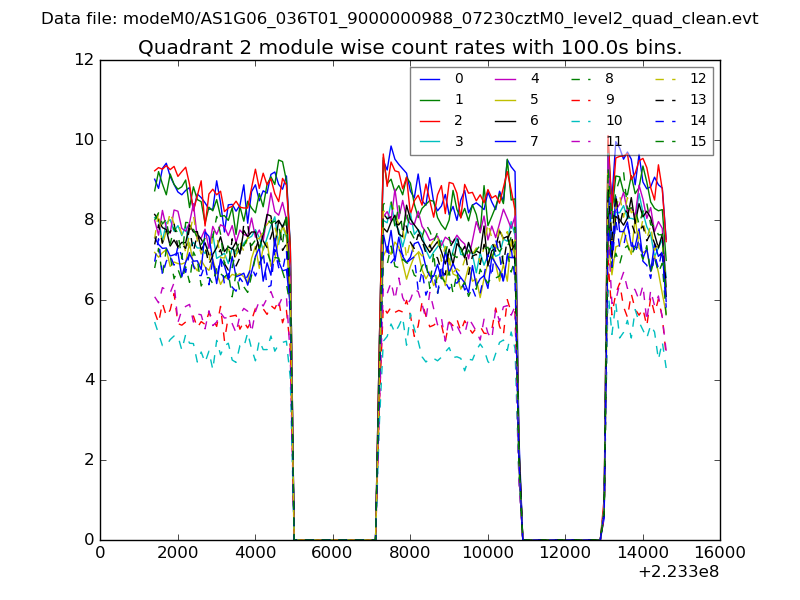
| Module-wise count rates for Quadrant B Data is divided into 100 sec bins |
 |
 |
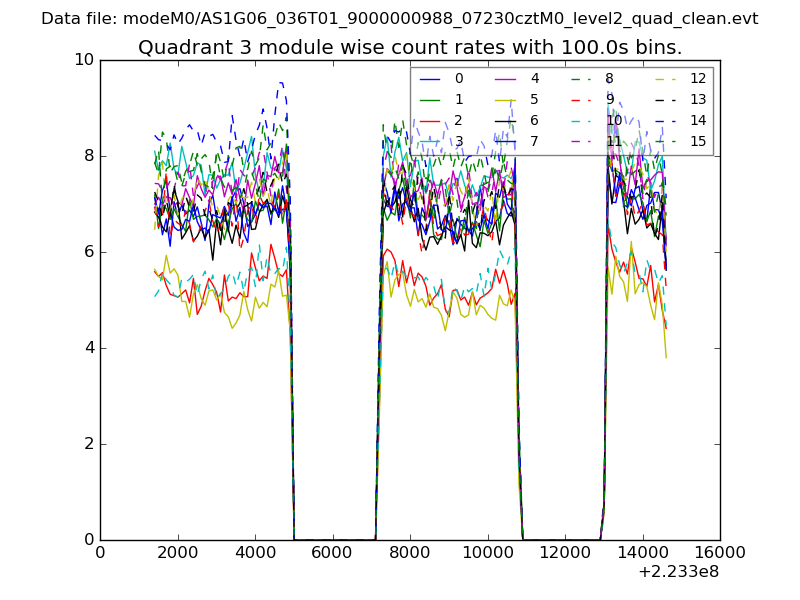
| Module-wise count rates for Quadrant C Data is divided into 100 sec bins |
 |
 |
| Module-wise count rates for Quadrant D Data is divided into 100 sec bins |
 |
 |
| Parameter | Plot |
|---|---|
| CZT HV Monitor |  |
| D_VDD | 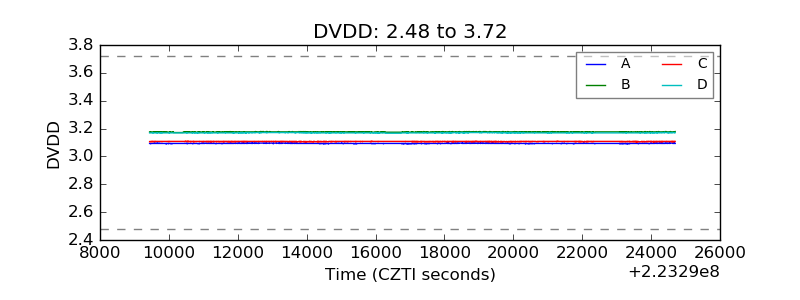 |
| Temperature 1 | 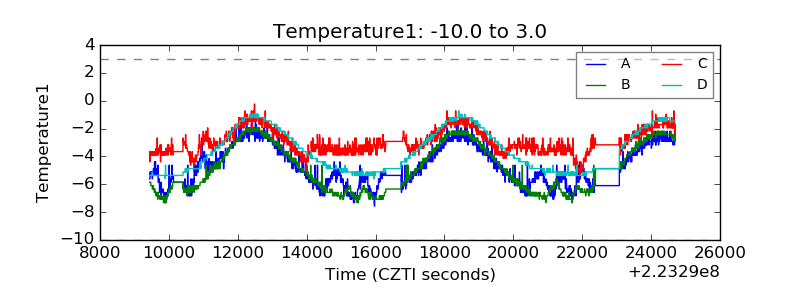 |
| Veto HV Monitor | 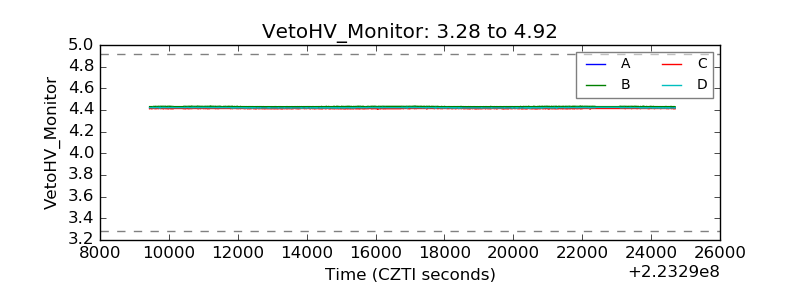 |
| Veto LLD | 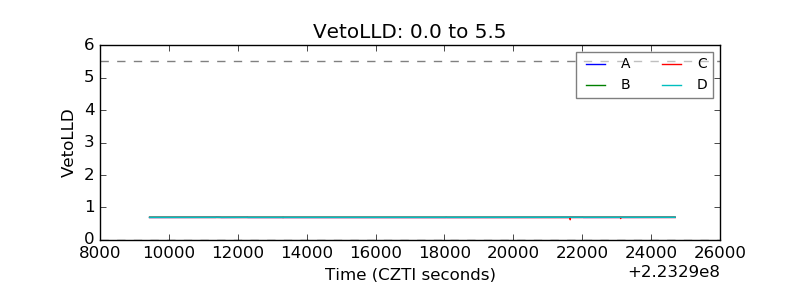 |
| Alpha Counter | 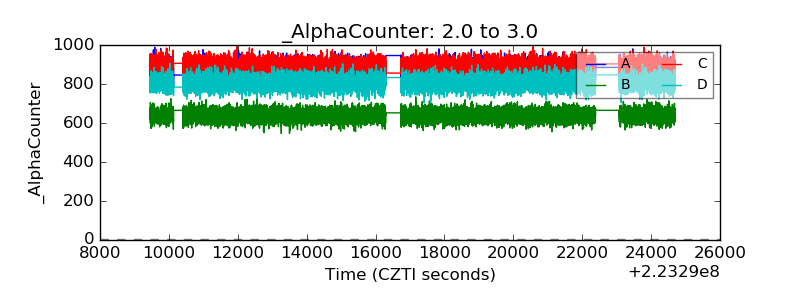 |
| _CPM_Rate | 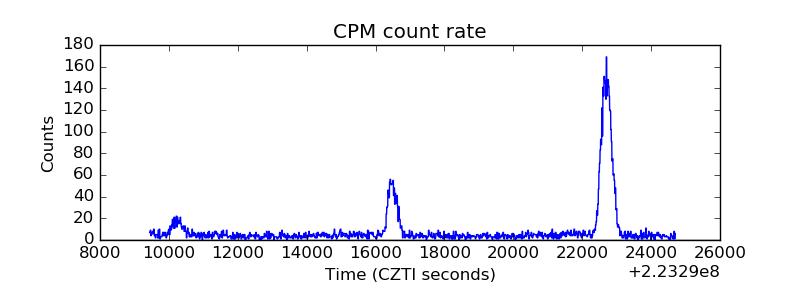 |
| CZT Counter | 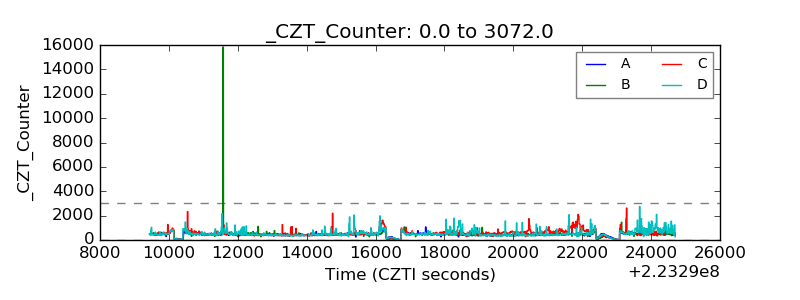 |
| +2.5 Volts monitor |  |
| +5 Volts monitor |  |
| _ROLL_ROT | 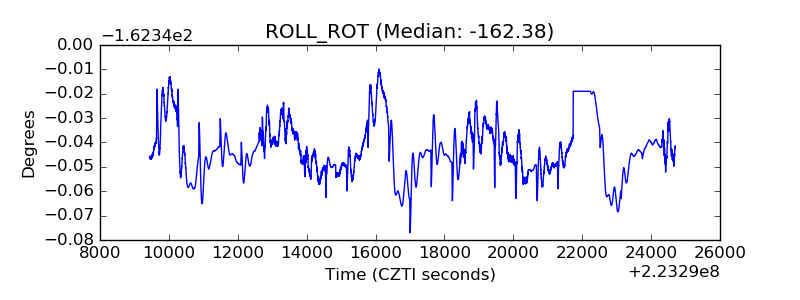 |
| _Roll_DEC | 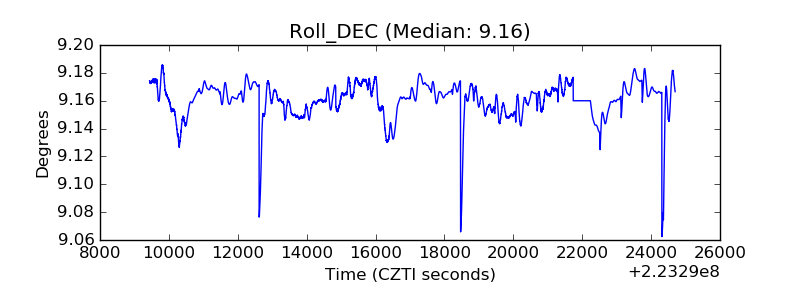 |
| _Roll_RA | 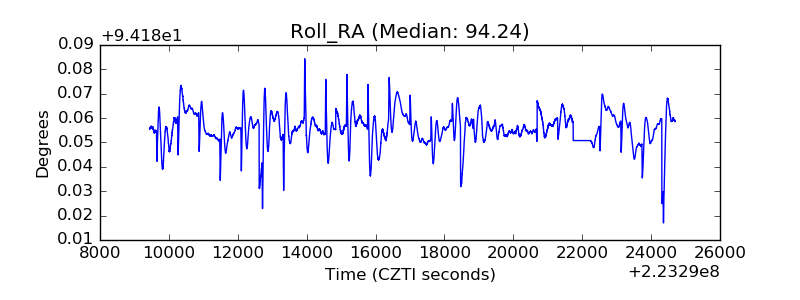 |
| Veto Counter |  |