| Param | Original file | Final file |
|---|---|---|
| Filename | modeM0/AS1G06_036T01_9000000988_07231cztM0_level2.evt | modeM0/AS1G06_036T01_9000000988_07231cztM0_level2_quad_clean.evt |
| Size (bytes) | 536,192,640 | 92,707,200 |
| Size | 511.4 MB | 88.4 MB |
| Events in quadrant A | 3,272,885 | 584,110 |
| Events in quadrant B | 3,756,300 | 595,212 |
| Events in quadrant C | 4,511,558 | 590,269 |
| Events in quadrant D | 4,234,372 | 561,395 |
| Mode M9 | |||
|---|---|---|---|
| Quadrant | BADHDUFLAG | Total packets | Discarded packets |
| A | 0 | 9 | 0 |
| B | 0 | 9 | 0 |
| C | 0 | 9 | 0 |
| D | 0 | 9 | 0 |
| Mode M0 | |||
|---|---|---|---|
| Quadrant | BADHDUFLAG | Total packets | Discarded packets |
| A | 0 | 14330 | 2 |
| B | 0 | 15551 | 1 |
| C | 0 | 17797 | 1 |
| D | 0 | 17526 | 1 |
| Mode SS | |||
|---|---|---|---|
| Quadrant | BADHDUFLAG | Total packets | Discarded packets |
| A | 0 | 138 | 0 |
| B | 0 | 138 | 0 |
| C | 0 | 138 | 0 |
| D | 0 | 138 | 0 |
| Quadrant | Total seconds | Saturated seconds | Saturation percentage |
|---|---|---|---|
| A | 6841 | 57 | 0.833212% |
| B | 6841 | 145 | 2.119573% |
| C | 6841 | 112 | 1.637188% |
| D | 6841 | 140 | 2.046484% |
Noise dominated data is calculated using 1-second bins in cleaned event files. If a bin has >2000 counts, and if more than 50% of those come from <1% of pixels, then it is considered to be noise-dominated and hence unusable.
| Quadrant | # 1 sec bins | Bins with >0 counts | Bins with >2000 counts | High rate bins dominated by noise | Noise dominated (total time) | Noise dominated (detector-on time) | Marked lightcurve |
|---|---|---|---|---|---|---|---|
| A | 7711 | 6841 | 1 | 1 | 0.01% | 0.01% | 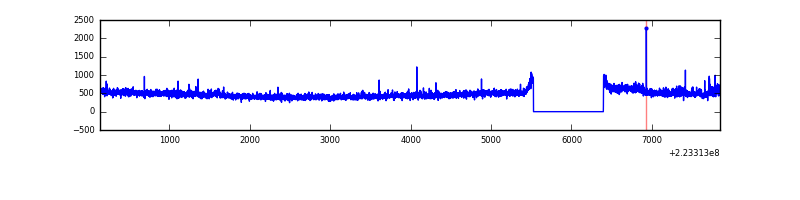 |
| B | 7711 | 6841 | 77 | 77 | 1.00% | 1.13% | 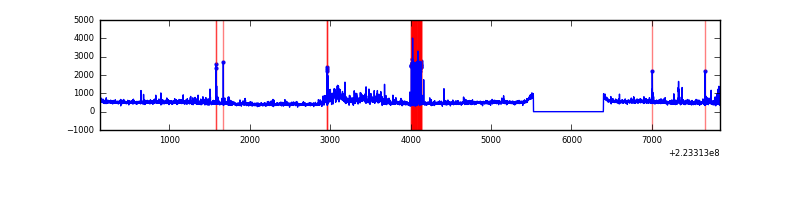 |
| C | 7711 | 6842 | 40 | 40 | 0.52% | 0.58% | 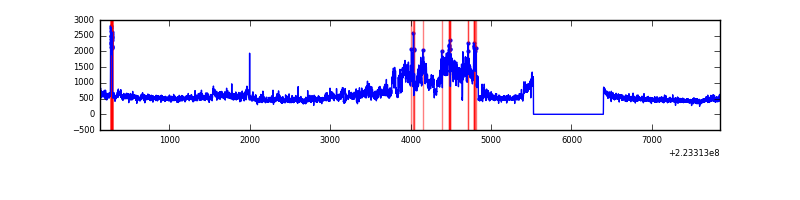 |
| D | 7711 | 6841 | 60 | 60 | 0.78% | 0.88% | 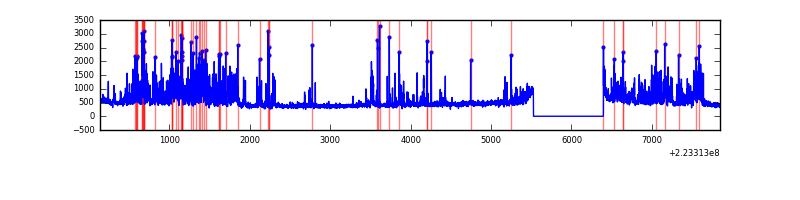 |
Top three noisy pixels from each quadrant. If the there are fewer than three noisy pixels in the level2.evt file, extra rows are filled as -1
| Pixel properties | Quadrant properties | ||||||
|---|---|---|---|---|---|---|---|
| Quadrant | DetID | PixID | Counts | Sigma | Mean | Median | Sigma |
| A | 8 | 15 | 161356 | 966.44 | 804 | 785 | 166.1 |
| A | 3 | 1 | 9622 | 53.19 | 804 | 785 | 166.1 |
| A | 15 | 174 | 8055 | 43.76 | 804 | 785 | 166.1 |
| B | 10 | 16 | 456158 | 2924.23 | 803 | 783 | 155.7 |
| B | 0 | 214 | 132823 | 847.91 | 803 | 783 | 155.7 |
| B | 12 | 111 | 15997 | 97.7 | 803 | 783 | 155.7 |
| C | 9 | 68 | 1475844 | 8094.83 | 776 | 779 | 182.2 |
| C | 10 | 22 | 6321 | 30.41 | 776 | 779 | 182.2 |
| C | 13 | 61 | 5981 | 28.55 | 776 | 779 | 182.2 |
| D | 2 | 216 | 996038 | 5166.5 | 778 | 753 | 192.6 |
| D | 14 | 34 | 153735 | 794.13 | 778 | 753 | 192.6 |
| D | 2 | 14 | 126070 | 650.52 | 778 | 753 | 192.6 |
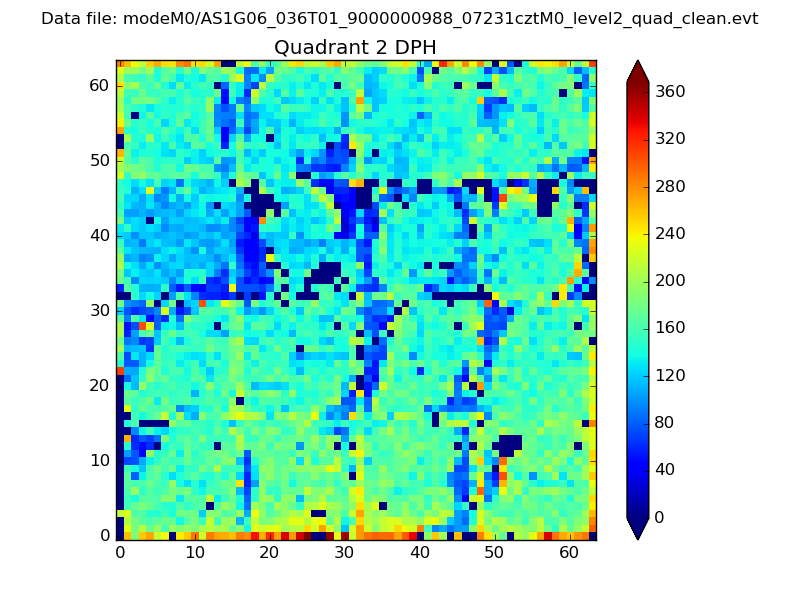
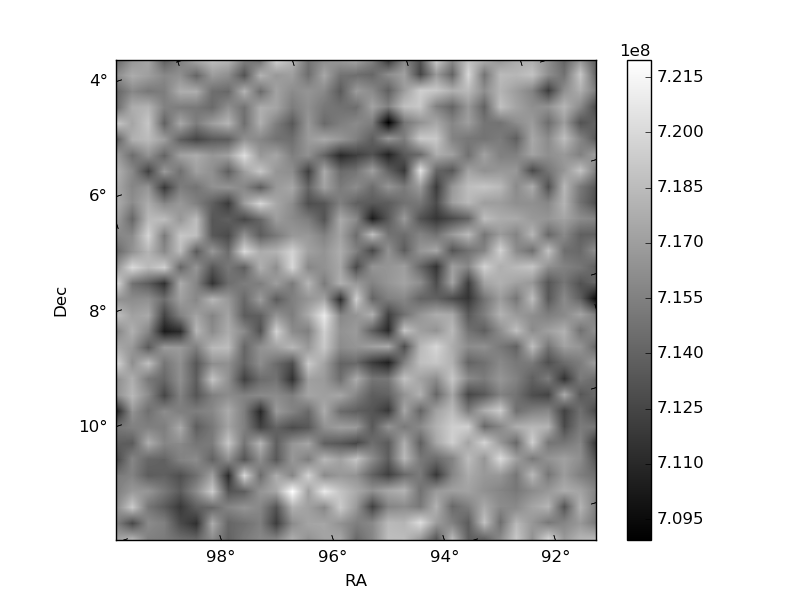
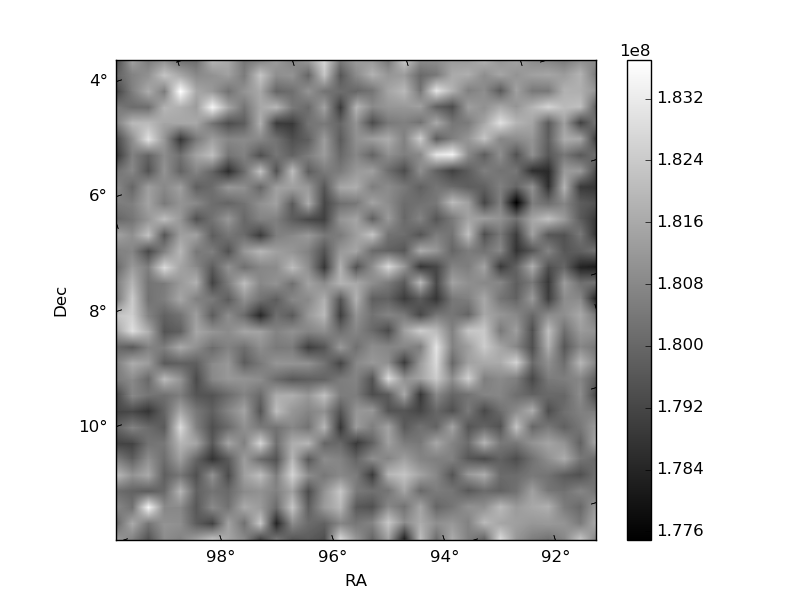
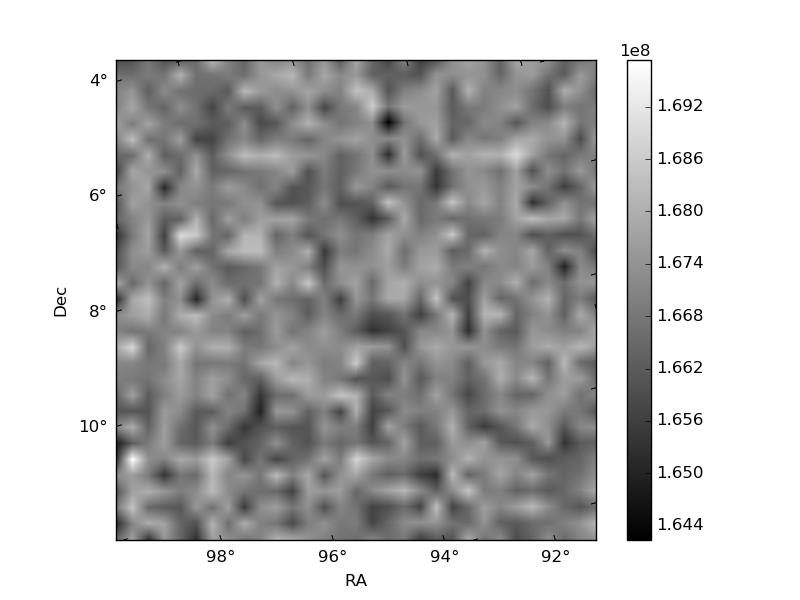
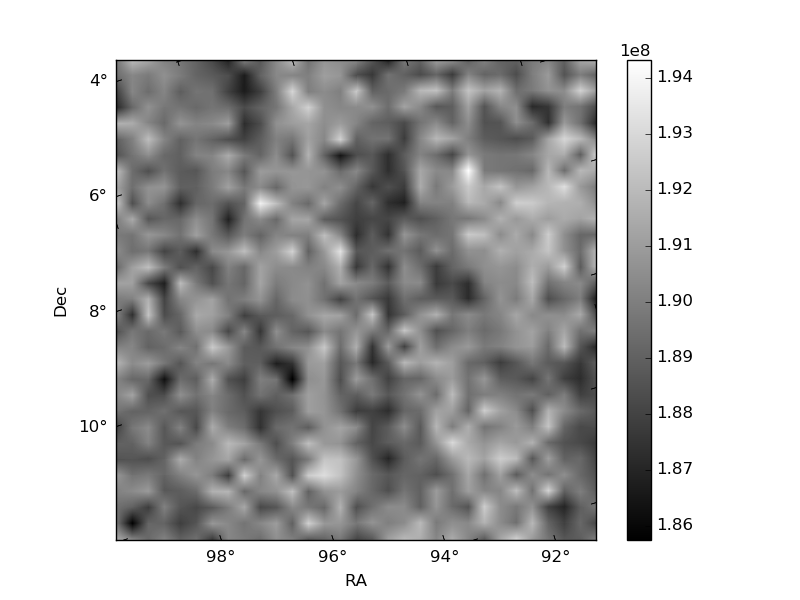
Histogram calculated using DETX and DETY for each event in the final _common_clean file
| Quadrant A | 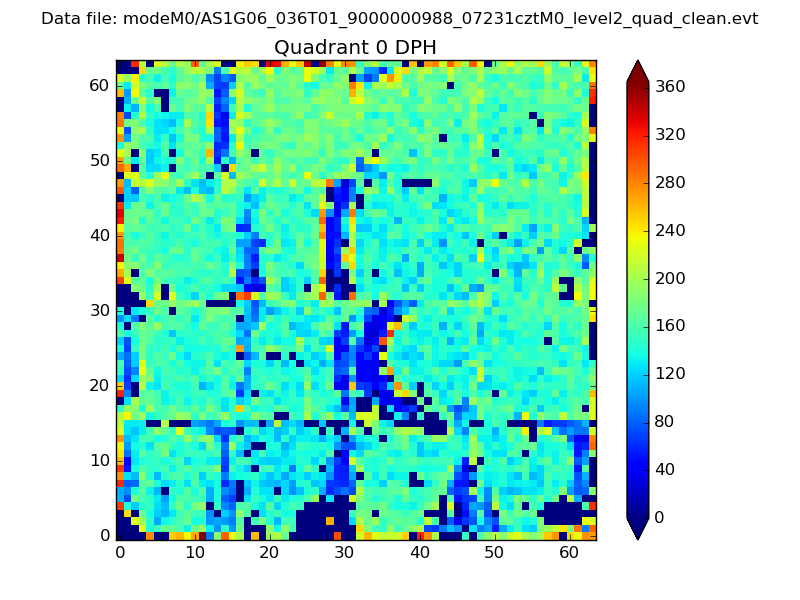 |
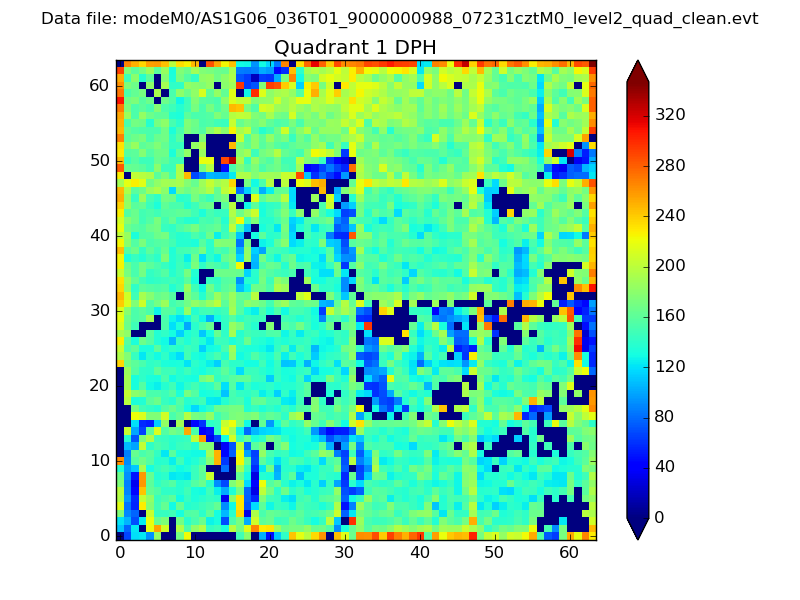 |
Quadrant B |
|---|---|---|---|
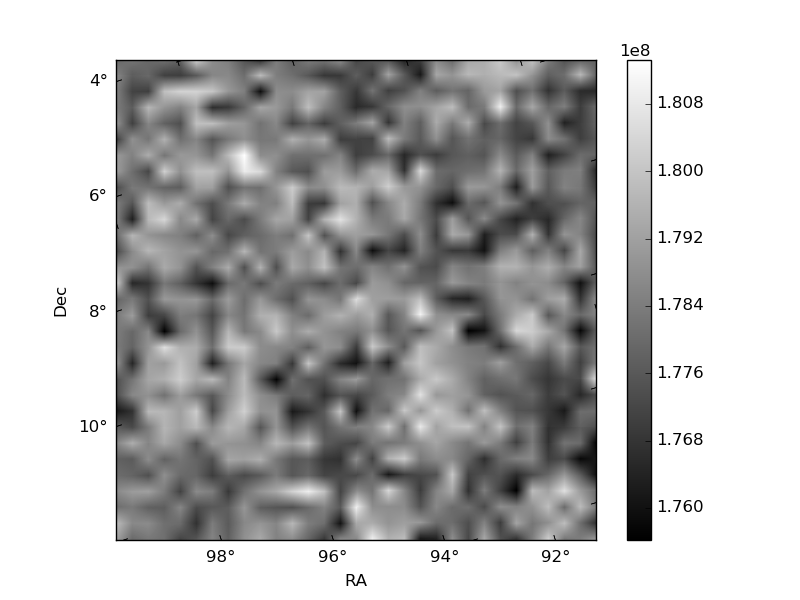
| Quadrant D | 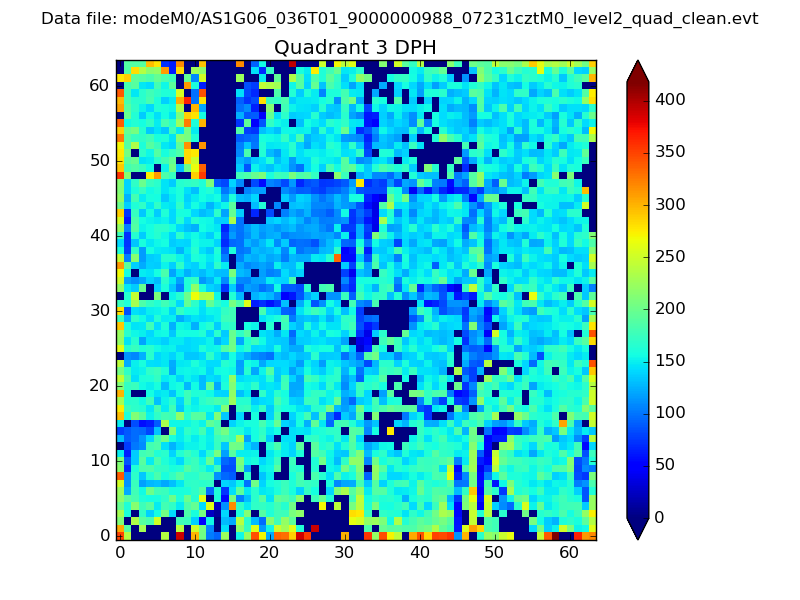 |
 |
Quadrant C |
| Plot type | Count rate plots | Images |
|---|---|---|
| Comparison with Poisson distribution Blue bars denote a histogram of data divided into 1 sec bins. Red curve is a Poisson curve with rate = median count rate of data. |
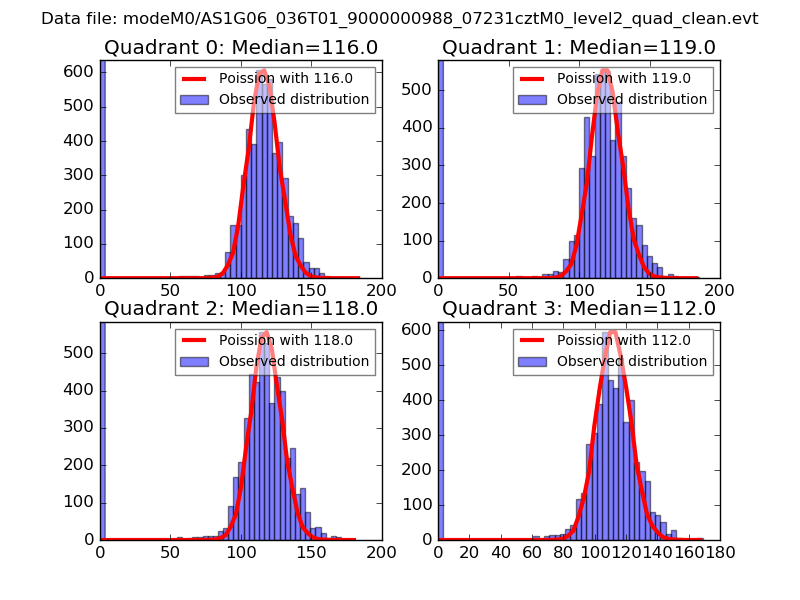 |
 |
| Quadrant-wise count rates Data is divided into 100 sec bins |
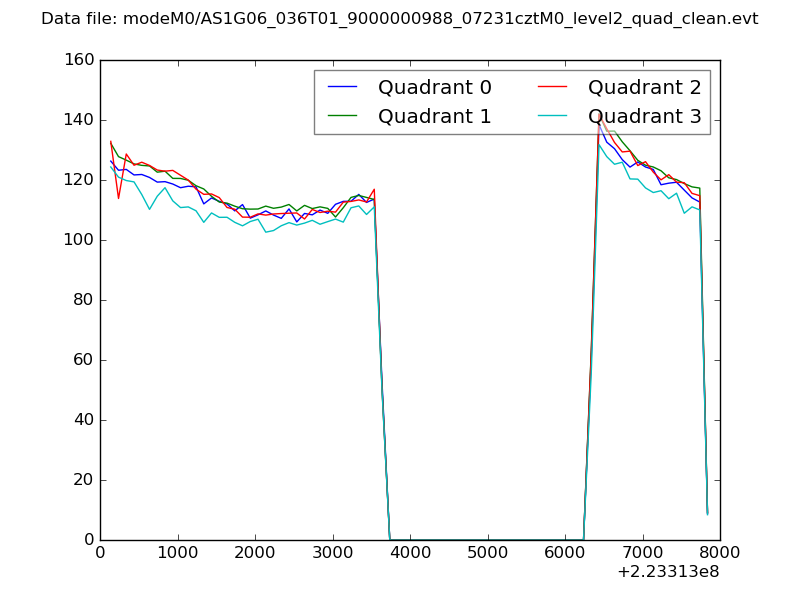 |
|
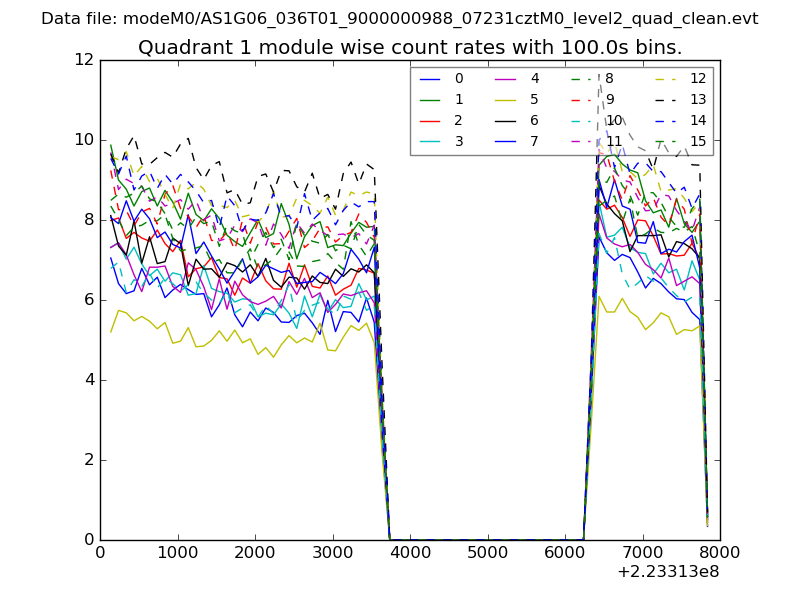
| Module-wise count rates for Quadrant A Data is divided into 100 sec bins |
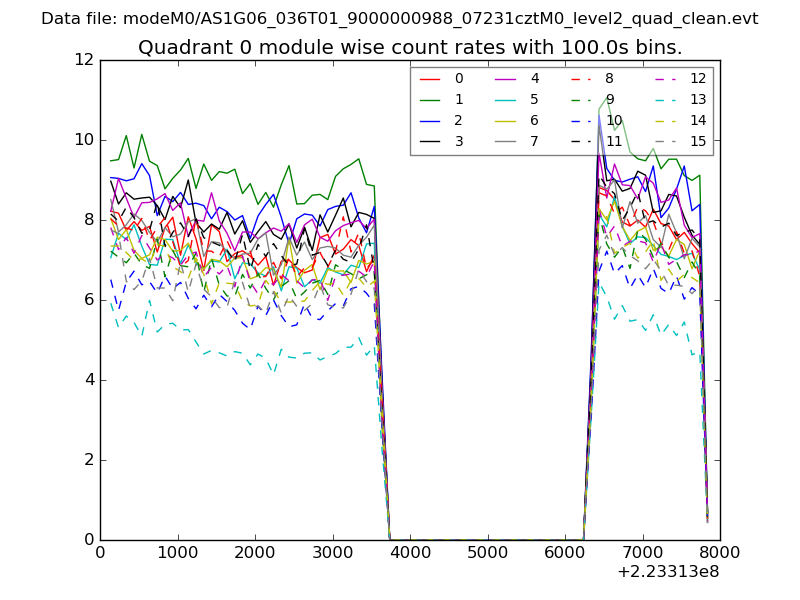 |
 |
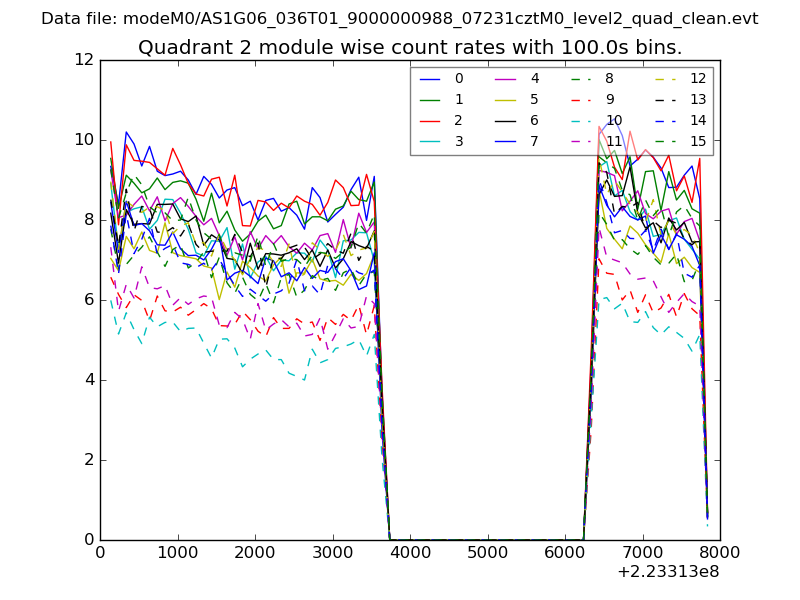
| Module-wise count rates for Quadrant B Data is divided into 100 sec bins |
 |
 |
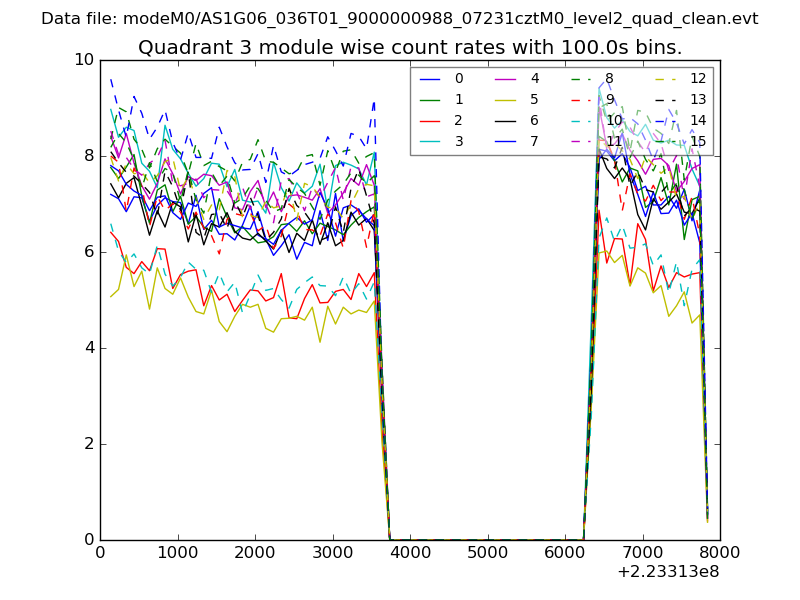
| Module-wise count rates for Quadrant C Data is divided into 100 sec bins |
 |
 |
| Module-wise count rates for Quadrant D Data is divided into 100 sec bins |
 |
 |
| Parameter | Plot |
|---|---|
| CZT HV Monitor | 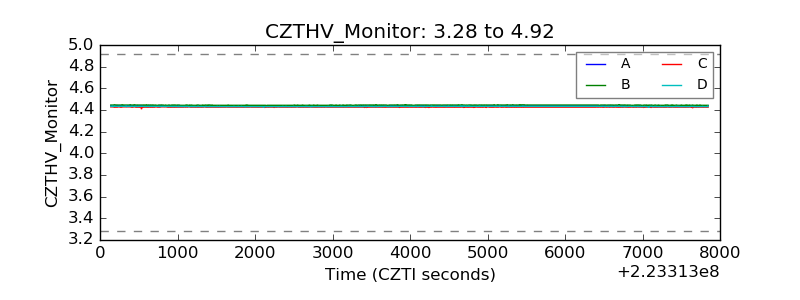 |
| D_VDD | 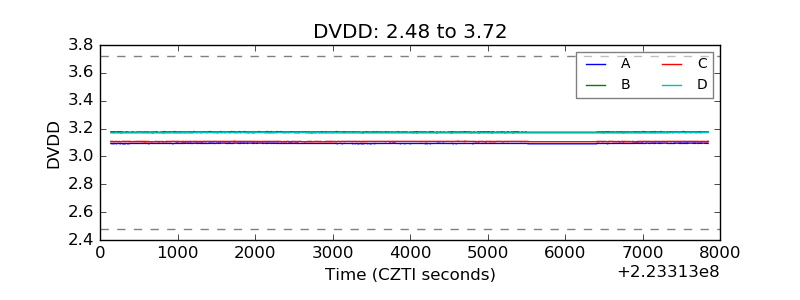 |
| Temperature 1 | 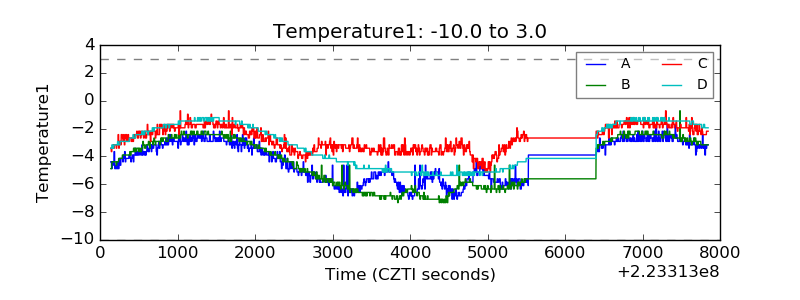 |
| Veto HV Monitor | 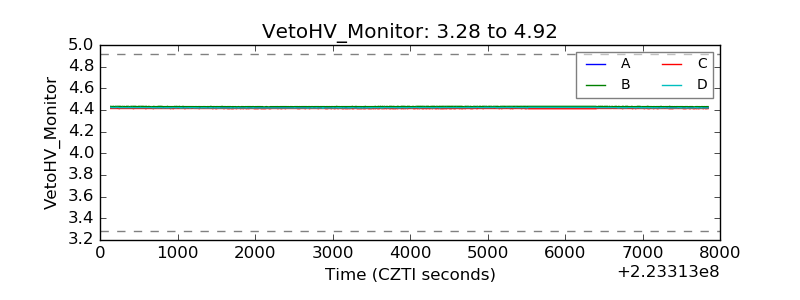 |
| Veto LLD | 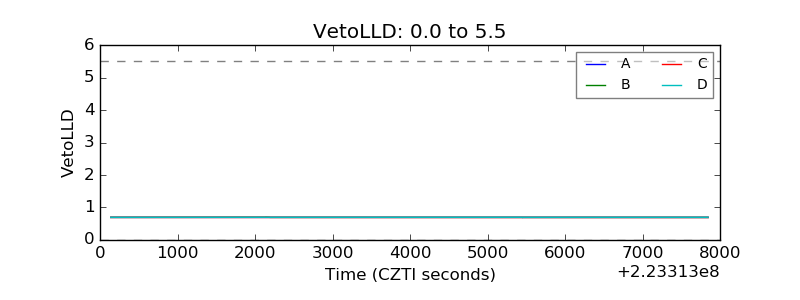 |
| Alpha Counter | 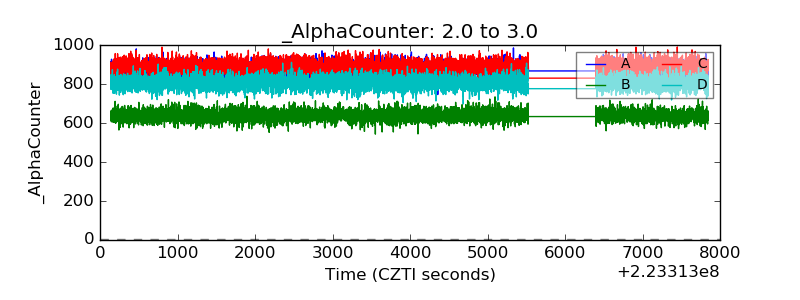 |
| _CPM_Rate | 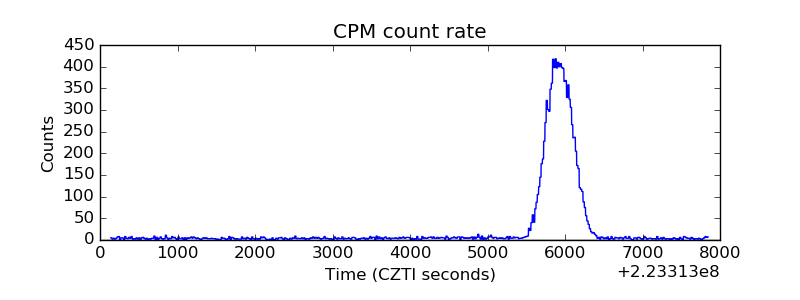 |
| CZT Counter | 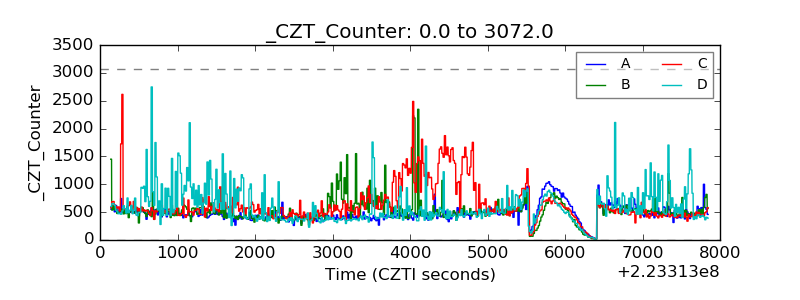 |
| +2.5 Volts monitor |  |
| +5 Volts monitor |  |
| _ROLL_ROT | 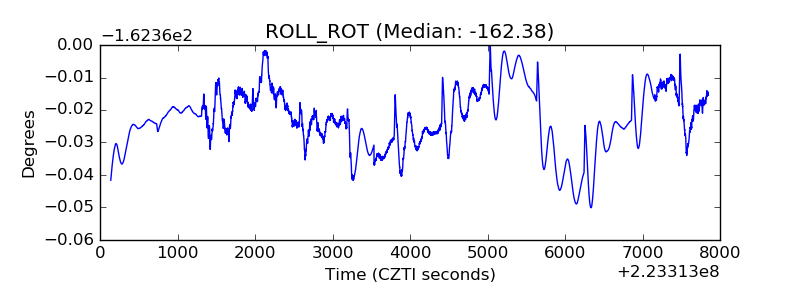 |
| _Roll_DEC | 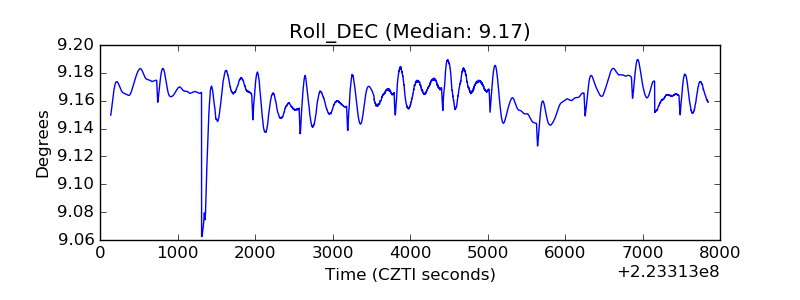 |
| _Roll_RA | 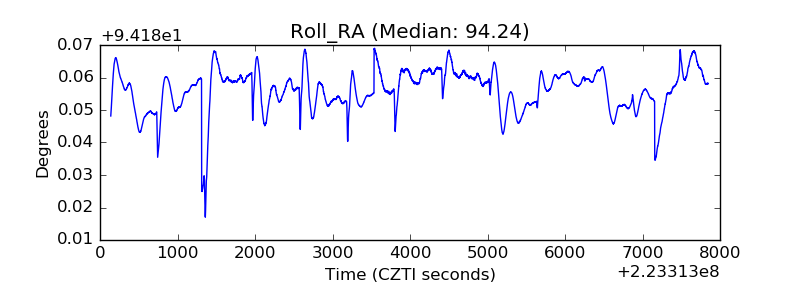 |
| Veto Counter | 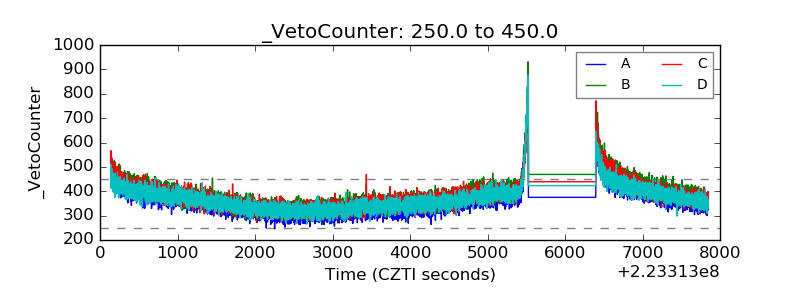 |