| Param | Original file | Final file |
|---|---|---|
| Filename | modeM0/AS1G06_036T01_9000000988_07232cztM0_level2.evt | modeM0/AS1G06_036T01_9000000988_07232cztM0_level2_quad_clean.evt |
| Size (bytes) | 519,171,840 | 86,400,000 |
| Size | 495.1 MB | 82.4 MB |
| Events in quadrant A | 3,348,630 | 544,922 |
| Events in quadrant B | 3,678,627 | 546,031 |
| Events in quadrant C | 4,266,169 | 545,703 |
| Events in quadrant D | 3,980,416 | 517,709 |
| Mode M9 | |||
|---|---|---|---|
| Quadrant | BADHDUFLAG | Total packets | Discarded packets |
| A | 0 | 10 | 0 |
| B | 0 | 10 | 0 |
| C | 0 | 10 | 0 |
| D | 0 | 10 | 0 |
| Mode M0 | |||
|---|---|---|---|
| Quadrant | BADHDUFLAG | Total packets | Discarded packets |
| A | 0 | 14555 | 3 |
| B | 0 | 15436 | 2 |
| C | 0 | 17333 | 2 |
| D | 0 | 16660 | 2 |
| Mode SS | |||
|---|---|---|---|
| Quadrant | BADHDUFLAG | Total packets | Discarded packets |
| A | 0 | 134 | 0 |
| B | 0 | 134 | 0 |
| C | 0 | 134 | 0 |
| D | 0 | 134 | 0 |
| Quadrant | Total seconds | Saturated seconds | Saturation percentage |
|---|---|---|---|
| A | 6627 | 56 | 0.845028% |
| B | 6627 | 219 | 3.304663% |
| C | 6627 | 47 | 0.709220% |
| D | 6627 | 162 | 2.444545% |
Noise dominated data is calculated using 1-second bins in cleaned event files. If a bin has >2000 counts, and if more than 50% of those come from <1% of pixels, then it is considered to be noise-dominated and hence unusable.
| Quadrant | # 1 sec bins | Bins with >0 counts | Bins with >2000 counts | High rate bins dominated by noise | Noise dominated (total time) | Noise dominated (detector-on time) | Marked lightcurve |
|---|---|---|---|---|---|---|---|
| A | 7657 | 6627 | 1 | 1 | 0.01% | 0.02% | 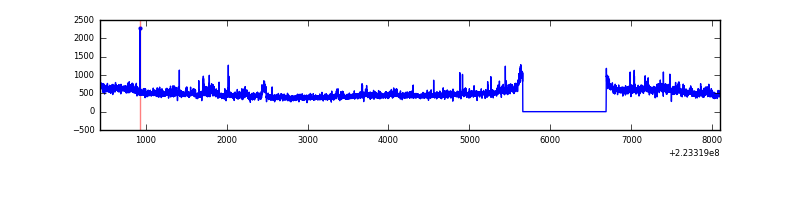 |
| B | 7657 | 6628 | 156 | 156 | 2.04% | 2.35% | 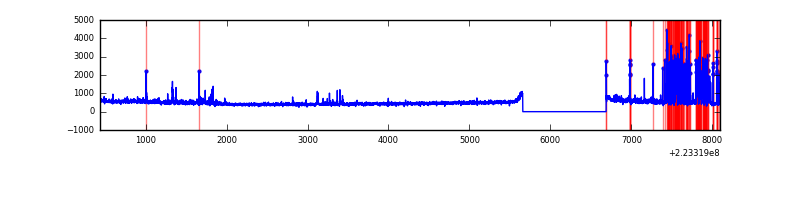 |
| C | 7657 | 6627 | 8 | 8 | 0.10% | 0.12% | 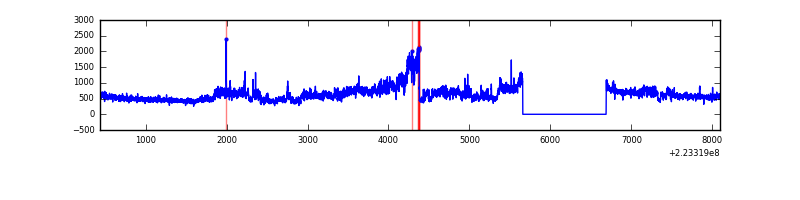 |
| D | 7657 | 6627 | 102 | 102 | 1.33% | 1.54% | 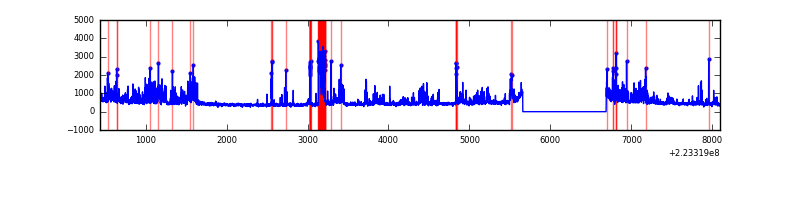 |
Top three noisy pixels from each quadrant. If the there are fewer than three noisy pixels in the level2.evt file, extra rows are filled as -1
| Pixel properties | Quadrant properties | ||||||
|---|---|---|---|---|---|---|---|
| Quadrant | DetID | PixID | Counts | Sigma | Mean | Median | Sigma |
| A | 8 | 15 | 308281 | 1937.66 | 780 | 763 | 158.7 |
| A | 3 | 1 | 17151 | 103.26 | 780 | 763 | 158.7 |
| A | 14 | 111 | 14999 | 89.7 | 780 | 763 | 158.7 |
| B | 4 | 81 | 520568 | 3479.57 | 776 | 756 | 149.4 |
| B | 0 | 214 | 115482 | 767.96 | 776 | 756 | 149.4 |
| B | 12 | 111 | 15103 | 96.03 | 776 | 756 | 149.4 |
| C | 9 | 68 | 1325209 | 7525.08 | 753 | 756 | 176.0 |
| C | 13 | 61 | 5683 | 27.99 | 753 | 756 | 176.0 |
| C | 8 | 222 | 2670 | 10.87 | 753 | 756 | 176.0 |
| D | 2 | 216 | 630609 | 3387.55 | 754 | 729 | 185.9 |
| D | 13 | 137 | 267452 | 1434.46 | 754 | 729 | 185.9 |
| D | 14 | 34 | 109333 | 584.08 | 754 | 729 | 185.9 |
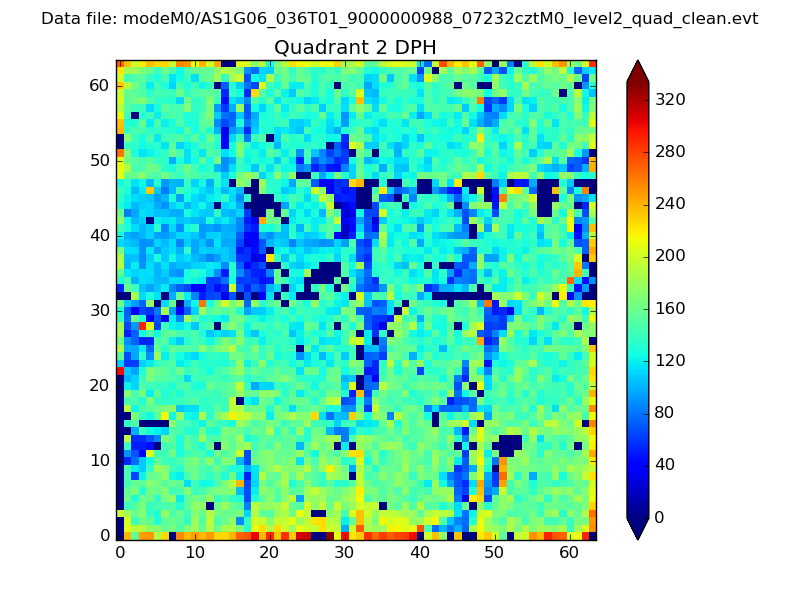
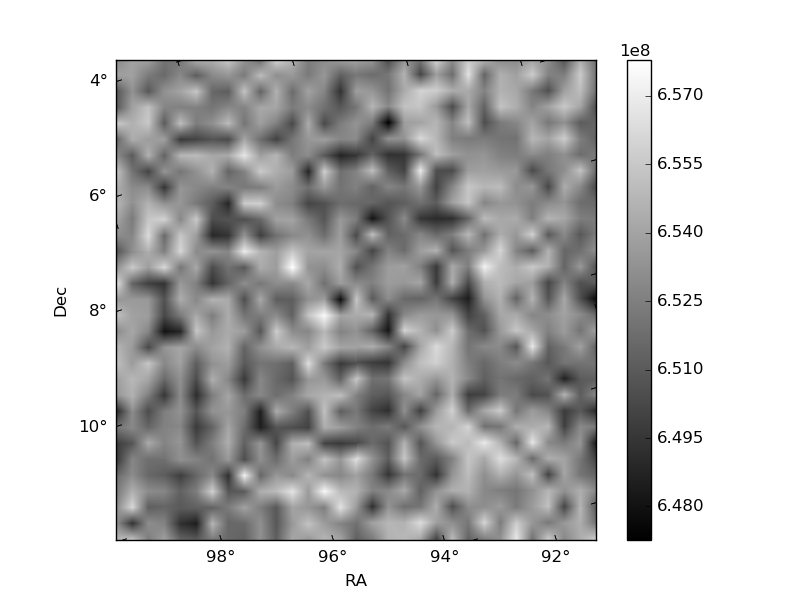
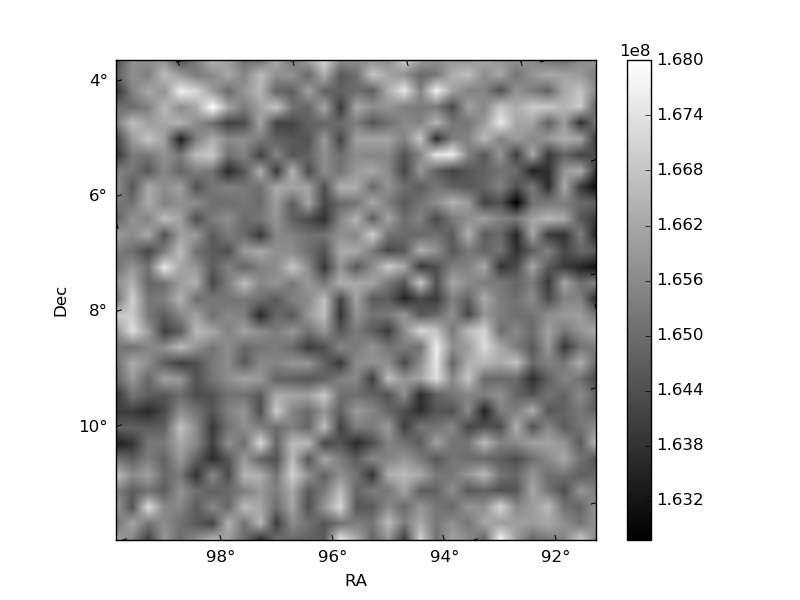
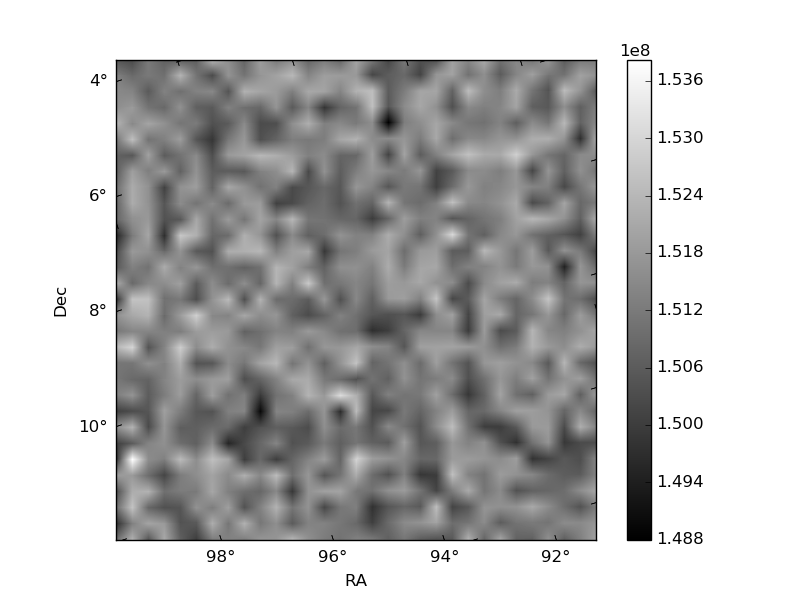
Histogram calculated using DETX and DETY for each event in the final _common_clean file
| Quadrant A | 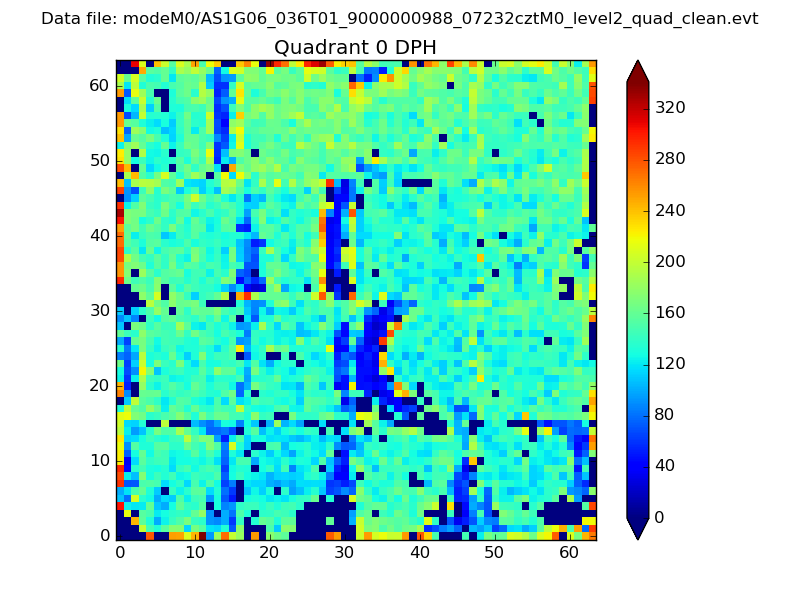 |
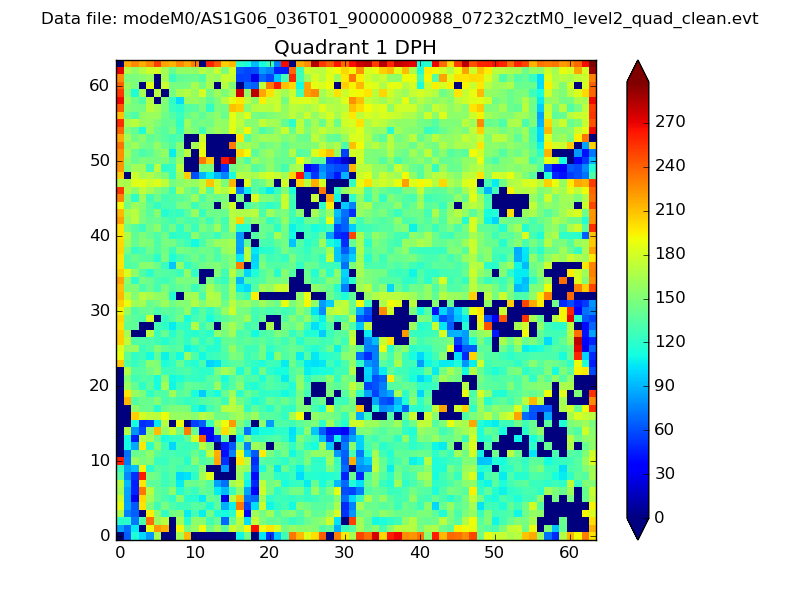 |
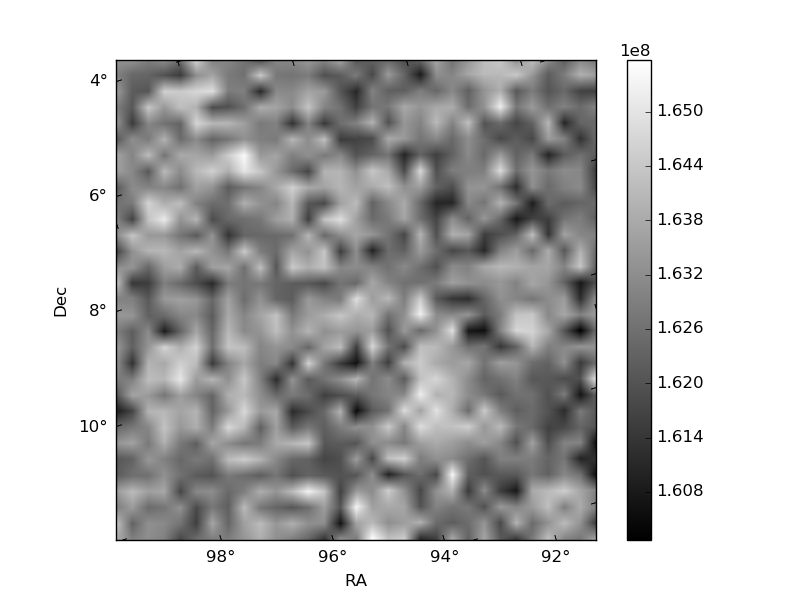
Quadrant B |
|---|---|---|---|
| Quadrant D | 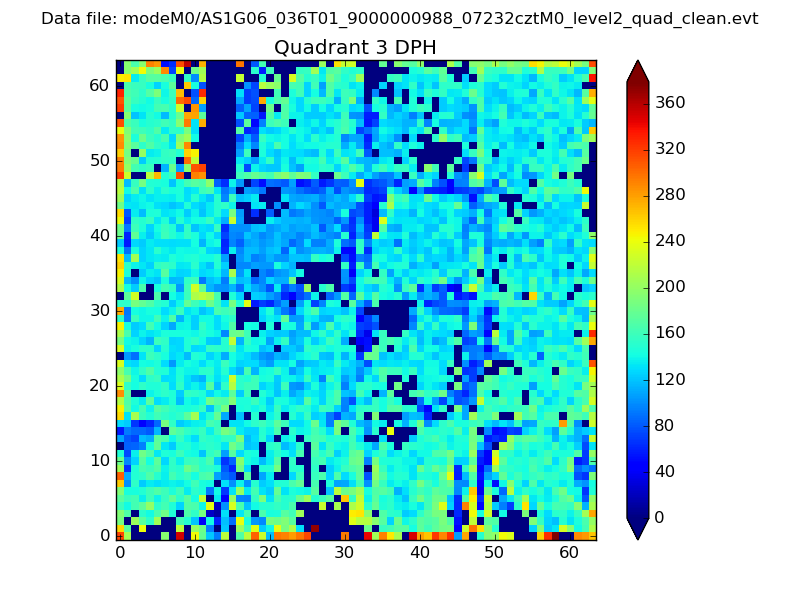 |
 |
Quadrant C |
| Plot type | Count rate plots | Images |
|---|---|---|
| Comparison with Poisson distribution Blue bars denote a histogram of data divided into 1 sec bins. Red curve is a Poisson curve with rate = median count rate of data. |
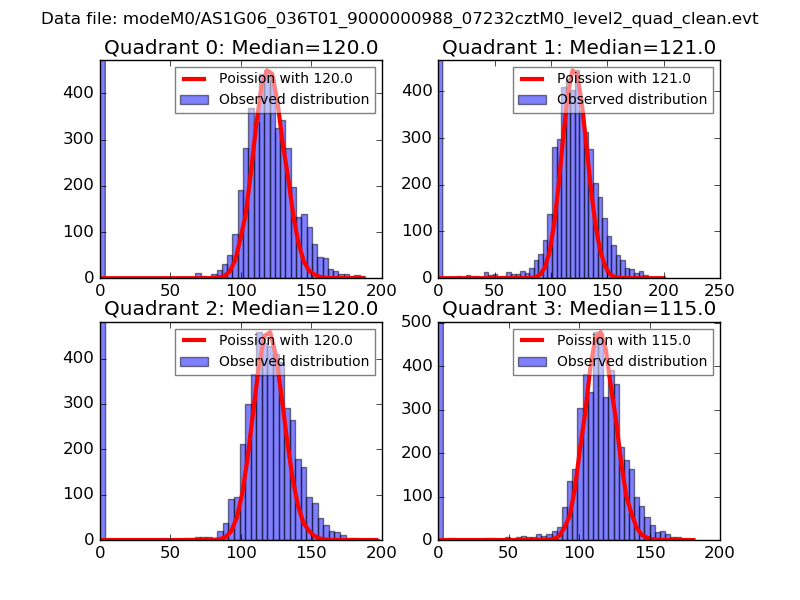 |
 |
| Quadrant-wise count rates Data is divided into 100 sec bins |
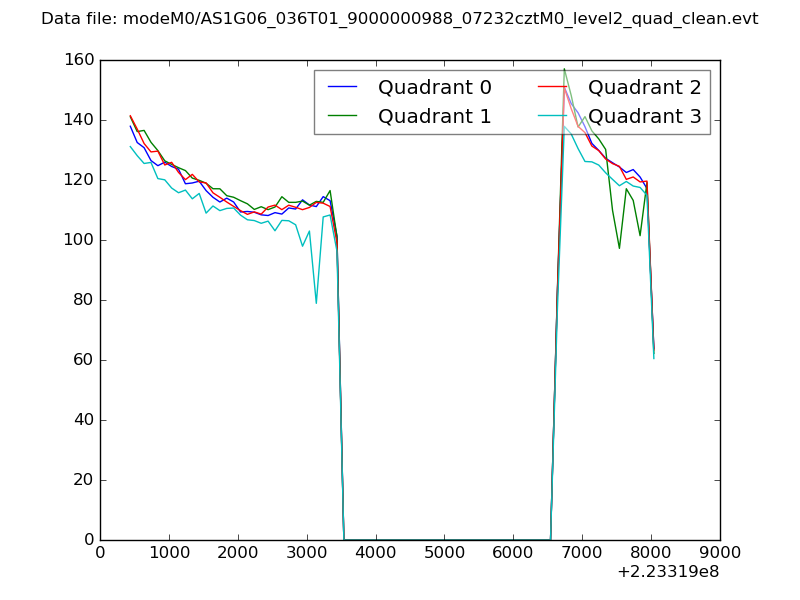 |
|
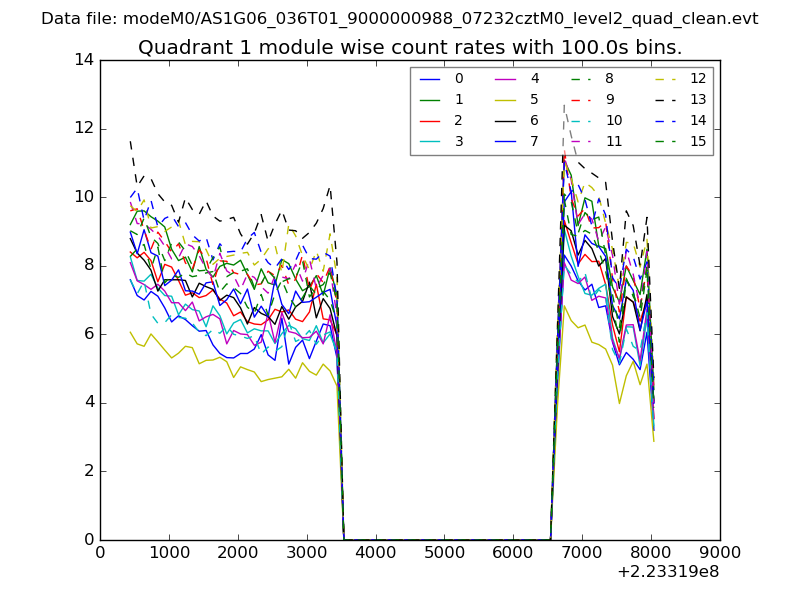
| Module-wise count rates for Quadrant A Data is divided into 100 sec bins |
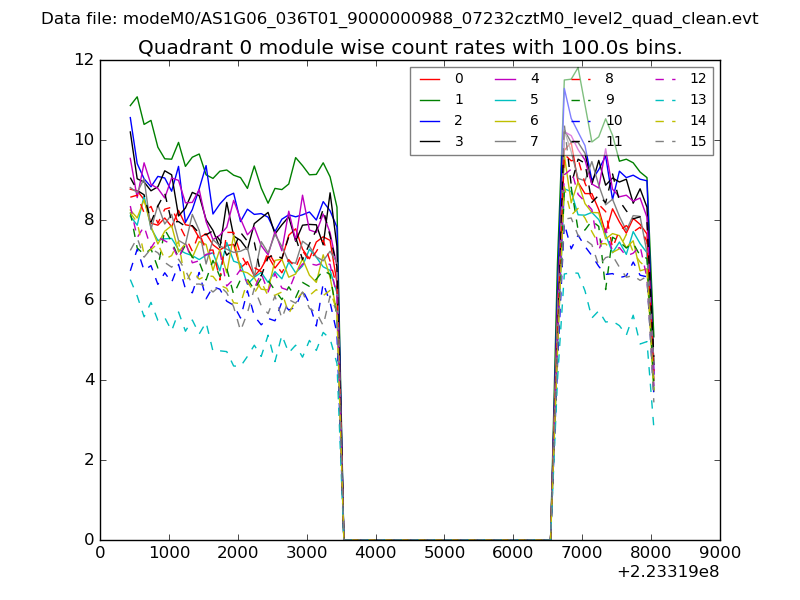 |
 |
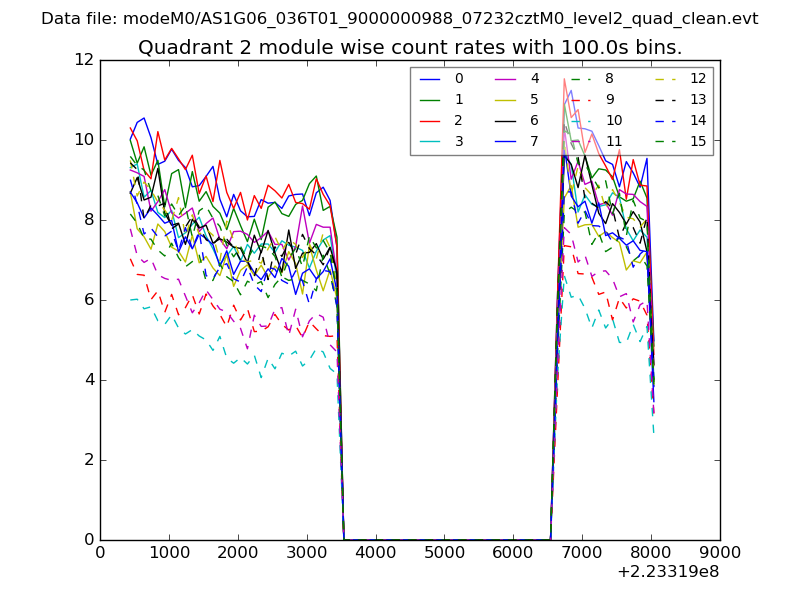
| Module-wise count rates for Quadrant B Data is divided into 100 sec bins |
 |
 |
| Module-wise count rates for Quadrant C Data is divided into 100 sec bins |
 |
 |
| Module-wise count rates for Quadrant D Data is divided into 100 sec bins |
 |
 |
| Parameter | Plot |
|---|---|
| CZT HV Monitor | 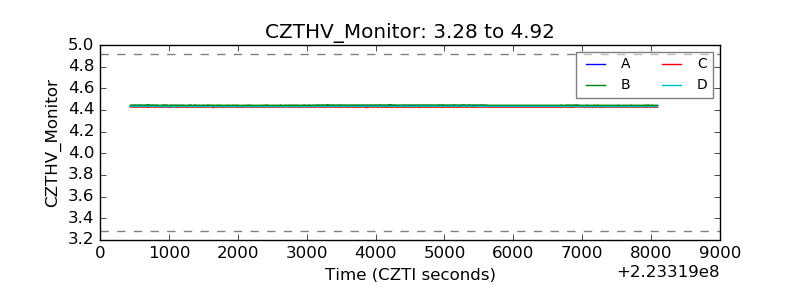 |
| D_VDD | 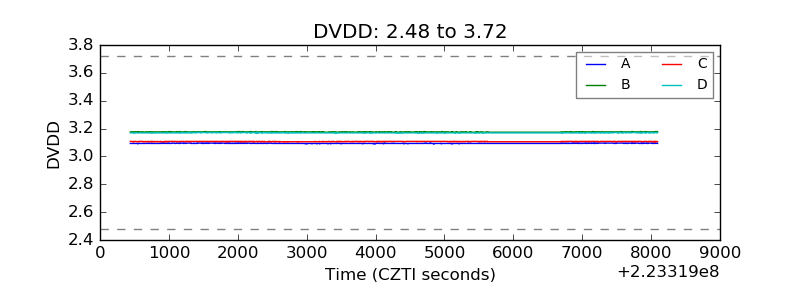 |
| Temperature 1 | 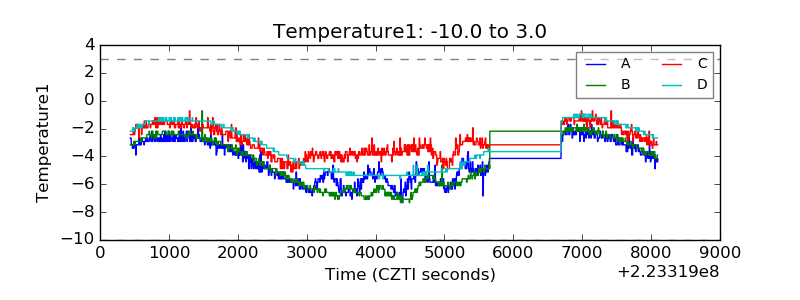 |
| Veto HV Monitor | 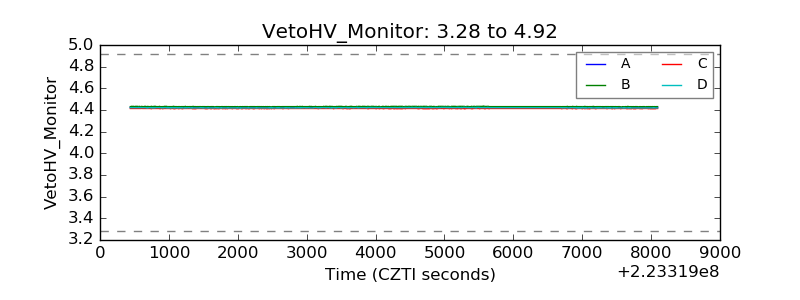 |
| Veto LLD | 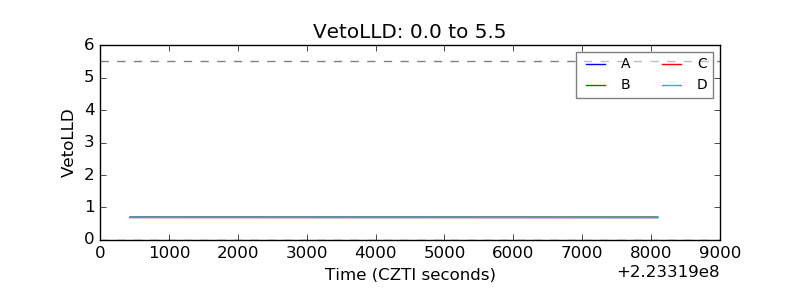 |
| Alpha Counter | 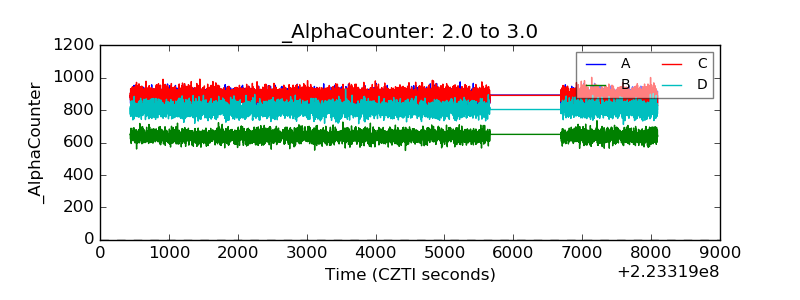 |
| _CPM_Rate | 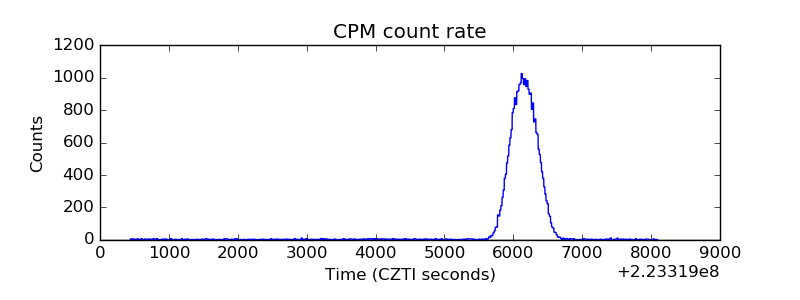 |
| CZT Counter | 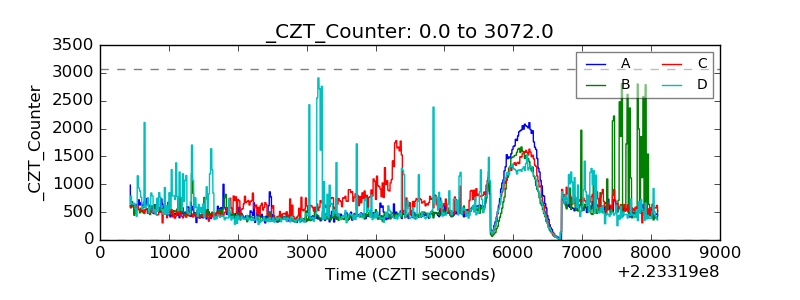 |
| +2.5 Volts monitor |  |
| +5 Volts monitor |  |
| _ROLL_ROT | 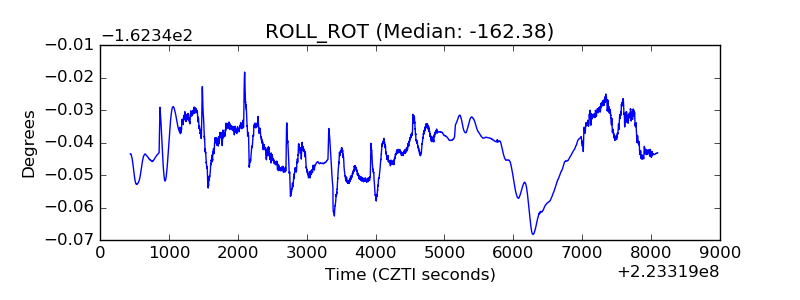 |
| _Roll_DEC | 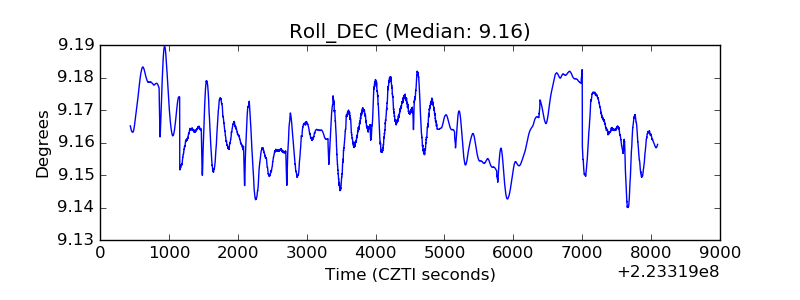 |
| _Roll_RA | 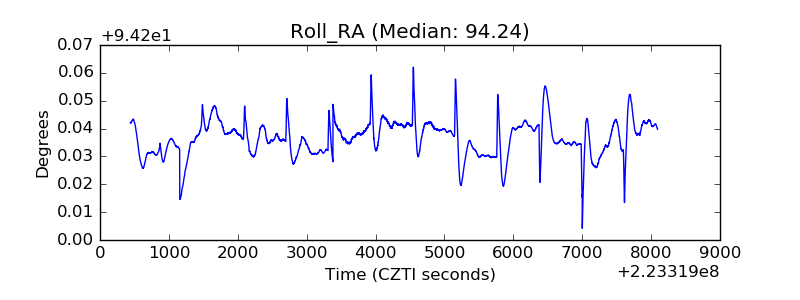 |
| Veto Counter | 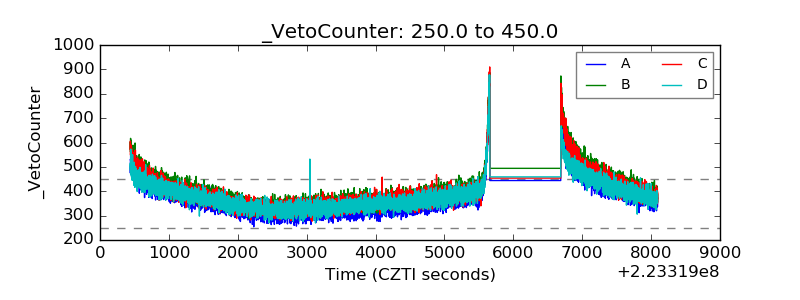 |