| Param | Original file | Final file |
|---|---|---|
| Filename | modeM0/AS1G06_036T01_9000000988_07234cztM0_level2.evt | modeM0/AS1G06_036T01_9000000988_07234cztM0_level2_quad_clean.evt |
| Size (bytes) | 106,378,560 | 22,389,120 |
| Size | 101.5 MB | 21.4 MB |
| Events in quadrant A | 664,184 | 150,074 |
| Events in quadrant B | 1,073,901 | 143,882 |
| Events in quadrant C | 732,952 | 148,948 |
| Events in quadrant D | 666,692 | 144,460 |
| Mode M0 | |||
|---|---|---|---|
| Quadrant | BADHDUFLAG | Total packets | Discarded packets |
| A | 0 | 2754 | 0 |
| B | 0 | 3951 | 0 |
| C | 0 | 2960 | 0 |
| D | 0 | 2794 | 0 |
| Mode SS | |||
|---|---|---|---|
| Quadrant | BADHDUFLAG | Total packets | Discarded packets |
| A | 0 | 24 | 0 |
| B | 0 | 24 | 0 |
| C | 0 | 24 | 0 |
| D | 0 | 24 | 0 |
| Quadrant | Total seconds | Saturated seconds | Saturation percentage |
|---|---|---|---|
| A | 1190 | 2 | 0.168067% |
| B | 1190 | 173 | 14.537815% |
| C | 1190 | 1 | 0.084034% |
| D | 1190 | 5 | 0.420168% |
Noise dominated data is calculated using 1-second bins in cleaned event files. If a bin has >2000 counts, and if more than 50% of those come from <1% of pixels, then it is considered to be noise-dominated and hence unusable.
| Quadrant | # 1 sec bins | Bins with >0 counts | Bins with >2000 counts | High rate bins dominated by noise | Noise dominated (total time) | Noise dominated (detector-on time) | Marked lightcurve |
|---|---|---|---|---|---|---|---|
| A | 1190 | 1190 | 0 | 0 | 0.00% | 0.00% | 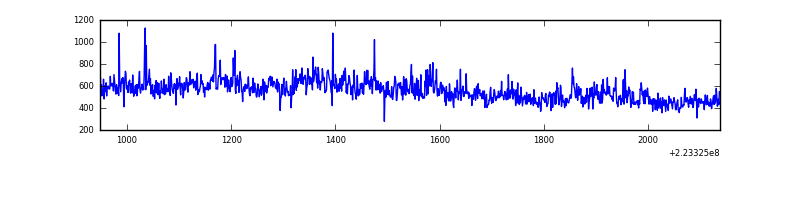 |
| B | 1190 | 1190 | 154 | 154 | 12.94% | 12.94% | 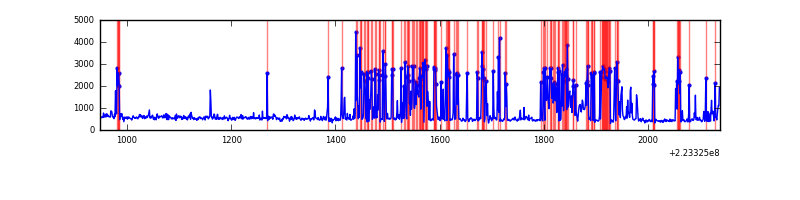 |
| C | 1190 | 1190 | 0 | 0 | 0.00% | 0.00% | 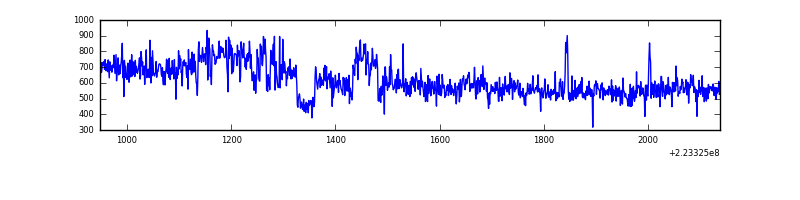 |
| D | 1190 | 1190 | 2 | 2 | 0.17% | 0.17% | 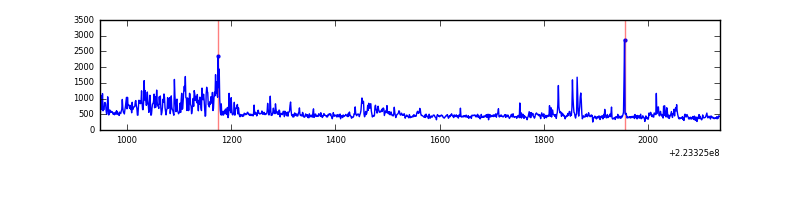 |
Top three noisy pixels from each quadrant. If the there are fewer than three noisy pixels in the level2.evt file, extra rows are filled as -1
| Pixel properties | Quadrant properties | ||||||
|---|---|---|---|---|---|---|---|
| Quadrant | DetID | PixID | Counts | Sigma | Mean | Median | Sigma |
| A | 8 | 15 | 103644 | 3276.16 | 144 | 141 | 31.6 |
| A | 3 | 1 | 2577 | 77.11 | 144 | 141 | 31.6 |
| A | 0 | 226 | 1433 | 40.9 | 144 | 141 | 31.6 |
| B | 4 | 81 | 511591 | 18658.09 | 135 | 132 | 27.4 |
| B | 0 | 214 | 33665 | 1223.29 | 135 | 132 | 27.4 |
| B | 0 | 229 | 2502 | 86.46 | 135 | 132 | 27.4 |
| C | 9 | 68 | 200329 | 6004.38 | 136 | 136 | 33.3 |
| C | 13 | 61 | 1032 | 26.87 | 136 | 136 | 33.3 |
| C | 8 | 222 | 504 | 11.04 | 136 | 136 | 33.3 |
| D | 2 | 216 | 97804 | 2761.49 | 138 | 134 | 35.4 |
| D | 14 | 34 | 36023 | 1014.71 | 138 | 134 | 35.4 |
| D | 2 | 33 | 8582 | 238.86 | 138 | 134 | 35.4 |
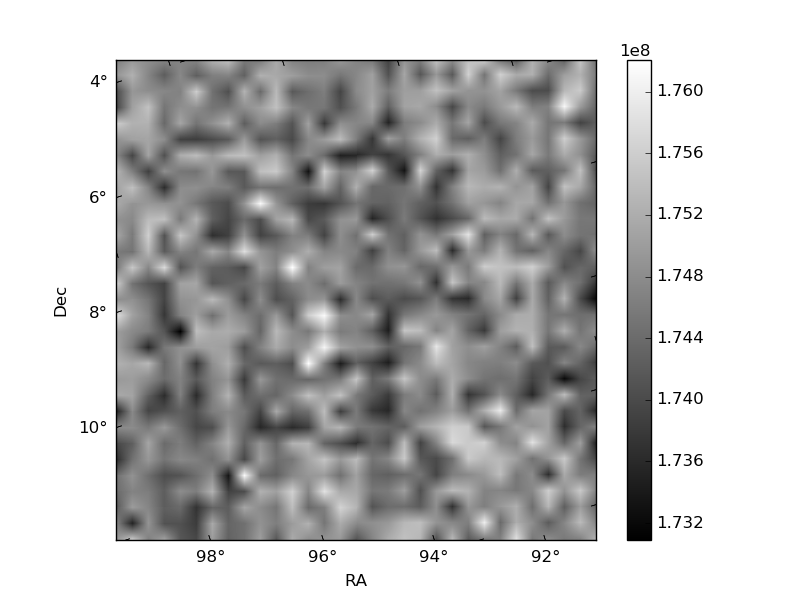
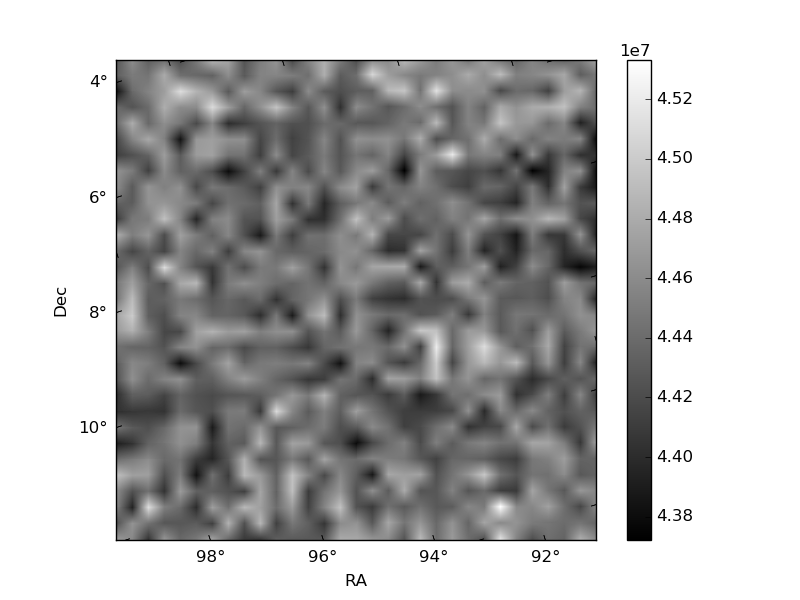
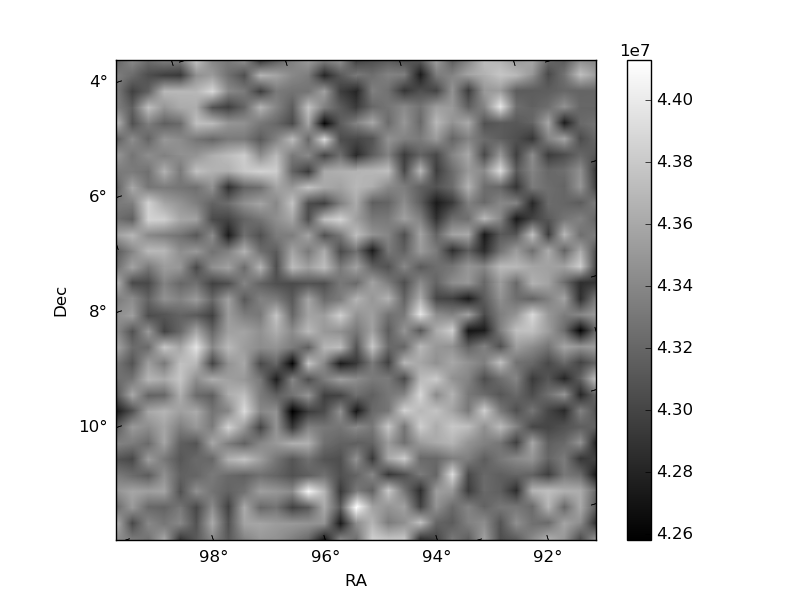
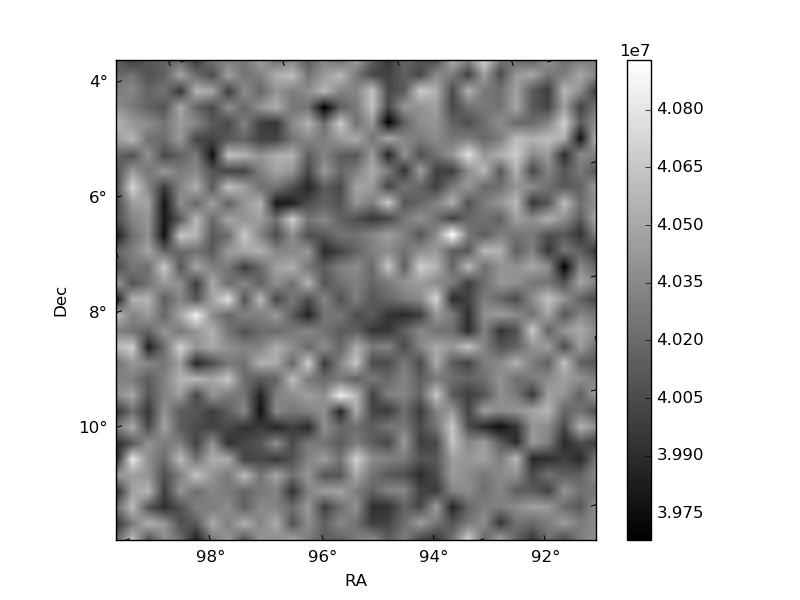
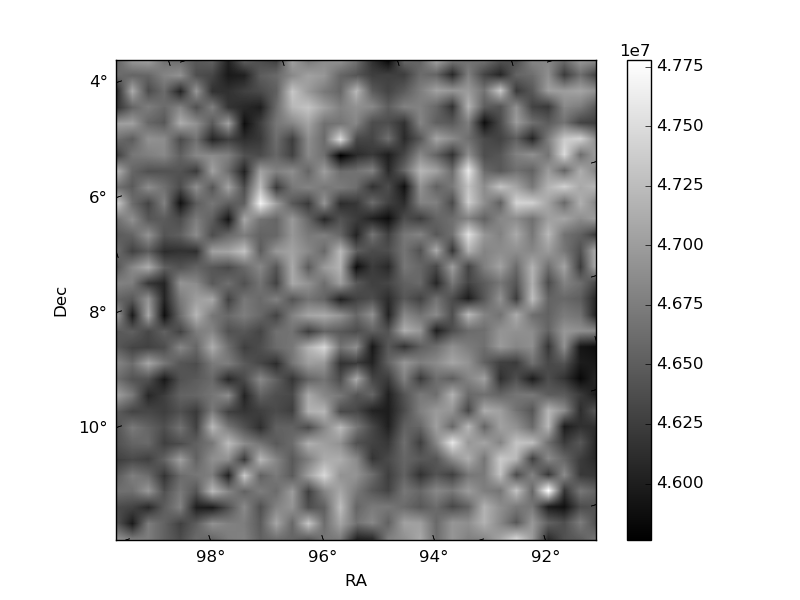
Histogram calculated using DETX and DETY for each event in the final _common_clean file
| Quadrant A | 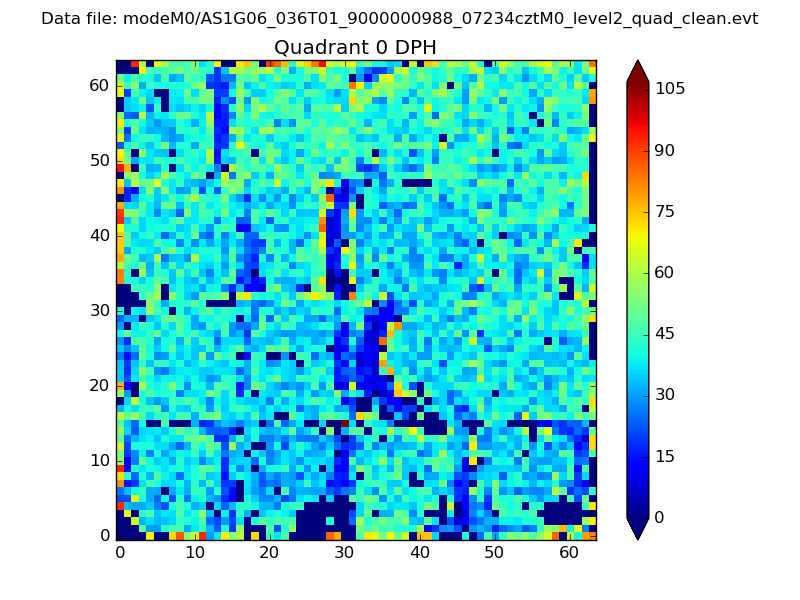 |
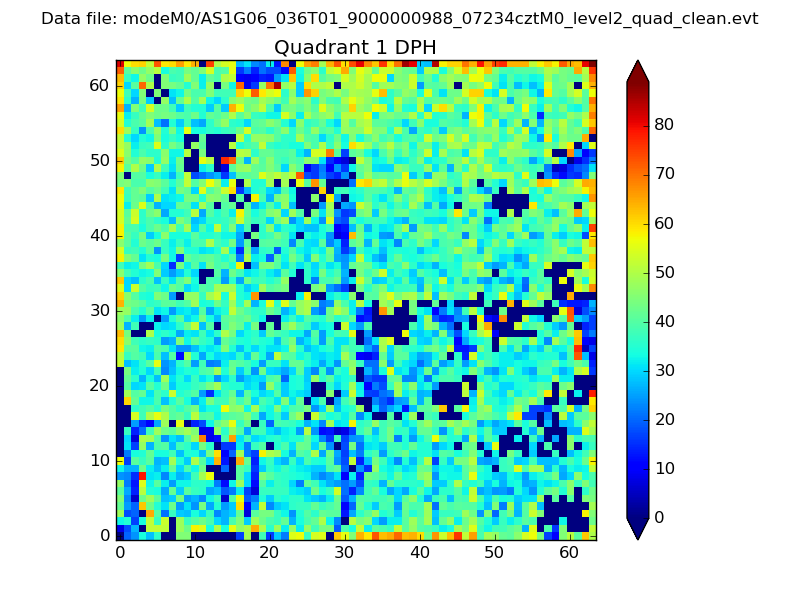 |
Quadrant B |
|---|---|---|---|
| Quadrant D | 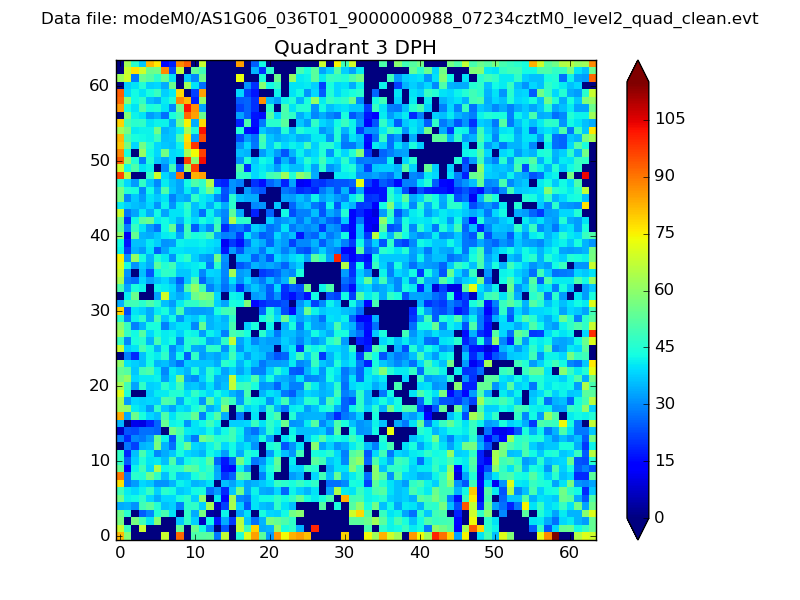 |
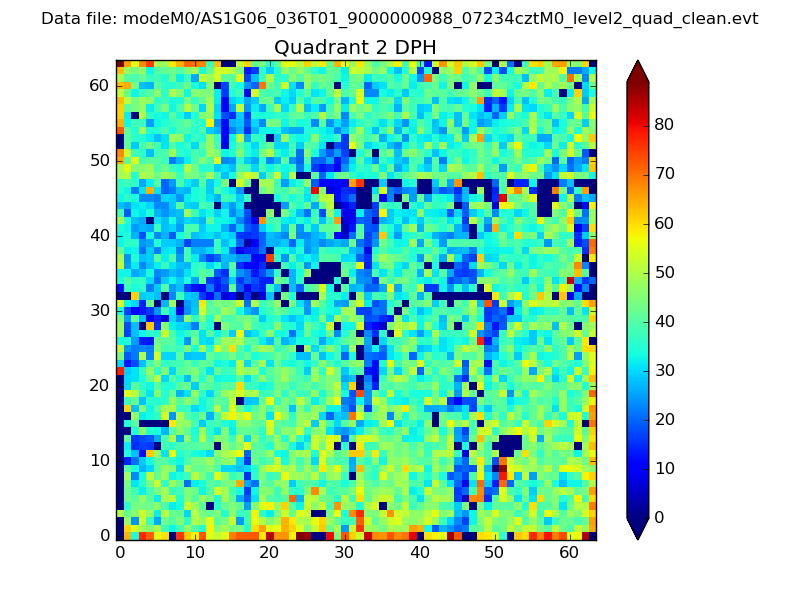 |
Quadrant C |
| Plot type | Count rate plots | Images |
|---|---|---|
| Comparison with Poisson distribution Blue bars denote a histogram of data divided into 1 sec bins. Red curve is a Poisson curve with rate = median count rate of data. |
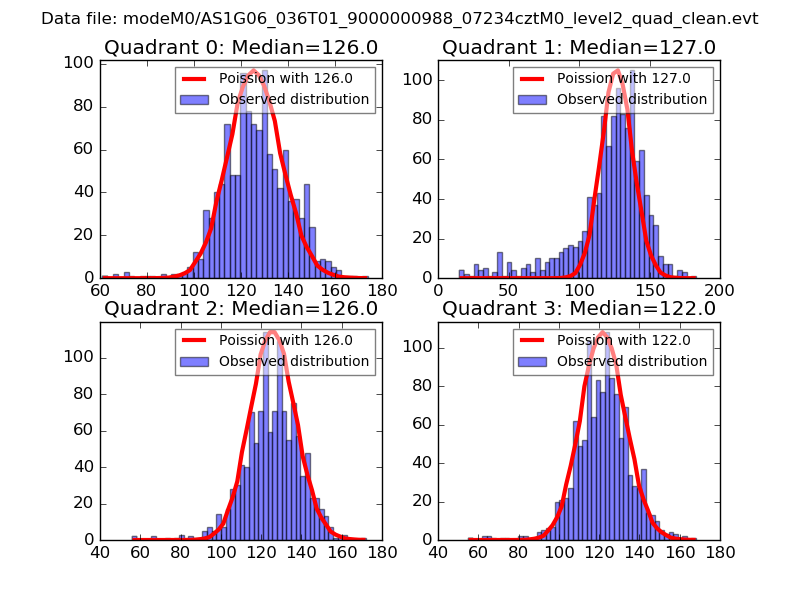 |
 |
| Quadrant-wise count rates Data is divided into 100 sec bins |
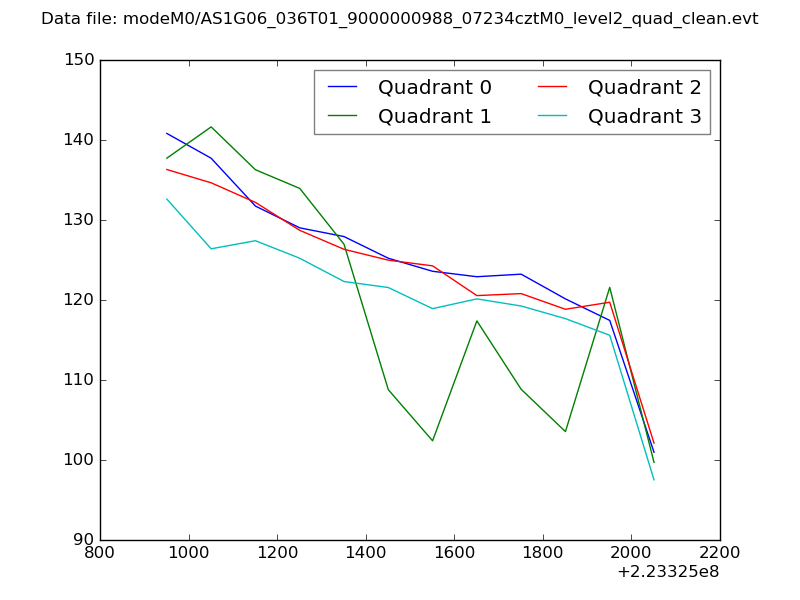 |
|
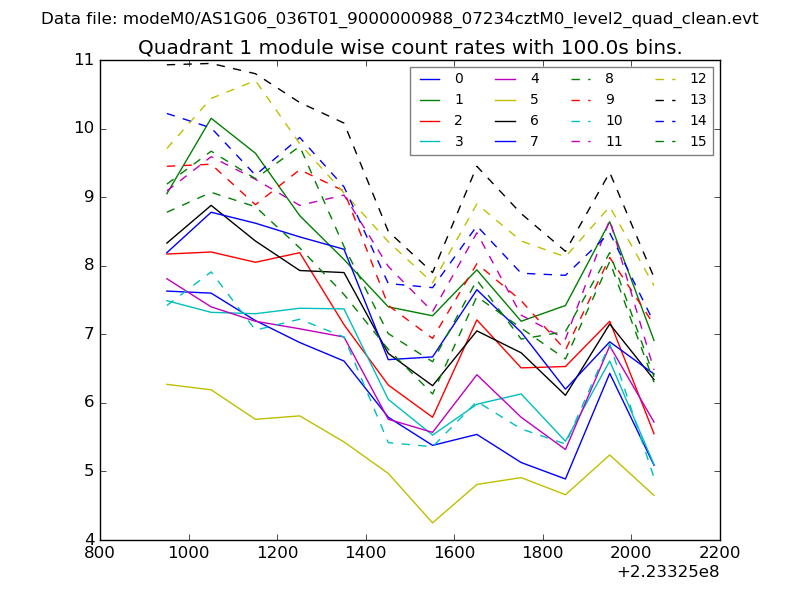
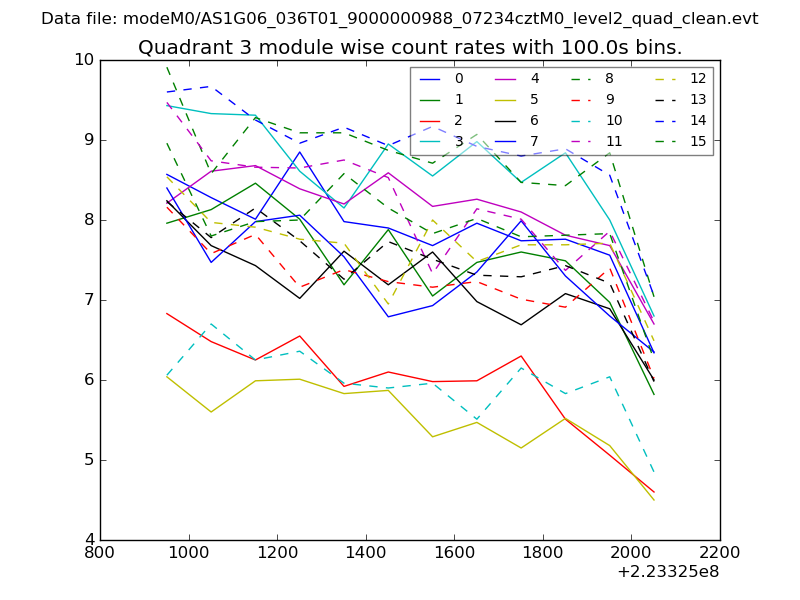
| Module-wise count rates for Quadrant A Data is divided into 100 sec bins |
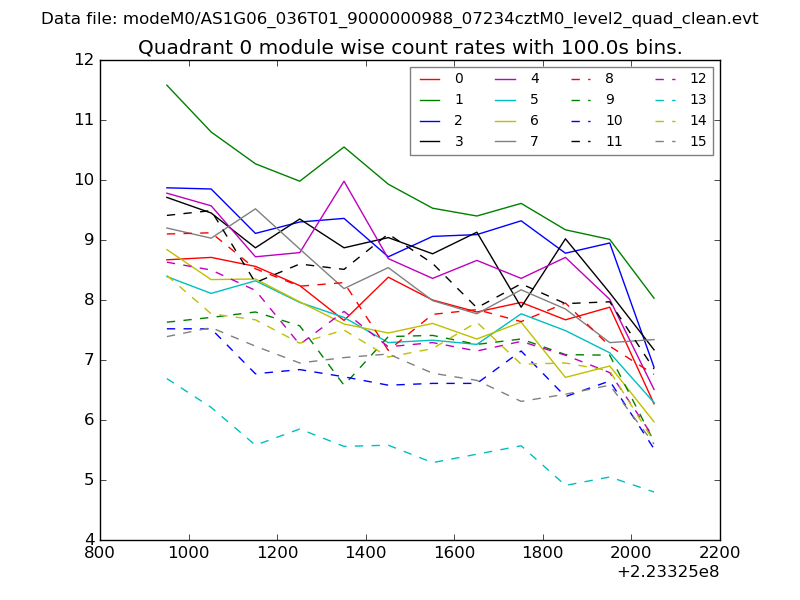 |
 |
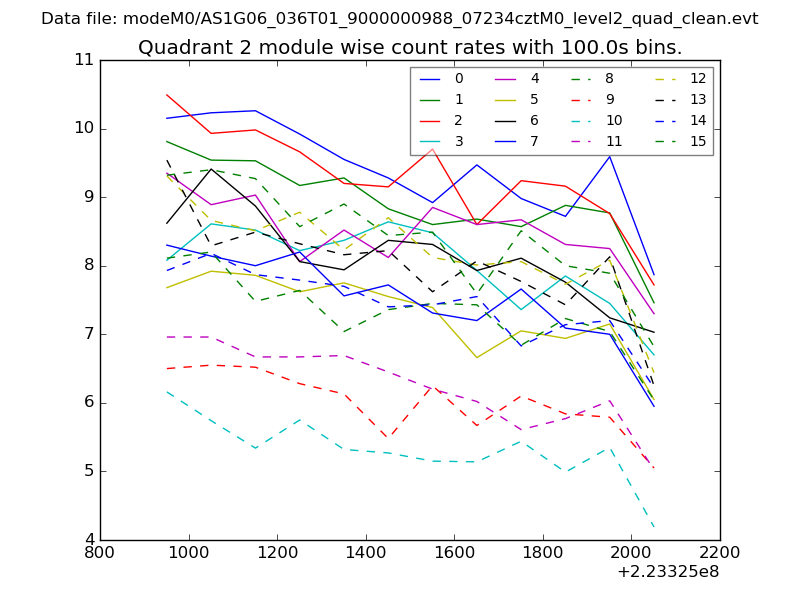
| Module-wise count rates for Quadrant B Data is divided into 100 sec bins |
 |
 |
| Module-wise count rates for Quadrant C Data is divided into 100 sec bins |
 |
 |
| Module-wise count rates for Quadrant D Data is divided into 100 sec bins |
 |
 |
| Parameter | Plot |
|---|---|
| CZT HV Monitor | 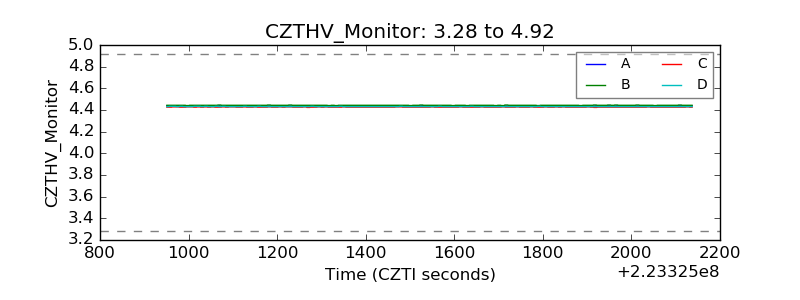 |
| D_VDD | 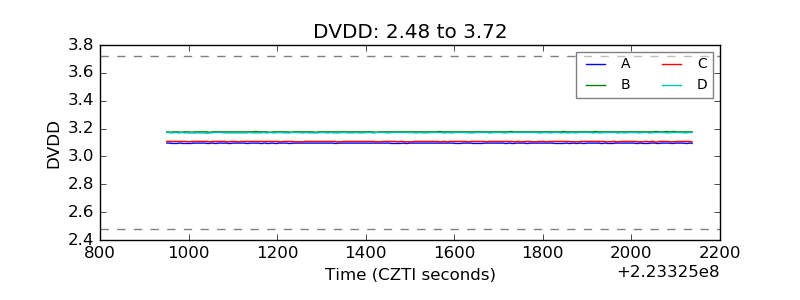 |
| Temperature 1 | 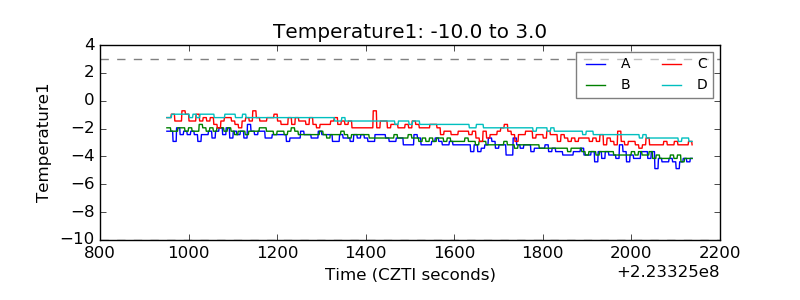 |
| Veto HV Monitor | 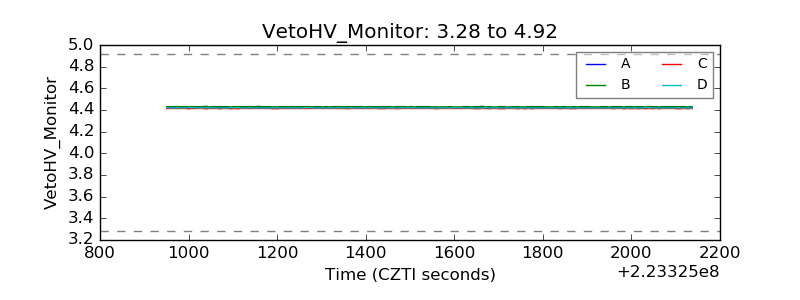 |
| Veto LLD | 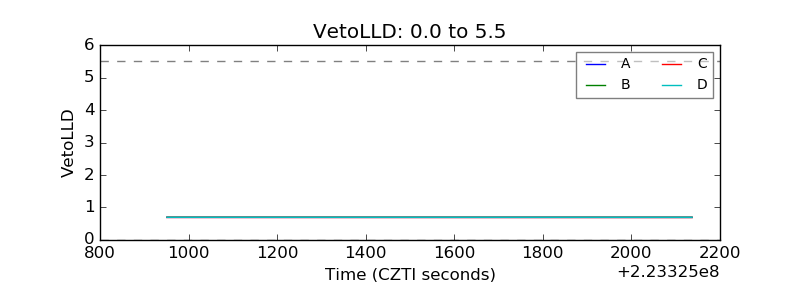 |
| Alpha Counter | 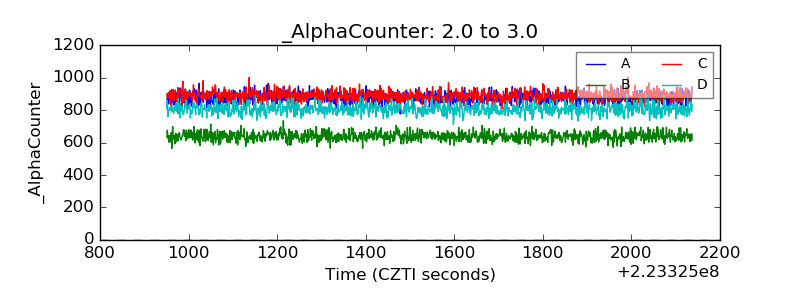 |
| _CPM_Rate | 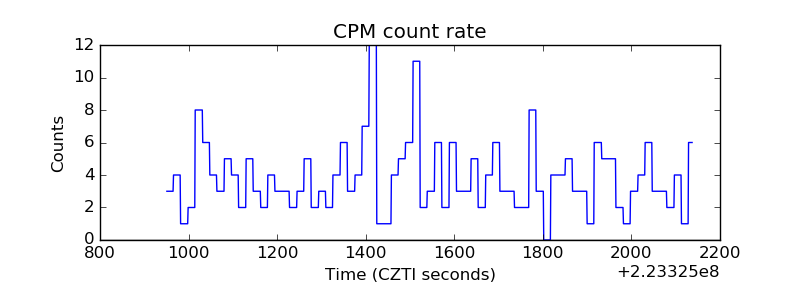 |
| CZT Counter | 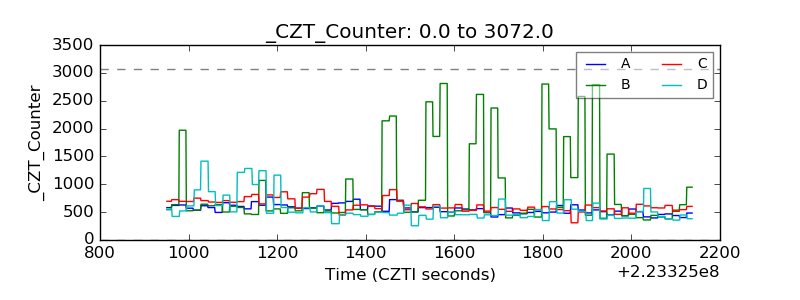 |
| +2.5 Volts monitor |  |
| +5 Volts monitor |  |
| _ROLL_ROT | 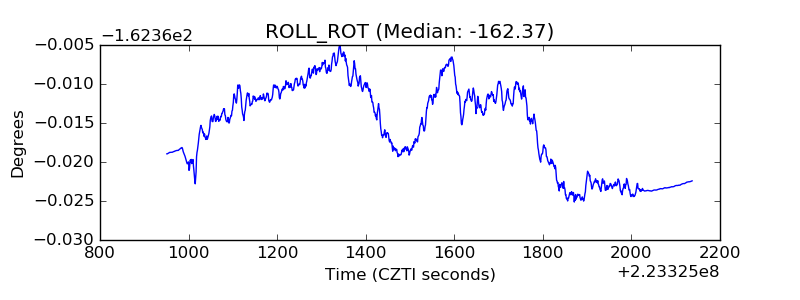 |
| _Roll_DEC | 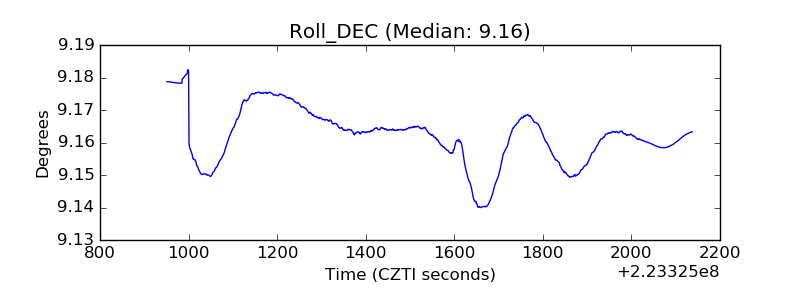 |
| _Roll_RA | 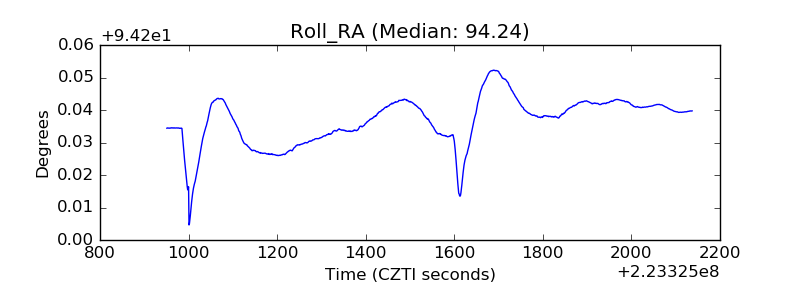 |
| Veto Counter | 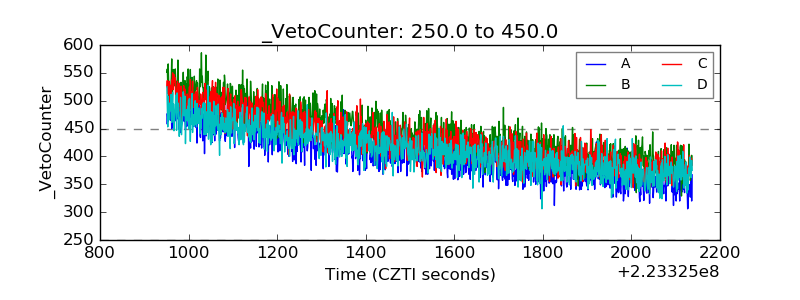 |