| Param | Original file | Final file |
|---|---|---|
| Filename | modeM0/AS1A02_155T01_9000000994cztM0_level2.fits | modeM0/AS1A02_155T01_9000000994cztM0_level2_quad_clean.evt |
| Size (bytes) | 658,540,800 | 674,369,280 |
| Size | 628.0 MB | 643.1 MB |
| Events in quadrant A | 3,947,072 | 4,053,806 |
| Events in quadrant B | 3,843,436 | 4,089,555 |
| Events in quadrant C | 3,914,040 | 3,862,872 |
| Events in quadrant D | 3,359,988 | 3,539,042 |
| Mode M9 | |||
|---|---|---|---|
| Quadrant | BADHDUFLAG | Total packets | Discarded packets |
| A | 0 | 109 | 0 |
| B | 0 | 109 | 0 |
| C | 0 | 109 | 0 |
| D | 0 | 109 | 0 |
| Mode M0 | |||
|---|---|---|---|
| Quadrant | BADHDUFLAG | Total packets | Discarded packets |
| A | 0 | 147766 | 0 |
| B | 0 | 153482 | 0 |
| C | 0 | 152583 | 0 |
| D | 0 | 158421 | 0 |
| Mode SS | |||
|---|---|---|---|
| Quadrant | BADHDUFLAG | Total packets | Discarded packets |
| A | 0 | 1448 | 0 |
| B | 0 | 1448 | 0 |
| C | 0 | 1448 | 0 |
| D | 0 | 1448 | 0 |
| Quadrant | Total seconds | Saturated seconds | Saturation percentage |
|---|---|---|---|
| A | 71152 | 1004 | 1.411064% |
| B | 71152 | 1371 | 1.926861% |
| C | 71152 | 875 | 1.229762% |
| D | 71152 | 1359 | 1.909996% |
Noise dominated data is calculated using 1-second bins in cleaned event files. If a bin has >2000 counts, and if more than 50% of those come from <1% of pixels, then it is considered to be noise-dominated and hence unusable.
| Quadrant | # 1 sec bins | Bins with >0 counts | Bins with >2000 counts | High rate bins dominated by noise | Noise dominated (total time) | Noise dominated (detector-on time) | Marked lightcurve |
|---|---|---|---|---|---|---|---|
| A | 82017 | 71146 | 0 | 0 | 0.00% | 0.00% |  |
| B | 82017 | 71146 | 0 | 0 | 0.00% | 0.00% |  |
| C | 82017 | 71145 | 0 | 0 | 0.00% | 0.00% |  |
| D | 82017 | 71139 | 0 | 0 | 0.00% | 0.00% |  |
Top three noisy pixels from each quadrant. If the there are fewer than three noisy pixels in the level2.evt file, extra rows are filled as -1
| Pixel properties | Quadrant properties | ||||||
|---|---|---|---|---|---|---|---|
| Quadrant | DetID | PixID | Counts | Sigma | Mean | Median | Sigma |
| A | 0 | 29 | 3966 | 11.54 | 1024 | 957 | 260.9 |
| A | 14 | 188 | 3883 | 11.22 | 1024 | 957 | 260.9 |
| A | 14 | 204 | 3381 | 9.29 | 1024 | 957 | 260.9 |
| B | 2 | 9 | 3326 | 11.81 | 1013 | 963 | 200.1 |
| B | 14 | 254 | 2620 | 8.28 | 1013 | 963 | 200.1 |
| B | 5 | 128 | 2585 | 8.1 | 1013 | 963 | 200.1 |
| C | 1 | 80 | 2862 | 7.08 | 1032 | 957 | 269.1 |
| C | 1 | 81 | 2850 | 7.03 | 1032 | 957 | 269.1 |
| C | 12 | 241 | 2759 | 6.7 | 1032 | 957 | 269.1 |
| D | 3 | 14 | 2461 | 6.13 | 957 | 868 | 259.9 |
| D | 6 | 231 | 2408 | 5.93 | 957 | 868 | 259.9 |
| D | 7 | 5 | 2381 | 5.82 | 957 | 868 | 259.9 |
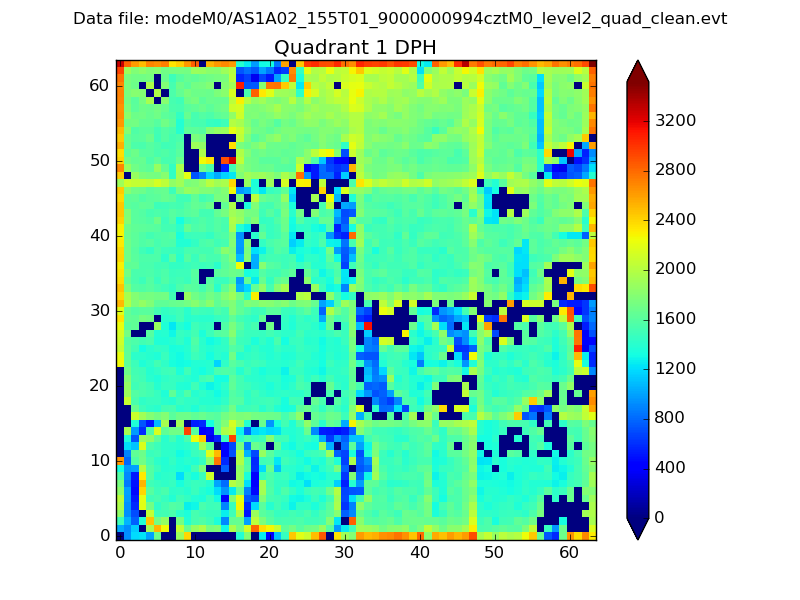
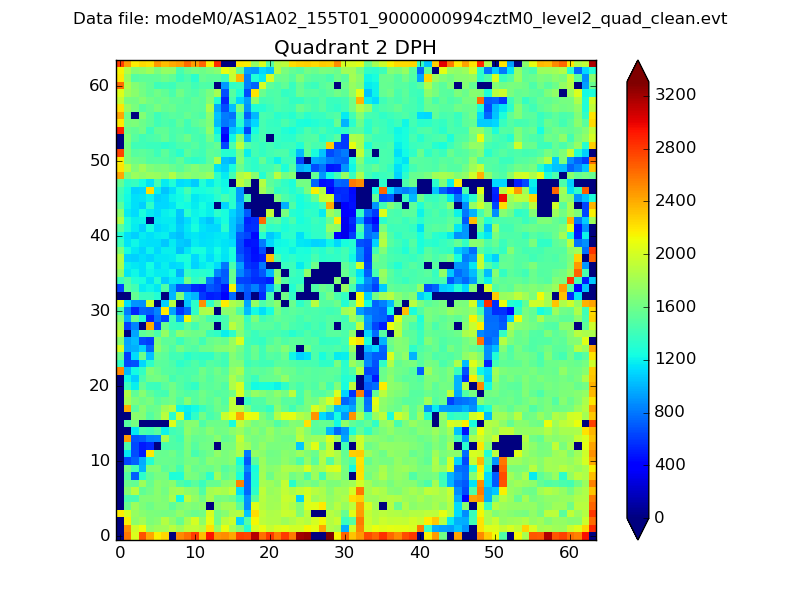
Histogram calculated using DETX and DETY for each event in the final _common_clean file
| Quadrant A |  |
 |
Quadrant B |
|---|---|---|---|
| Quadrant D | 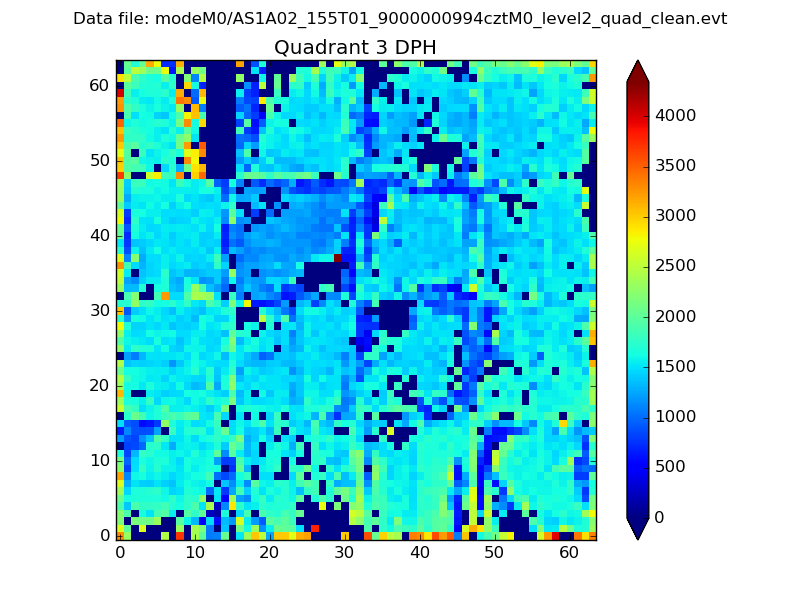 |
 |
Quadrant C |
| Plot type | Count rate plots | Images |
|---|---|---|
| Comparison with Poisson distribution Blue bars denote a histogram of data divided into 1 sec bins. Red curve is a Poisson curve with rate = median count rate of data. |
 |
 |
| Quadrant-wise count rates Data is divided into 100 sec bins |
 |
|
| Module-wise count rates for Quadrant A Data is divided into 100 sec bins |
 |
 |
| Module-wise count rates for Quadrant B Data is divided into 100 sec bins |
 |
 |
| Module-wise count rates for Quadrant C Data is divided into 100 sec bins |
 |
 |
| Module-wise count rates for Quadrant D Data is divided into 100 sec bins |
 |
 |
| Parameter | Plot |
|---|---|
| CZT HV Monitor |  |
| D_VDD | 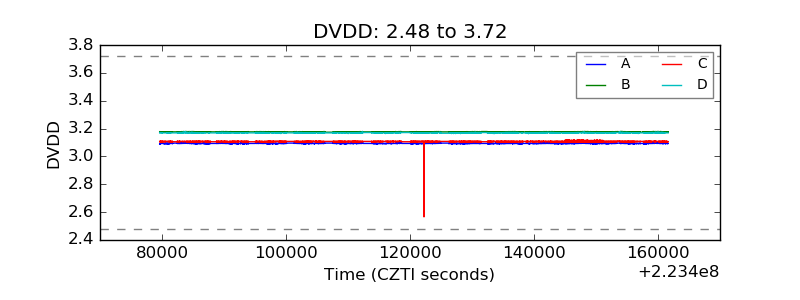 |
| Temperature 1 | 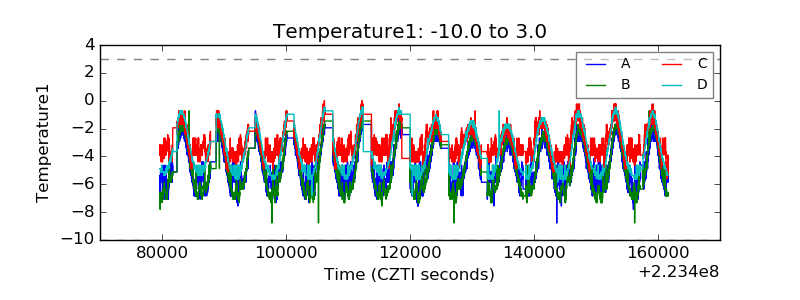 |
| Veto HV Monitor | 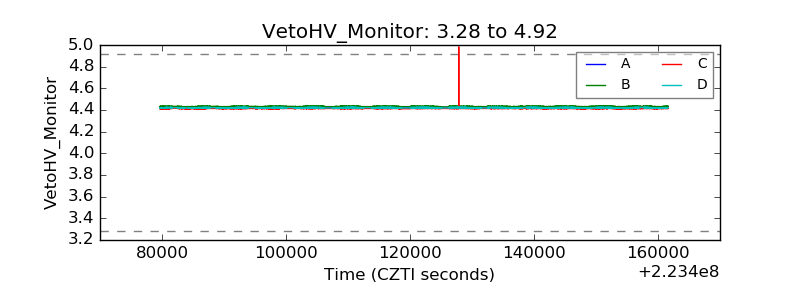 |
| Veto LLD |  |
| Alpha Counter |  |
| _CPM_Rate |  |
| CZT Counter |  |
| +2.5 Volts monitor |  |
| +5 Volts monitor |  |
| _ROLL_ROT |  |
| _Roll_DEC |  |
| _Roll_RA |  |
| Veto Counter |  |