| Param | Original file | Final file |
|---|---|---|
| Filename | modeM0/AS1A02_155T01_9000000994_07260cztM0_level2.evt | modeM0/AS1A02_155T01_9000000994_07260cztM0_level2_quad_clean.evt |
| Size (bytes) | 111,358,080 | 31,052,160 |
| Size | 106.2 MB | 29.6 MB |
| Events in quadrant A | 746,400 | 205,332 |
| Events in quadrant B | 794,477 | 207,454 |
| Events in quadrant C | 744,323 | 204,743 |
| Events in quadrant D | 966,690 | 195,368 |
| Mode M0 | |||
|---|---|---|---|
| Quadrant | BADHDUFLAG | Total packets | Discarded packets |
| A | 0 | 3475 | 1 |
| B | 0 | 3540 | 0 |
| C | 0 | 3472 | 0 |
| D | 0 | 4172 | 0 |
| Mode SS | |||
|---|---|---|---|
| Quadrant | BADHDUFLAG | Total packets | Discarded packets |
| A | 0 | 34 | 0 |
| B | 0 | 34 | 0 |
| C | 0 | 34 | 0 |
| D | 0 | 34 | 0 |
| Quadrant | Total seconds | Saturated seconds | Saturation percentage |
|---|---|---|---|
| A | 1733 | 1 | 0.057703% |
| B | 1733 | 2 | 0.115407% |
| C | 1733 | 0 | 0.000000% |
| D | 1733 | 59 | 3.404501% |
Noise dominated data is calculated using 1-second bins in cleaned event files. If a bin has >2000 counts, and if more than 50% of those come from <1% of pixels, then it is considered to be noise-dominated and hence unusable.
| Quadrant | # 1 sec bins | Bins with >0 counts | Bins with >2000 counts | High rate bins dominated by noise | Noise dominated (total time) | Noise dominated (detector-on time) | Marked lightcurve |
|---|---|---|---|---|---|---|---|
| A | 1733 | 1733 | 0 | 0 | 0.00% | 0.00% | 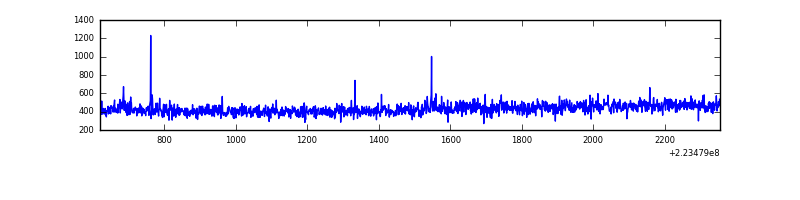 |
| B | 1733 | 1733 | 0 | 0 | 0.00% | 0.00% | 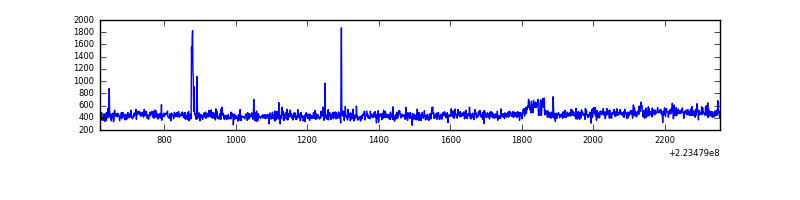 |
| C | 1733 | 1733 | 0 | 0 | 0.00% | 0.00% | 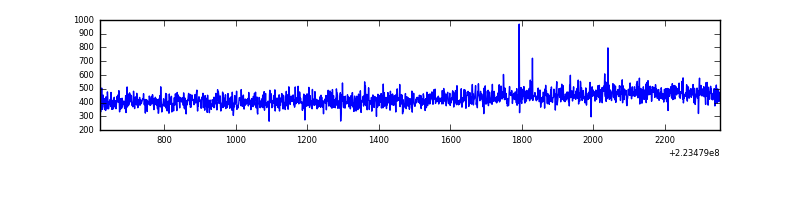 |
| D | 1733 | 1733 | 47 | 47 | 2.71% | 2.71% | 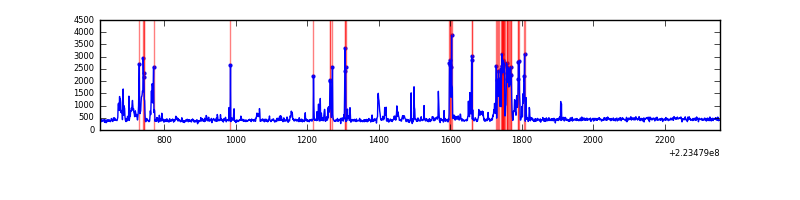 |
Top three noisy pixels from each quadrant. If the there are fewer than three noisy pixels in the level2.evt file, extra rows are filled as -1
| Pixel properties | Quadrant properties | ||||||
|---|---|---|---|---|---|---|---|
| Quadrant | DetID | PixID | Counts | Sigma | Mean | Median | Sigma |
| A | 8 | 15 | 13934 | 338.26 | 190 | 185 | 40.6 |
| A | 0 | 226 | 1820 | 40.23 | 190 | 185 | 40.6 |
| A | 12 | 194 | 1751 | 38.53 | 190 | 185 | 40.6 |
| B | 4 | 81 | 24771 | 619.71 | 194 | 189 | 39.7 |
| B | 5 | 255 | 10769 | 266.72 | 194 | 189 | 39.7 |
| B | 12 | 111 | 4040 | 97.08 | 194 | 189 | 39.7 |
| C | 9 | 68 | 1653 | 31.67 | 190 | 191 | 46.2 |
| C | 13 | 61 | 1433 | 26.91 | 190 | 191 | 46.2 |
| C | 8 | 222 | 539 | 7.54 | 190 | 191 | 46.2 |
| D | 2 | 14 | 264501 | 5633.35 | 184 | 178 | 46.9 |
| D | 14 | 34 | 8018 | 167.09 | 184 | 178 | 46.9 |
| D | 2 | 216 | 2885 | 57.69 | 184 | 178 | 46.9 |
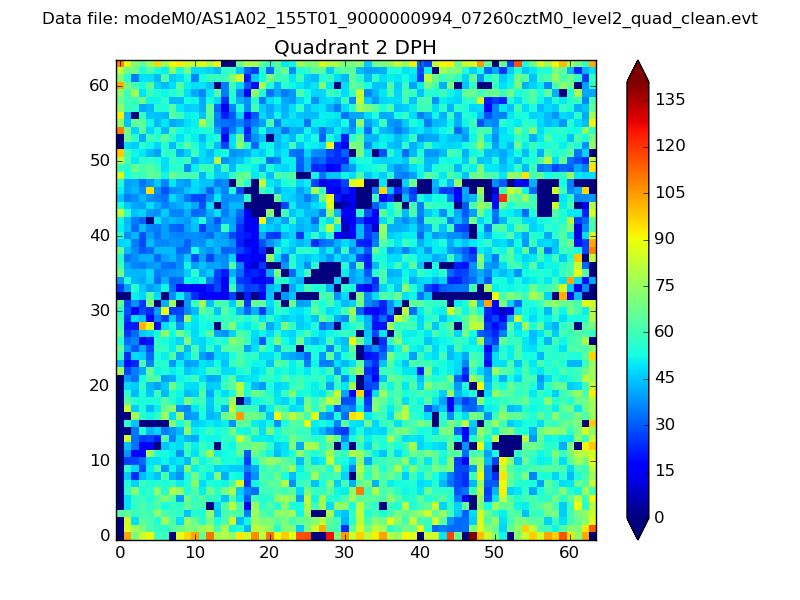
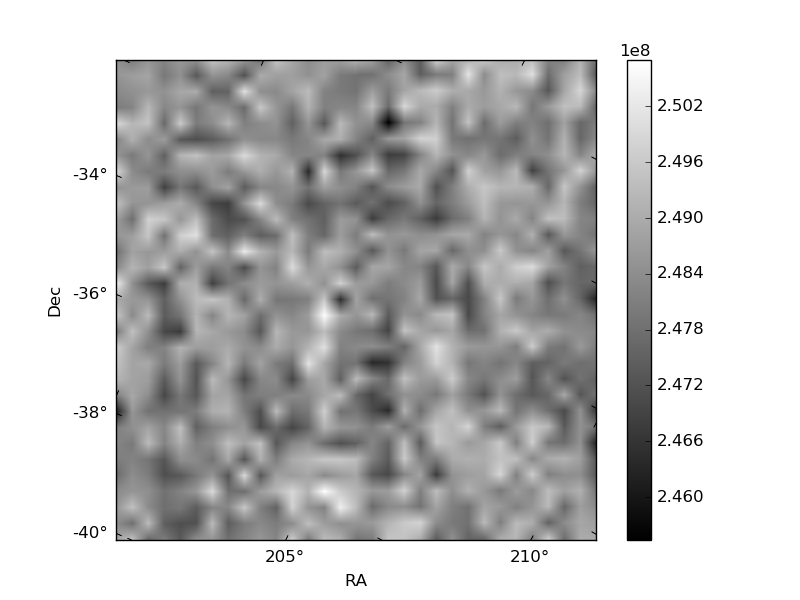
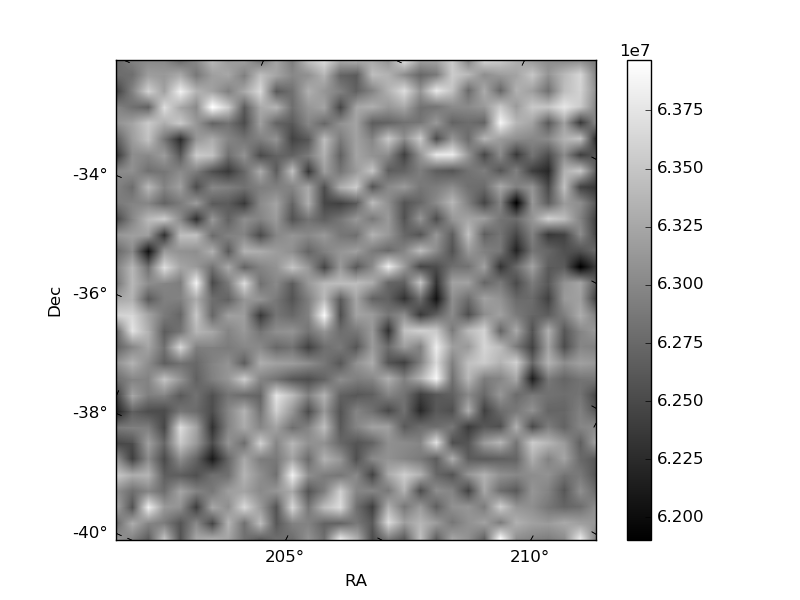
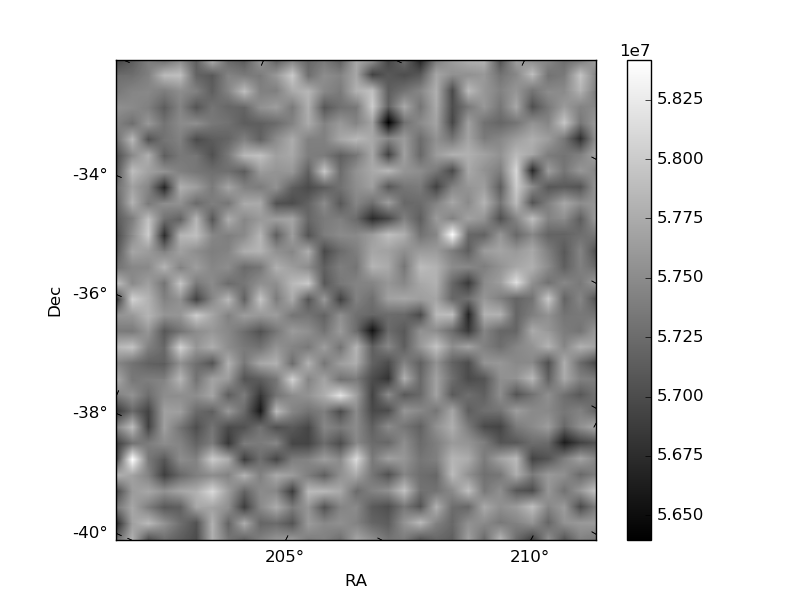
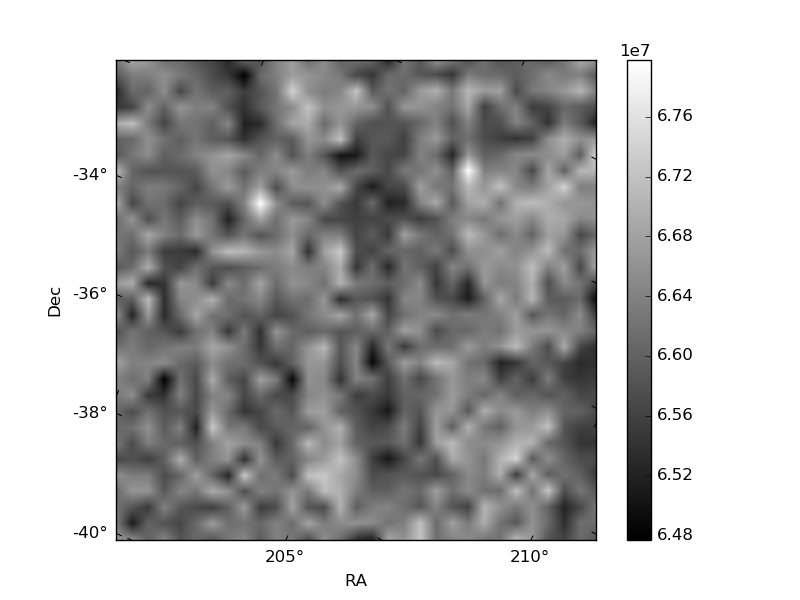
Histogram calculated using DETX and DETY for each event in the final _common_clean file
| Quadrant A | 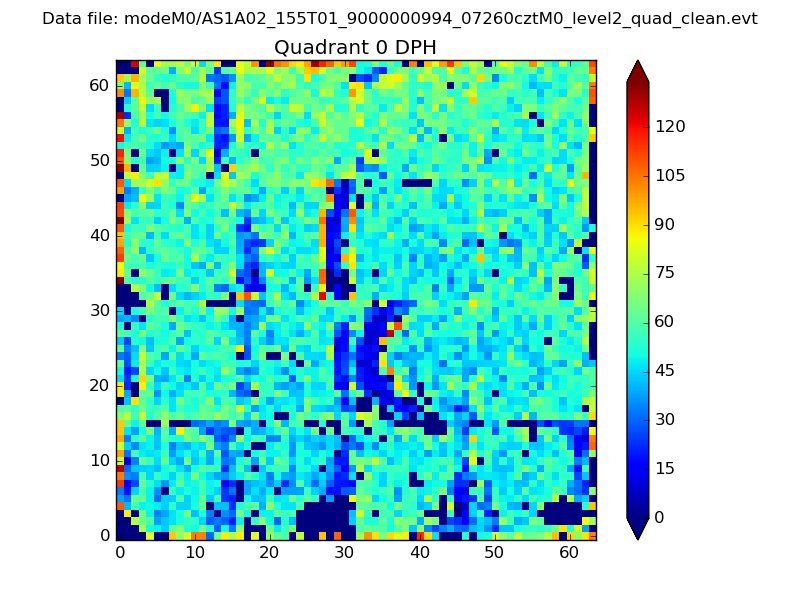 |
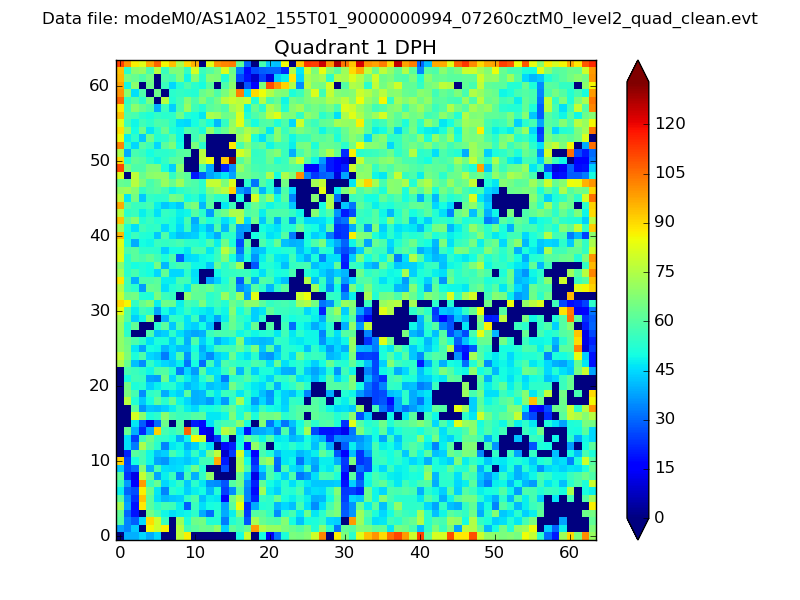 |
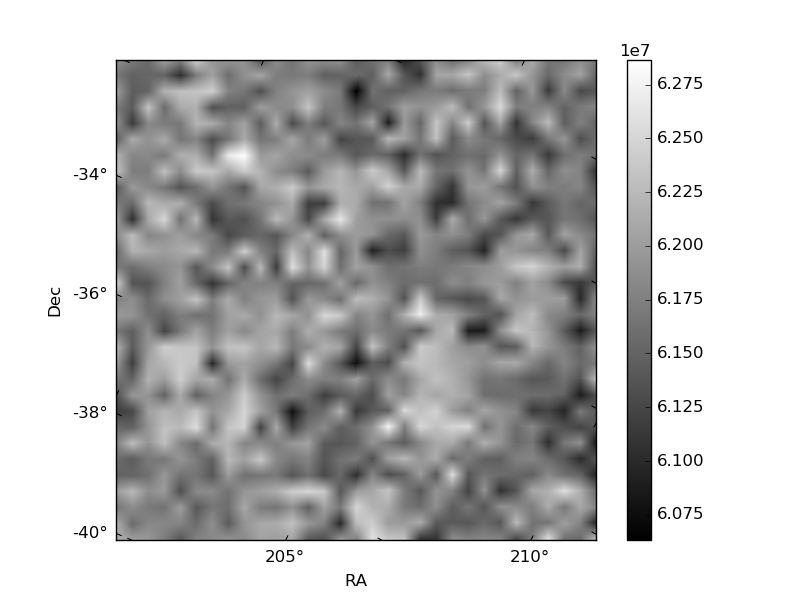
Quadrant B |
|---|---|---|---|
| Quadrant D | 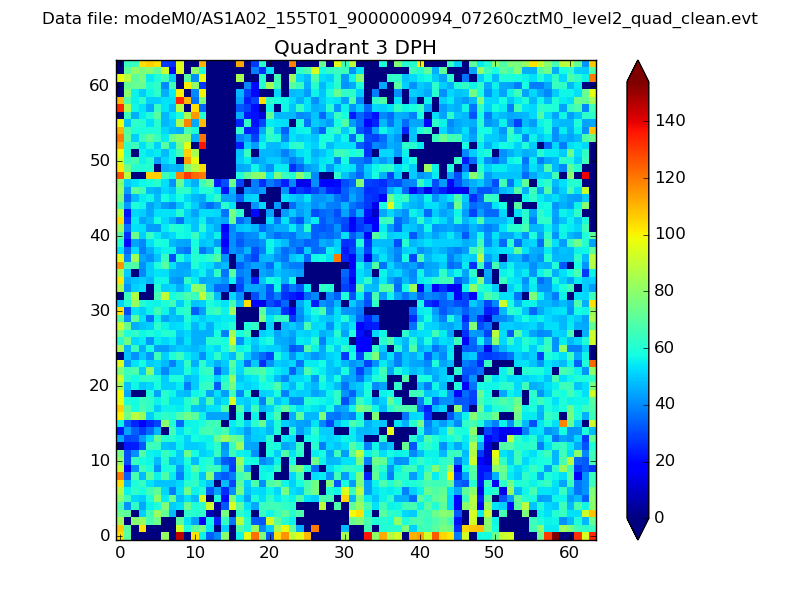 |
 |
Quadrant C |
| Plot type | Count rate plots | Images |
|---|---|---|
| Comparison with Poisson distribution Blue bars denote a histogram of data divided into 1 sec bins. Red curve is a Poisson curve with rate = median count rate of data. |
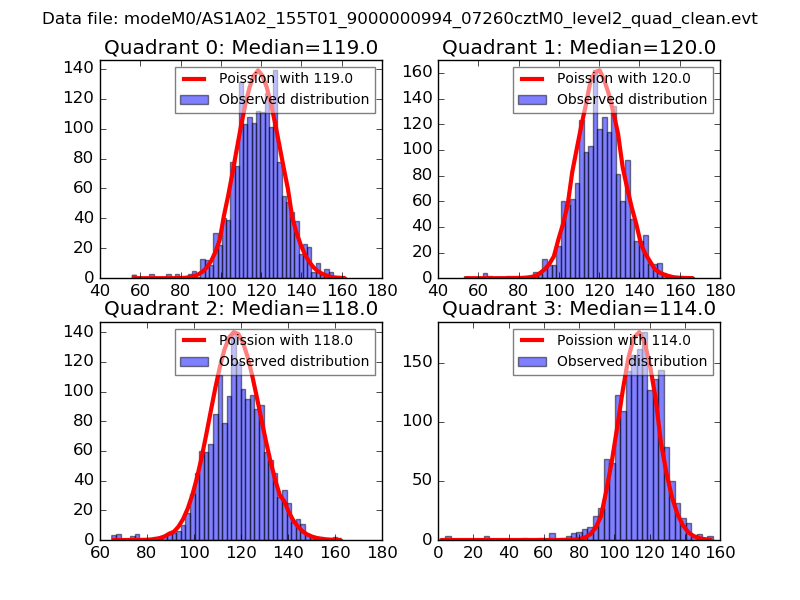 |
 |
| Quadrant-wise count rates Data is divided into 100 sec bins |
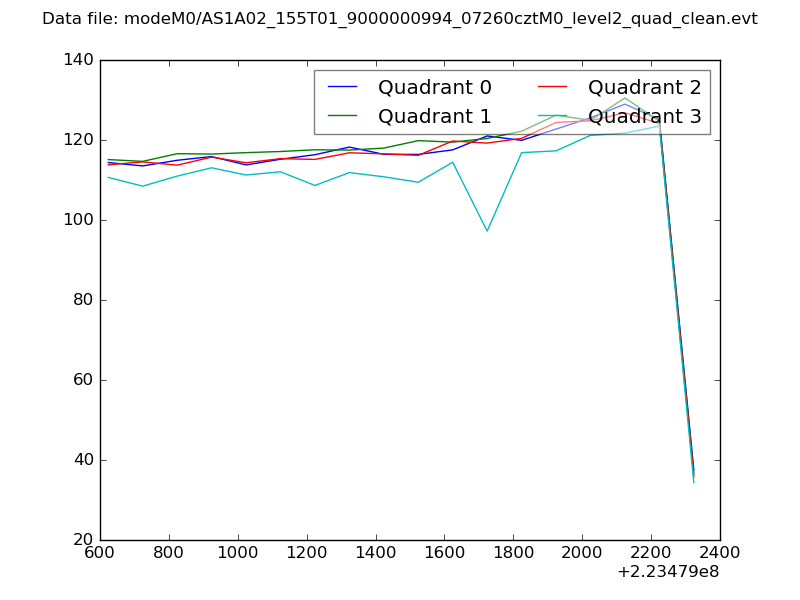 |
|
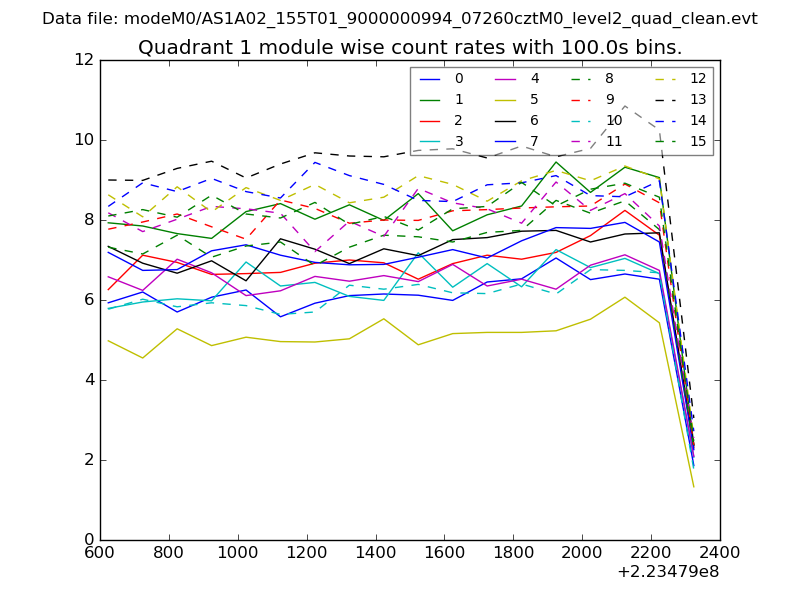
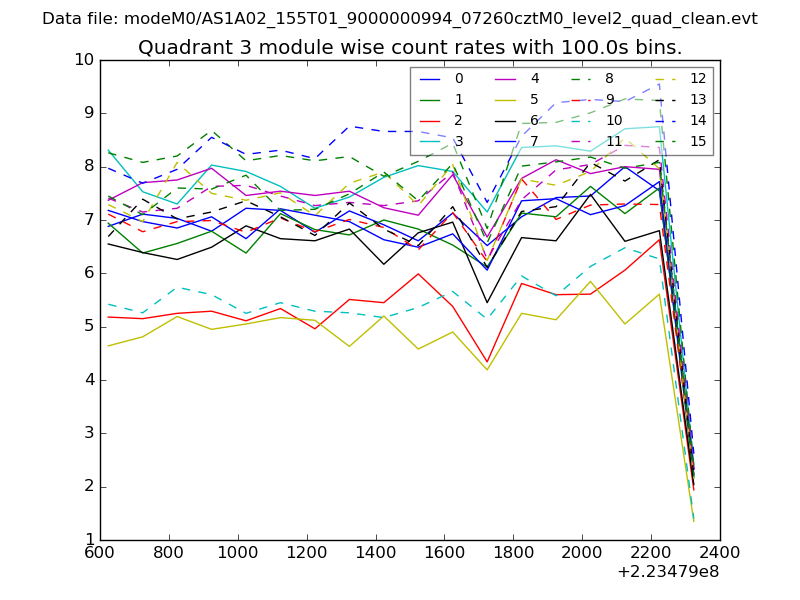
| Module-wise count rates for Quadrant A Data is divided into 100 sec bins |
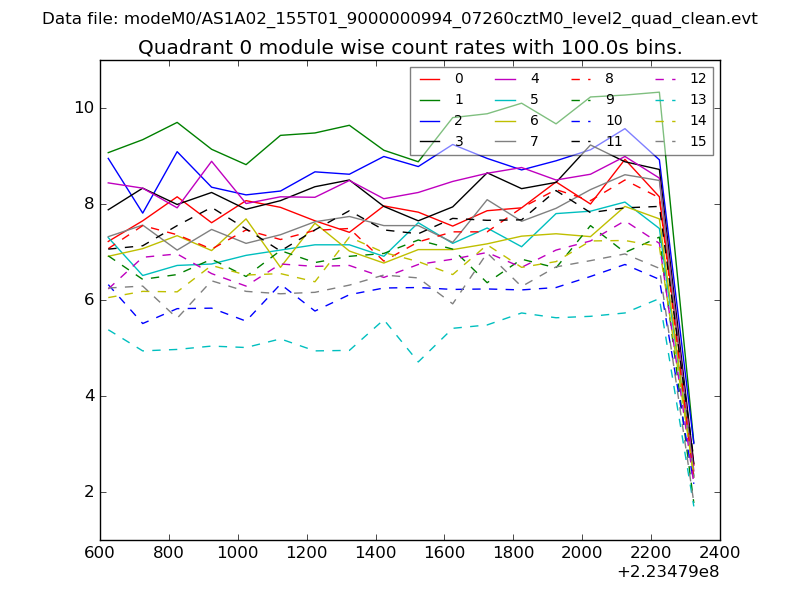 |
 |
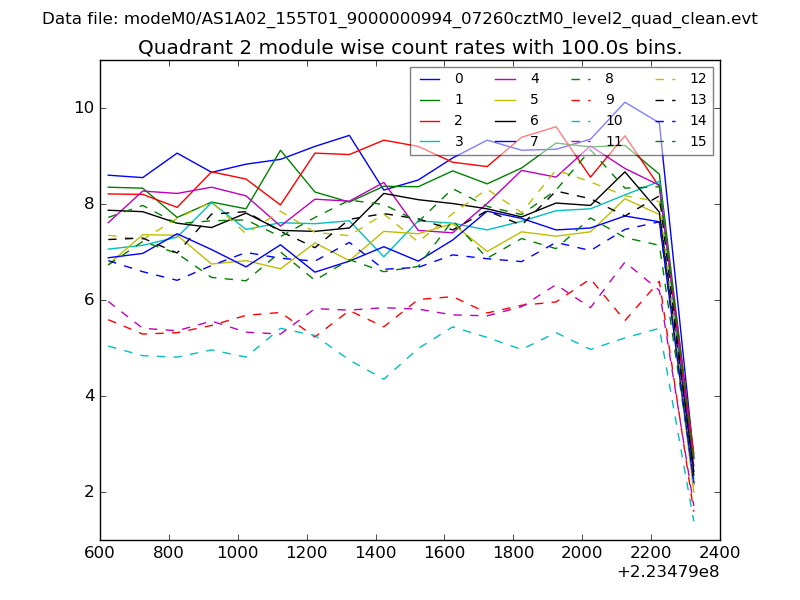
| Module-wise count rates for Quadrant B Data is divided into 100 sec bins |
 |
 |
| Module-wise count rates for Quadrant C Data is divided into 100 sec bins |
 |
 |
| Module-wise count rates for Quadrant D Data is divided into 100 sec bins |
 |
 |
| Parameter | Plot |
|---|---|
| CZT HV Monitor | 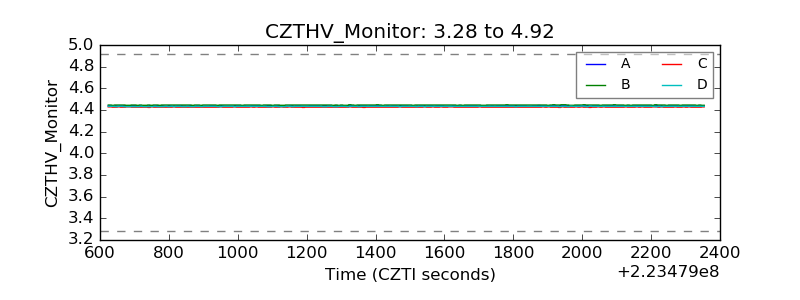 |
| D_VDD | 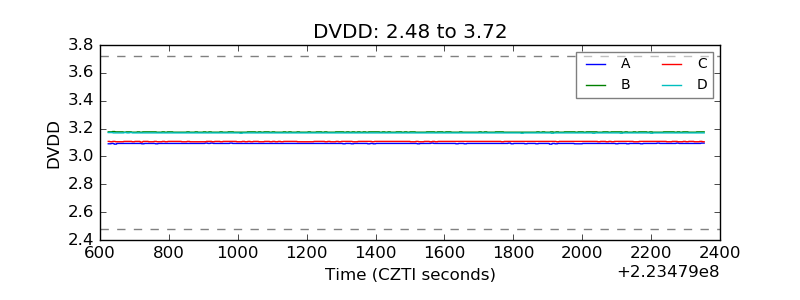 |
| Temperature 1 | 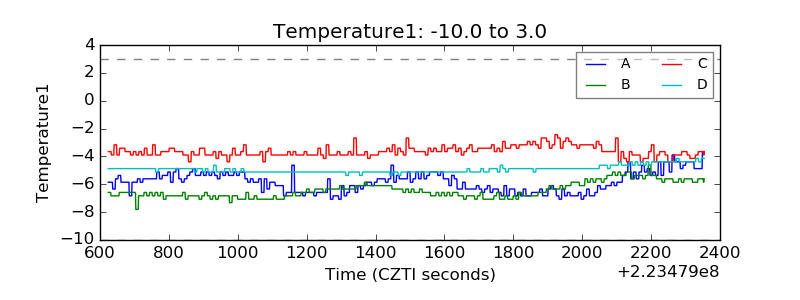 |
| Veto HV Monitor | 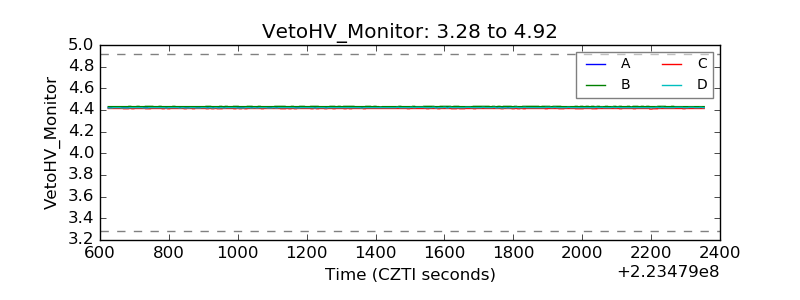 |
| Veto LLD | 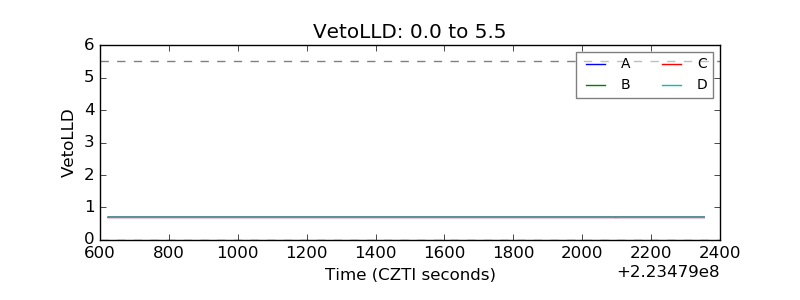 |
| Alpha Counter | 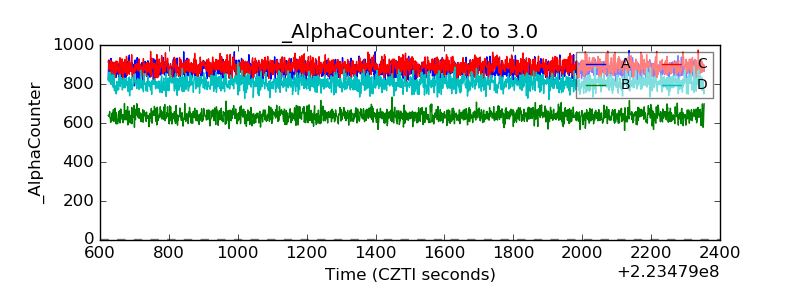 |
| _CPM_Rate | 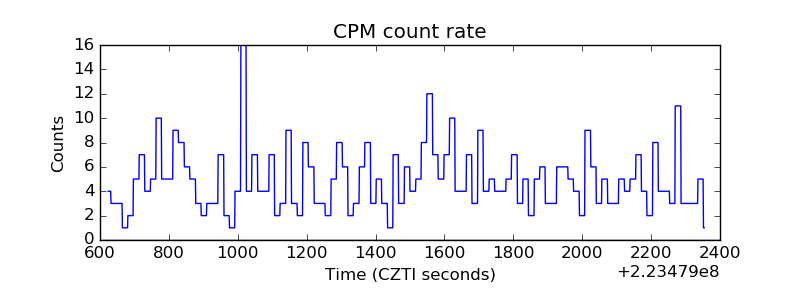 |
| CZT Counter | 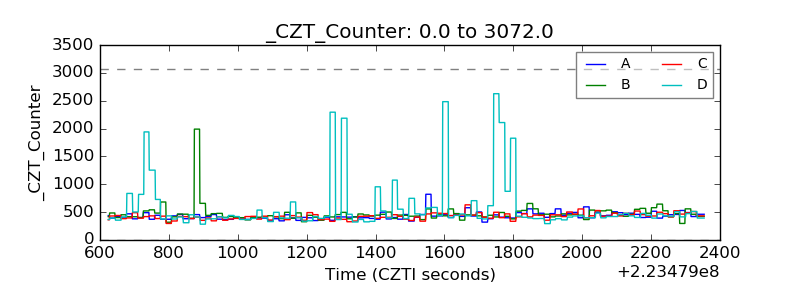 |
| +2.5 Volts monitor |  |
| +5 Volts monitor | 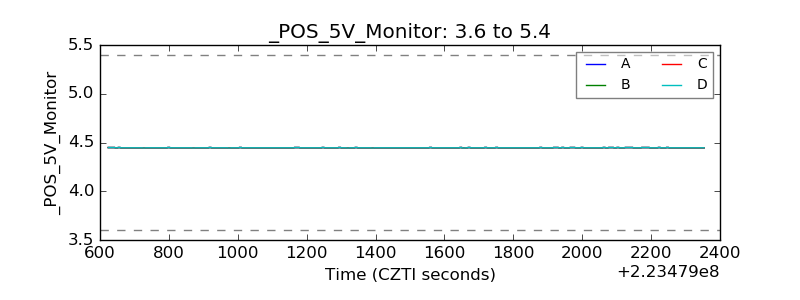 |
| _ROLL_ROT | 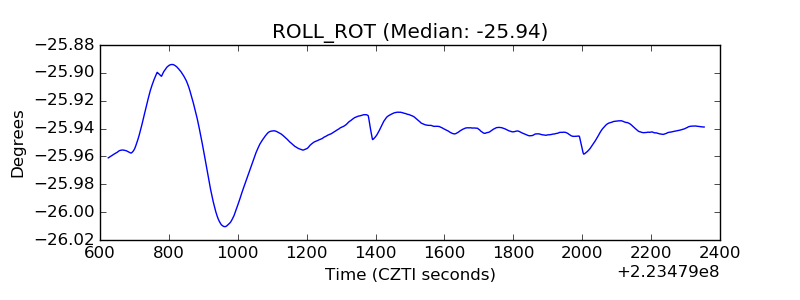 |
| _Roll_DEC | 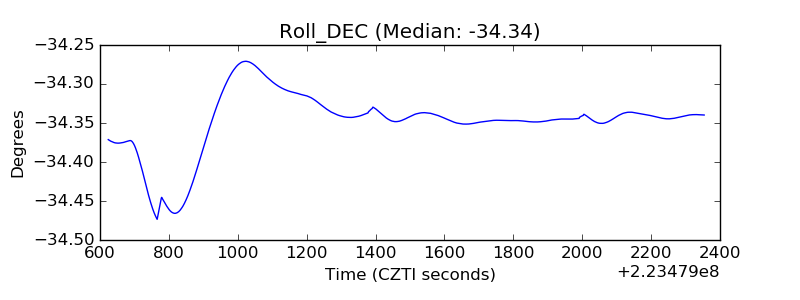 |
| _Roll_RA | 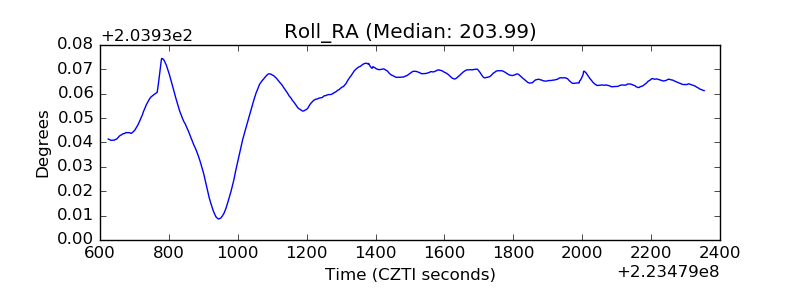 |
| Veto Counter | 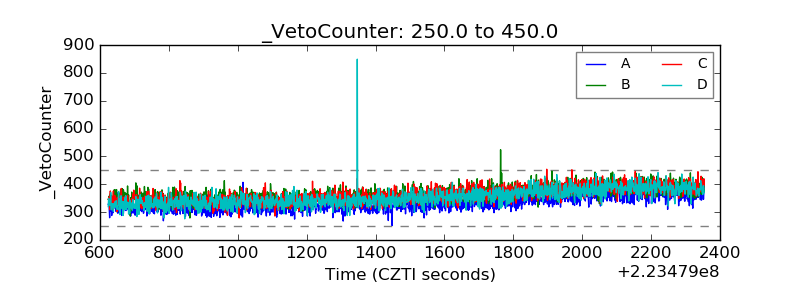 |