| Param | Original file | Final file |
|---|---|---|
| Filename | modeM0/AS1A02_155T01_9000000994_07261cztM0_level2.evt | modeM0/AS1A02_155T01_9000000994_07261cztM0_level2_quad_clean.evt |
| Size (bytes) | 856,488,960 | 163,419,840 |
| Size | 816.8 MB | 155.8 MB |
| Events in quadrant A | 5,993,621 | 1,018,551 |
| Events in quadrant B | 6,575,557 | 1,033,750 |
| Events in quadrant C | 6,226,765 | 1,017,899 |
| Events in quadrant D | 6,262,258 | 980,691 |
| Mode M9 | |||
|---|---|---|---|
| Quadrant | BADHDUFLAG | Total packets | Discarded packets |
| A | 0 | 27 | 0 |
| B | 0 | 27 | 0 |
| C | 0 | 27 | 0 |
| D | 0 | 27 | 0 |
| Mode M0 | |||
|---|---|---|---|
| Quadrant | BADHDUFLAG | Total packets | Discarded packets |
| A | 0 | 26765 | 4 |
| B | 0 | 28361 | 3 |
| C | 0 | 27405 | 3 |
| D | 0 | 28077 | 3 |
| Mode SS | |||
|---|---|---|---|
| Quadrant | BADHDUFLAG | Total packets | Discarded packets |
| A | 0 | 264 | 0 |
| B | 0 | 264 | 0 |
| C | 0 | 264 | 0 |
| D | 0 | 264 | 0 |
| Quadrant | Total seconds | Saturated seconds | Saturation percentage |
|---|---|---|---|
| A | 13006 | 159 | 1.222513% |
| B | 13006 | 243 | 1.868368% |
| C | 13006 | 147 | 1.130248% |
| D | 13006 | 201 | 1.545441% |
Noise dominated data is calculated using 1-second bins in cleaned event files. If a bin has >2000 counts, and if more than 50% of those come from <1% of pixels, then it is considered to be noise-dominated and hence unusable.
| Quadrant | # 1 sec bins | Bins with >0 counts | Bins with >2000 counts | High rate bins dominated by noise | Noise dominated (total time) | Noise dominated (detector-on time) | Marked lightcurve |
|---|---|---|---|---|---|---|---|
| A | 15641 | 13006 | 0 | 0 | 0.00% | 0.00% | 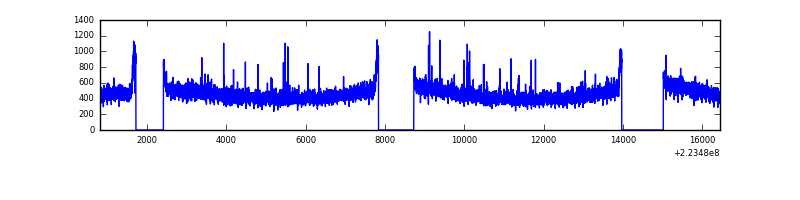 |
| B | 15641 | 13006 | 54 | 54 | 0.35% | 0.42% | 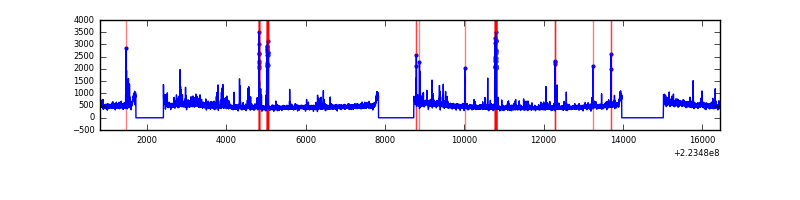 |
| C | 15641 | 13006 | 17 | 17 | 0.11% | 0.13% | 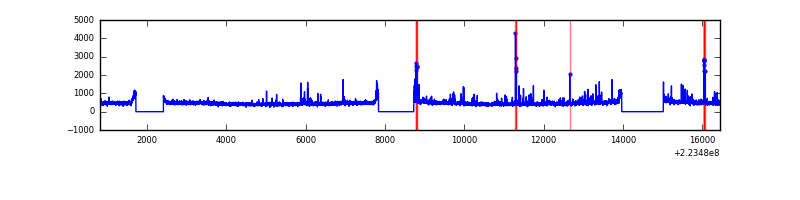 |
| D | 15641 | 13006 | 73 | 73 | 0.47% | 0.56% | 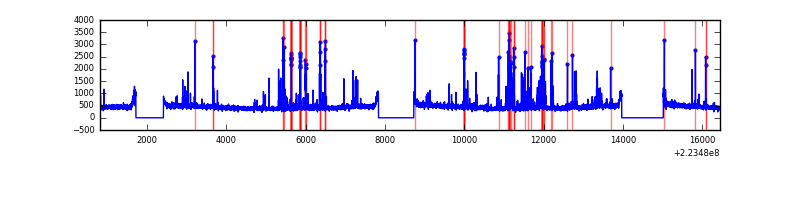 |
Top three noisy pixels from each quadrant. If the there are fewer than three noisy pixels in the level2.evt file, extra rows are filled as -1
| Pixel properties | Quadrant properties | ||||||
|---|---|---|---|---|---|---|---|
| Quadrant | DetID | PixID | Counts | Sigma | Mean | Median | Sigma |
| A | 8 | 15 | 67413 | 211.72 | 1532 | 1495 | 311.3 |
| A | 0 | 226 | 15151 | 43.86 | 1532 | 1495 | 311.3 |
| A | 12 | 194 | 13719 | 39.26 | 1532 | 1495 | 311.3 |
| B | 4 | 81 | 201698 | 677.5 | 1544 | 1507 | 295.5 |
| B | 4 | 239 | 156889 | 525.85 | 1544 | 1507 | 295.5 |
| B | 0 | 214 | 136651 | 457.36 | 1544 | 1507 | 295.5 |
| C | 7 | 247 | 328845 | 944.08 | 1496 | 1500 | 346.7 |
| C | 9 | 68 | 61952 | 174.35 | 1496 | 1500 | 346.7 |
| C | 13 | 61 | 11582 | 29.08 | 1496 | 1500 | 346.7 |
| D | 2 | 14 | 405669 | 1116.25 | 1488 | 1444 | 362.1 |
| D | 2 | 33 | 92108 | 250.37 | 1488 | 1444 | 362.1 |
| D | 14 | 34 | 65086 | 175.75 | 1488 | 1444 | 362.1 |
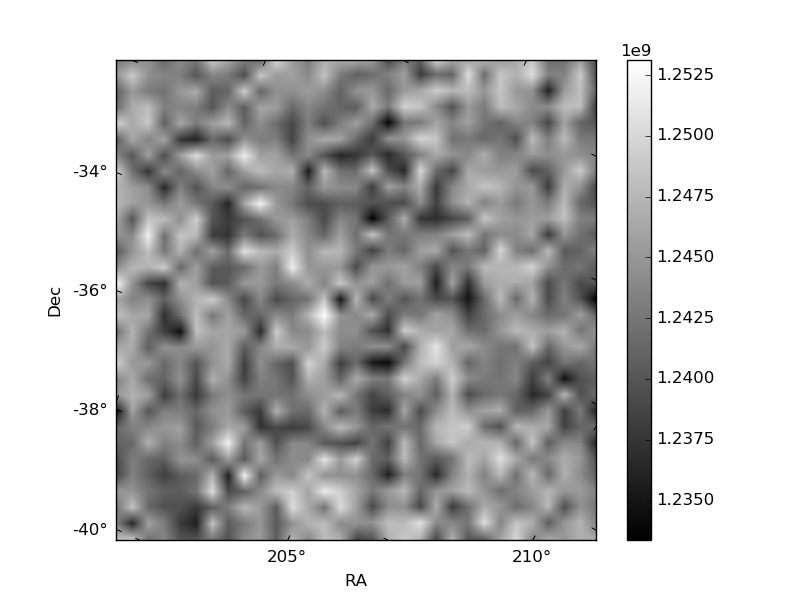
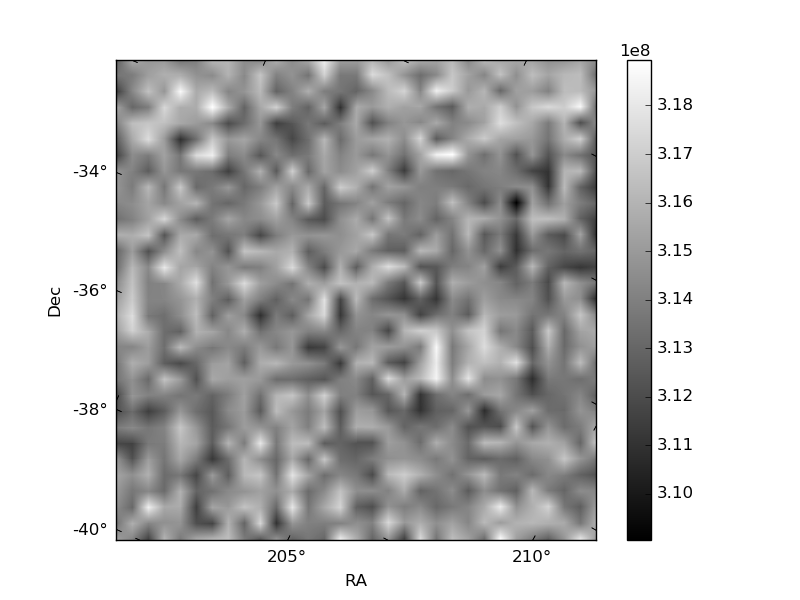
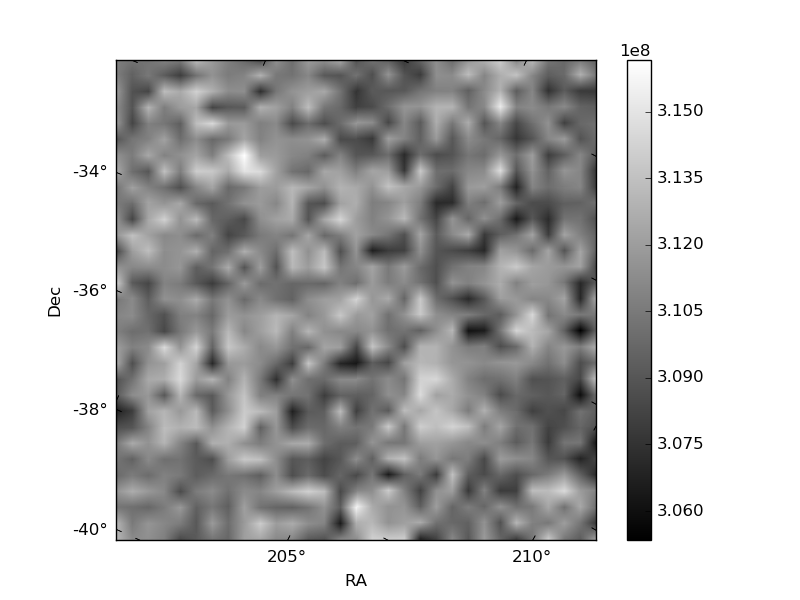
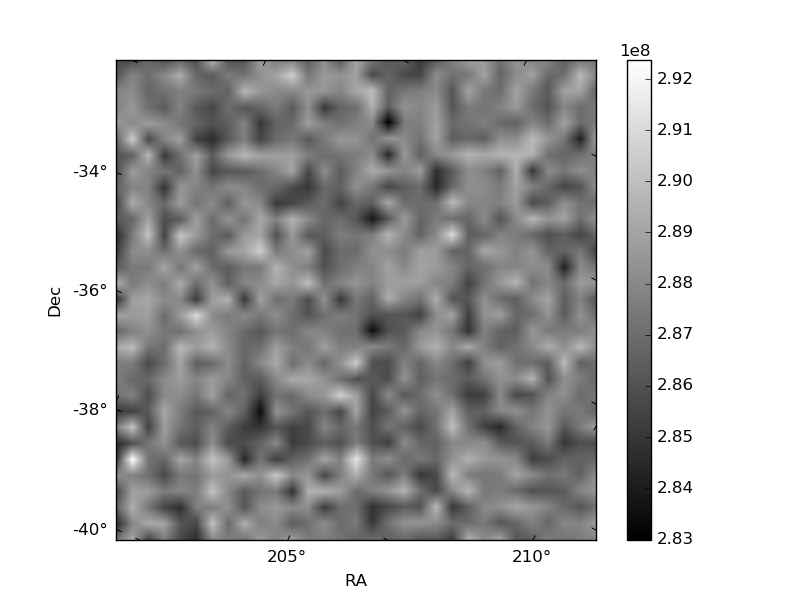
Histogram calculated using DETX and DETY for each event in the final _common_clean file
| Quadrant A | 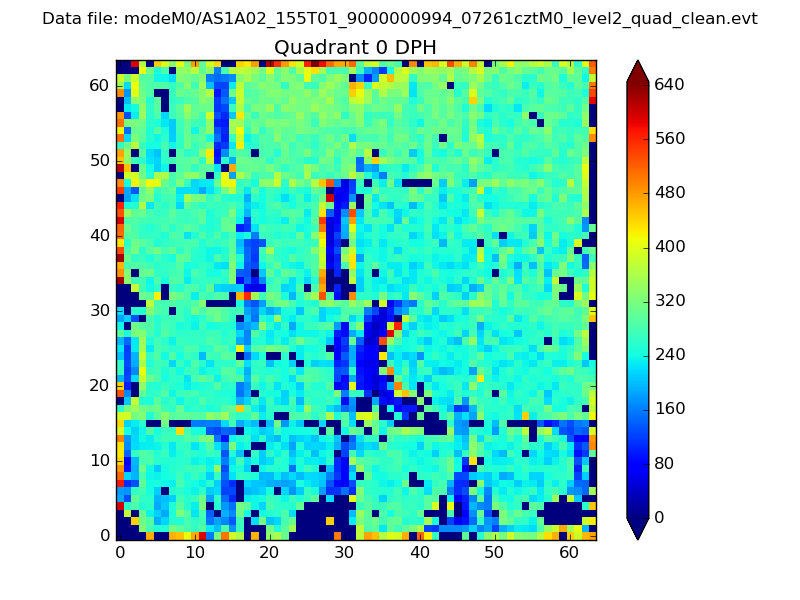 |
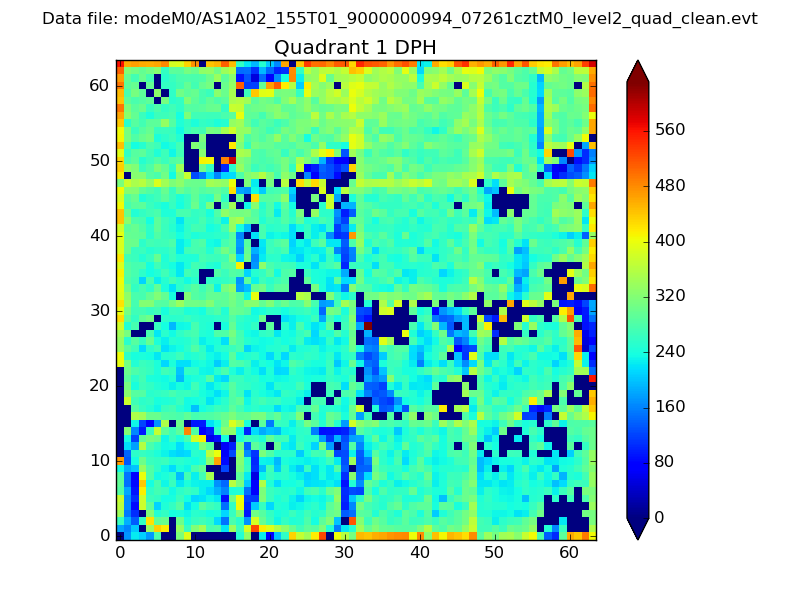 |
Quadrant B |
|---|---|---|---|
| Quadrant D | 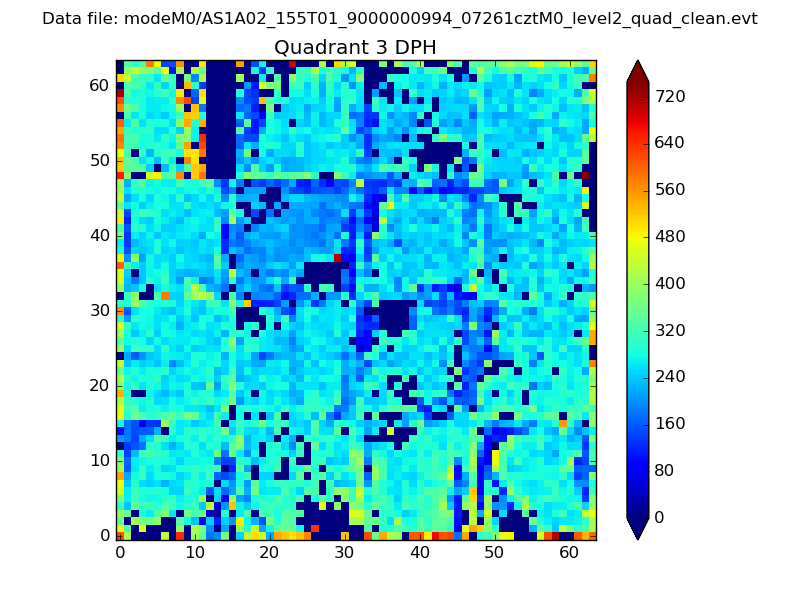 |
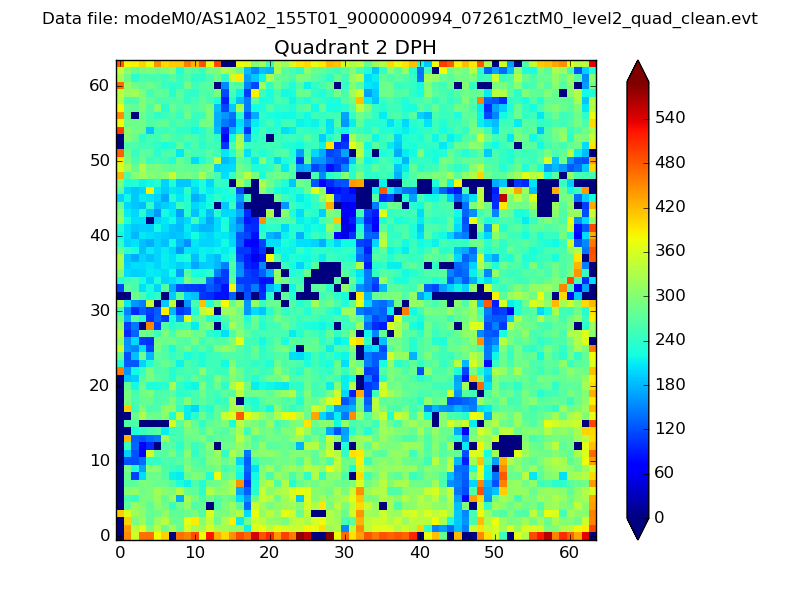 |
Quadrant C |
| Plot type | Count rate plots | Images |
|---|---|---|
| Comparison with Poisson distribution Blue bars denote a histogram of data divided into 1 sec bins. Red curve is a Poisson curve with rate = median count rate of data. |
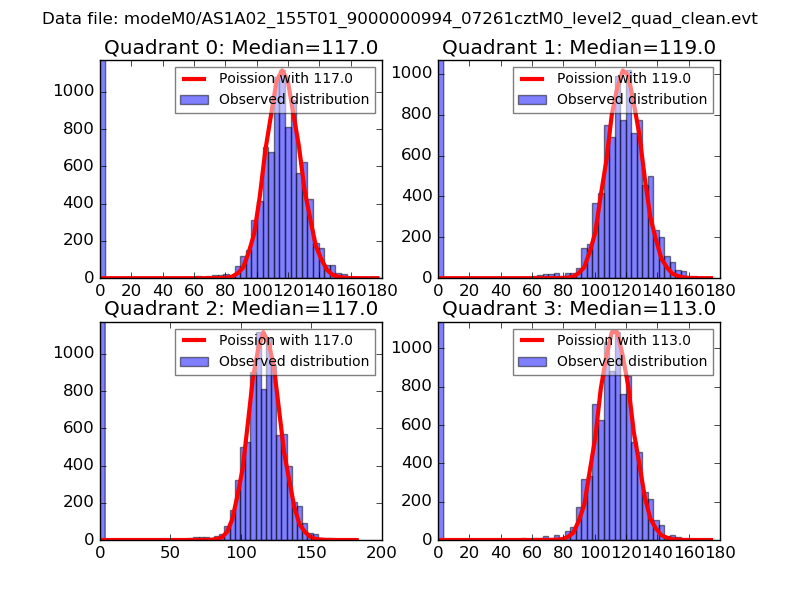 |
 |
| Quadrant-wise count rates Data is divided into 100 sec bins |
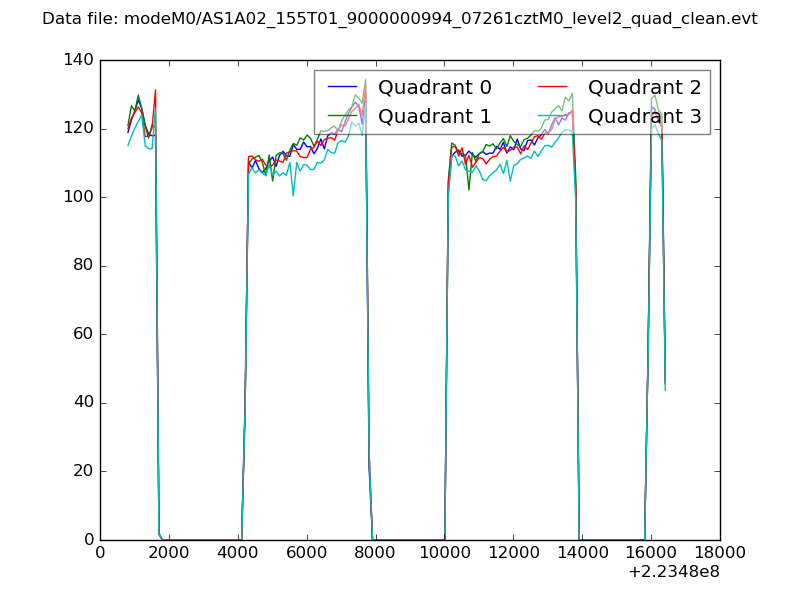 |
|
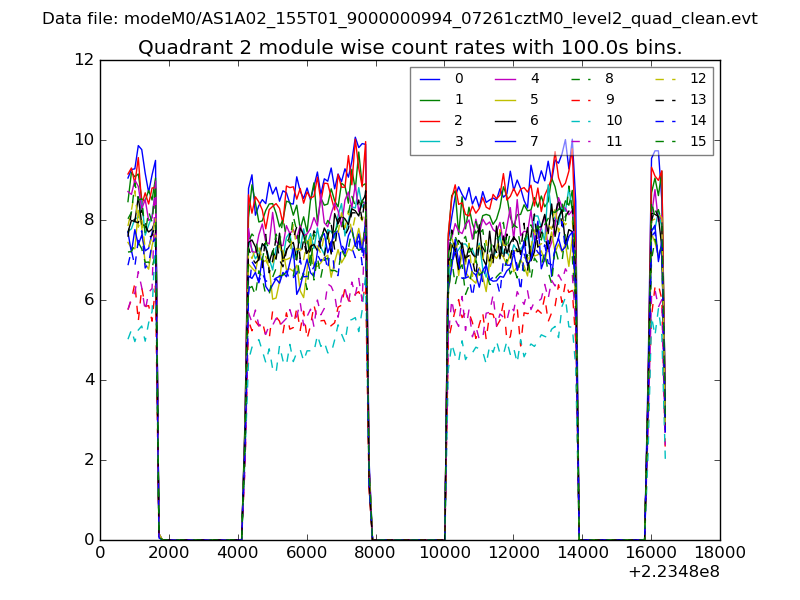
| Module-wise count rates for Quadrant A Data is divided into 100 sec bins |
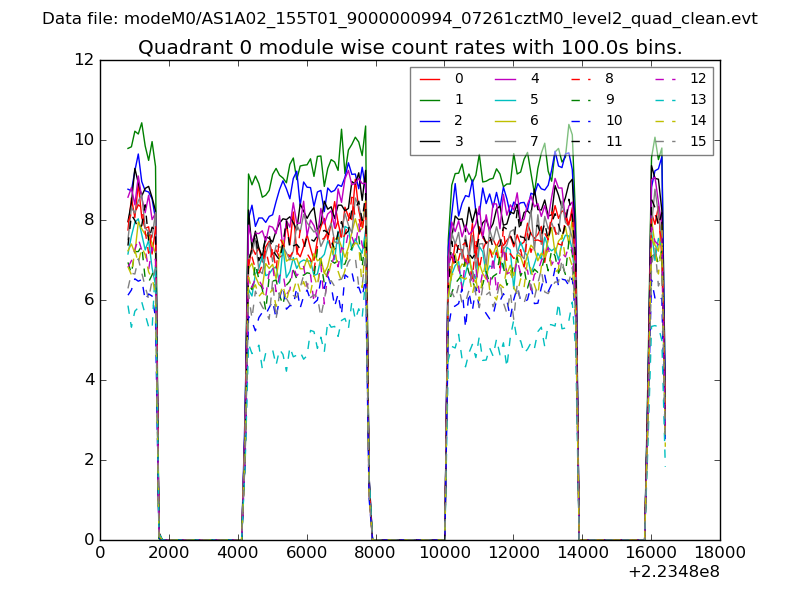 |
 |
| Module-wise count rates for Quadrant B Data is divided into 100 sec bins |
 |
 |
| Module-wise count rates for Quadrant C Data is divided into 100 sec bins |
 |
 |
| Module-wise count rates for Quadrant D Data is divided into 100 sec bins |
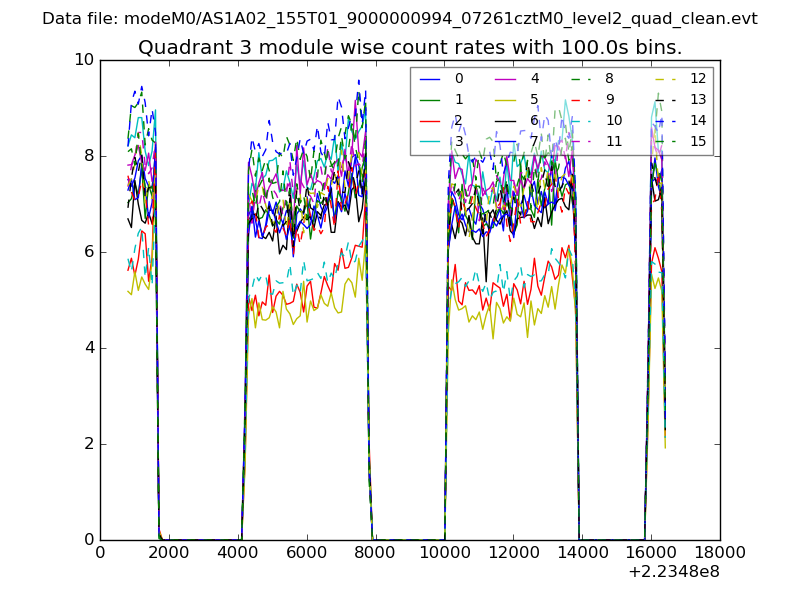 |
 |
| Parameter | Plot |
|---|---|
| CZT HV Monitor | 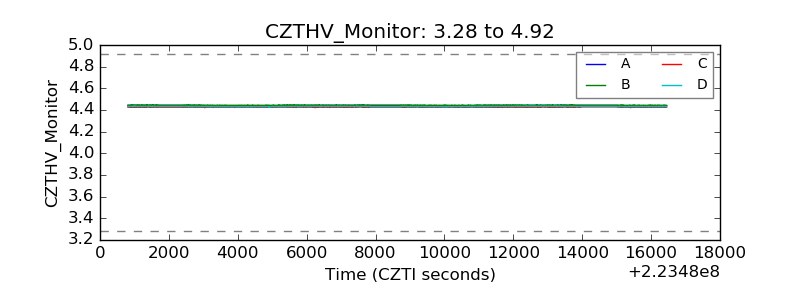 |
| D_VDD | 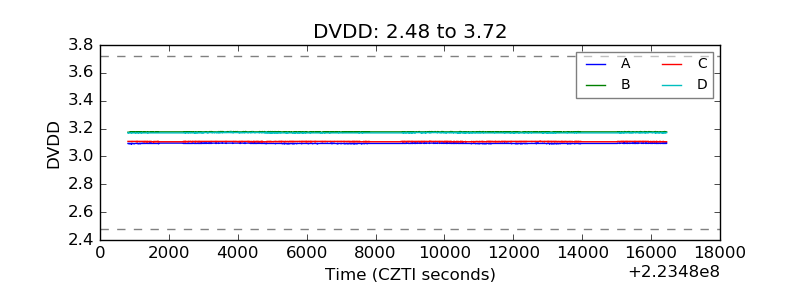 |
| Temperature 1 | 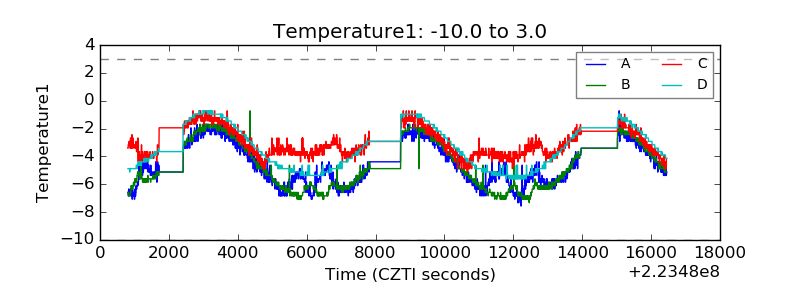 |
| Veto HV Monitor | 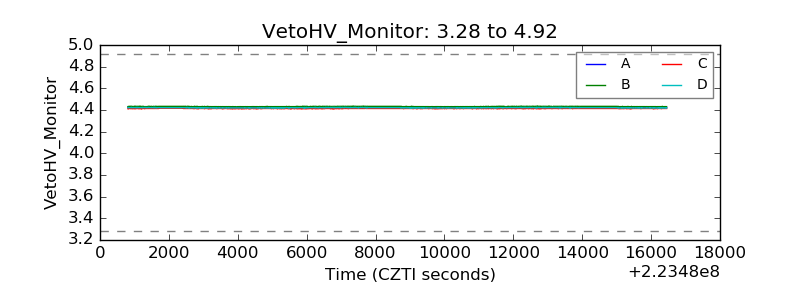 |
| Veto LLD | 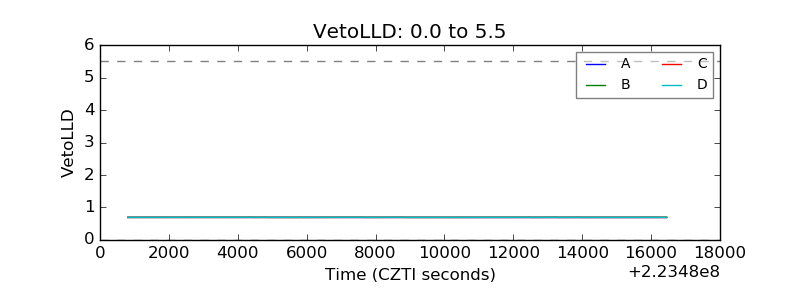 |
| Alpha Counter | 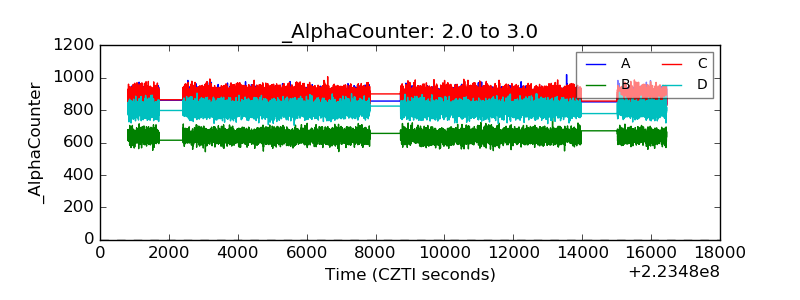 |
| _CPM_Rate | 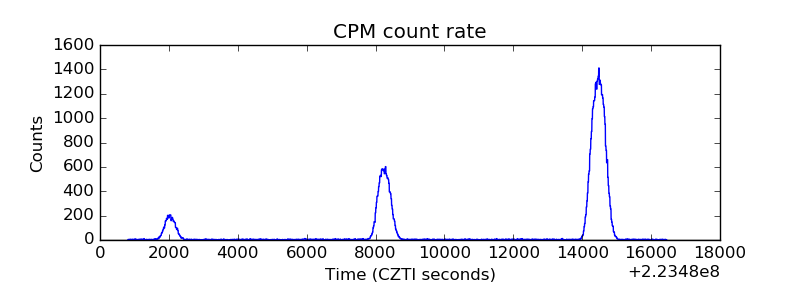 |
| CZT Counter | 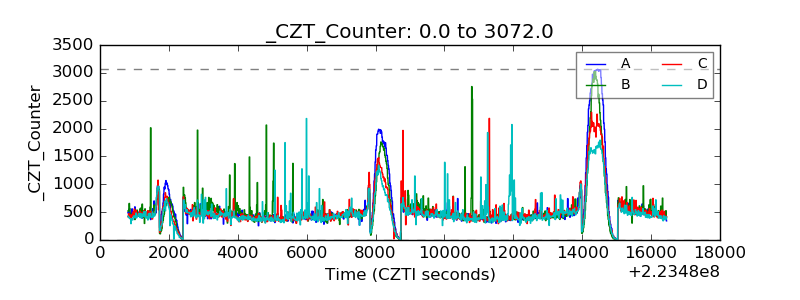 |
| +2.5 Volts monitor |  |
| +5 Volts monitor |  |
| _ROLL_ROT | 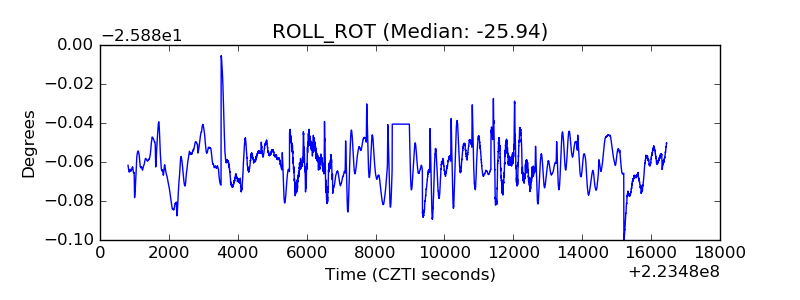 |
| _Roll_DEC | 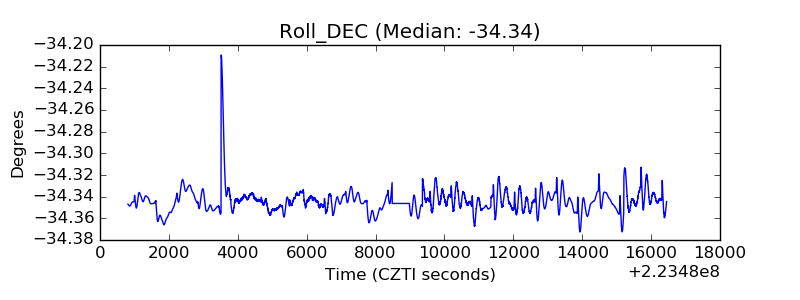 |
| _Roll_RA | 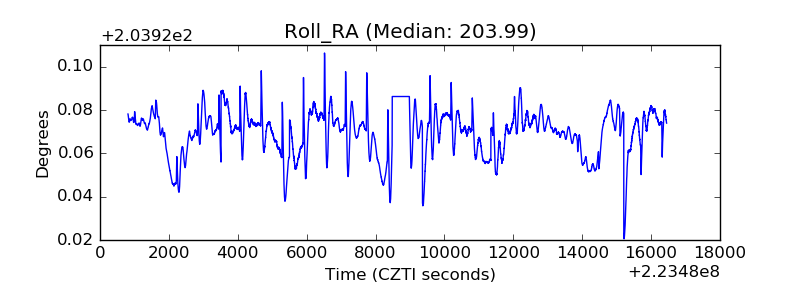 |
| Veto Counter | 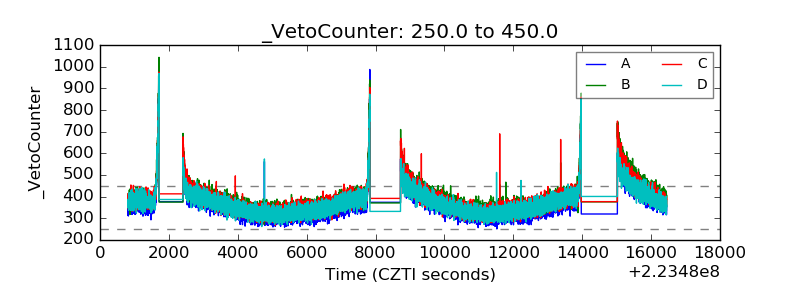 |