| Param | Original file | Final file |
|---|---|---|
| Filename | modeM0/AS1A02_155T01_9000000994_07263cztM0_level2.evt | modeM0/AS1A02_155T01_9000000994_07263cztM0_level2_quad_clean.evt |
| Size (bytes) | 447,935,040 | 88,156,800 |
| Size | 427.2 MB | 84.1 MB |
| Events in quadrant A | 3,086,778 | 560,620 |
| Events in quadrant B | 3,331,109 | 570,947 |
| Events in quadrant C | 3,359,590 | 554,030 |
| Events in quadrant D | 3,347,160 | 531,450 |
| Mode M9 | |||
|---|---|---|---|
| Quadrant | BADHDUFLAG | Total packets | Discarded packets |
| A | 0 | 22 | 0 |
| B | 0 | 22 | 0 |
| C | 0 | 22 | 0 |
| D | 0 | 22 | 0 |
| Mode M0 | |||
|---|---|---|---|
| Quadrant | BADHDUFLAG | Total packets | Discarded packets |
| A | 0 | 13557 | 3 |
| B | 0 | 14246 | 2 |
| C | 0 | 14243 | 2 |
| D | 0 | 14543 | 2 |
| Mode SS | |||
|---|---|---|---|
| Quadrant | BADHDUFLAG | Total packets | Discarded packets |
| A | 0 | 134 | 0 |
| B | 0 | 134 | 0 |
| C | 0 | 134 | 0 |
| D | 0 | 134 | 0 |
| Quadrant | Total seconds | Saturated seconds | Saturation percentage |
|---|---|---|---|
| A | 6488 | 81 | 1.248459% |
| B | 6488 | 116 | 1.787916% |
| C | 6488 | 70 | 1.078915% |
| D | 6488 | 144 | 2.219482% |
Noise dominated data is calculated using 1-second bins in cleaned event files. If a bin has >2000 counts, and if more than 50% of those come from <1% of pixels, then it is considered to be noise-dominated and hence unusable.
| Quadrant | # 1 sec bins | Bins with >0 counts | Bins with >2000 counts | High rate bins dominated by noise | Noise dominated (total time) | Noise dominated (detector-on time) | Marked lightcurve |
|---|---|---|---|---|---|---|---|
| A | 8708 | 6488 | 1 | 1 | 0.01% | 0.02% | 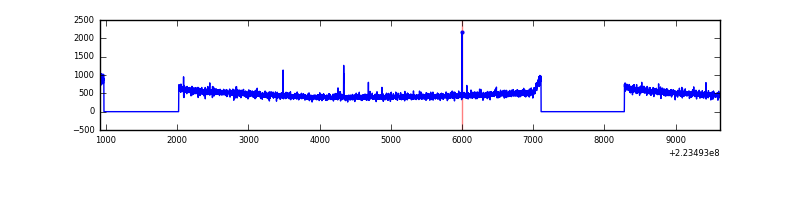 |
| B | 8708 | 6488 | 12 | 12 | 0.14% | 0.18% | 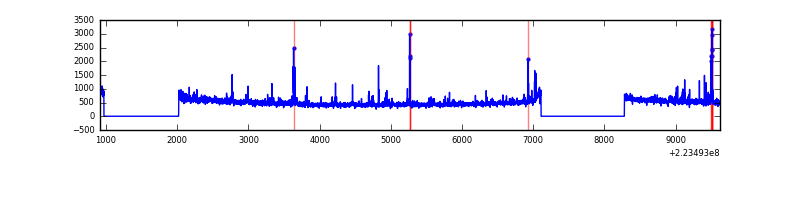 |
| C | 8708 | 6488 | 17 | 17 | 0.20% | 0.26% | 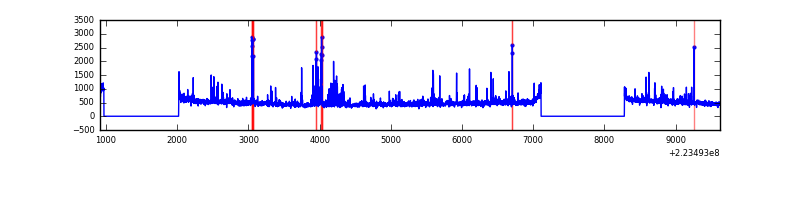 |
| D | 8708 | 6488 | 84 | 84 | 0.96% | 1.29% | 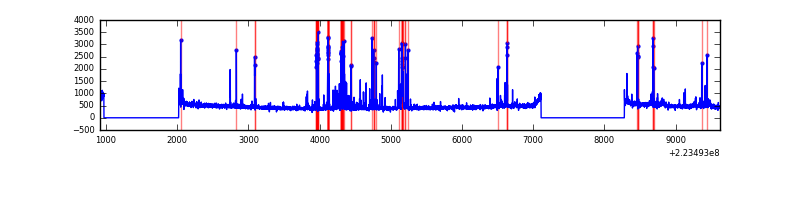 |
Top three noisy pixels from each quadrant. If the there are fewer than three noisy pixels in the level2.evt file, extra rows are filled as -1
| Pixel properties | Quadrant properties | ||||||
|---|---|---|---|---|---|---|---|
| Quadrant | DetID | PixID | Counts | Sigma | Mean | Median | Sigma |
| A | 8 | 15 | 26154 | 159.19 | 790 | 773 | 159.4 |
| A | 15 | 174 | 10867 | 63.31 | 790 | 773 | 159.4 |
| A | 0 | 226 | 7606 | 42.86 | 790 | 773 | 159.4 |
| B | 0 | 214 | 69182 | 449.02 | 800 | 782 | 152.3 |
| B | 4 | 81 | 68547 | 444.86 | 800 | 782 | 152.3 |
| B | 4 | 239 | 42667 | 274.96 | 800 | 782 | 152.3 |
| C | 7 | 247 | 325762 | 1836.38 | 766 | 768 | 177.0 |
| C | 9 | 68 | 33009 | 182.18 | 766 | 768 | 177.0 |
| C | 1 | 16 | 6957 | 34.97 | 766 | 768 | 177.0 |
| D | 2 | 14 | 265092 | 1437.41 | 756 | 735 | 183.9 |
| D | 14 | 34 | 137846 | 745.52 | 756 | 735 | 183.9 |
| D | 2 | 33 | 66327 | 356.65 | 756 | 735 | 183.9 |
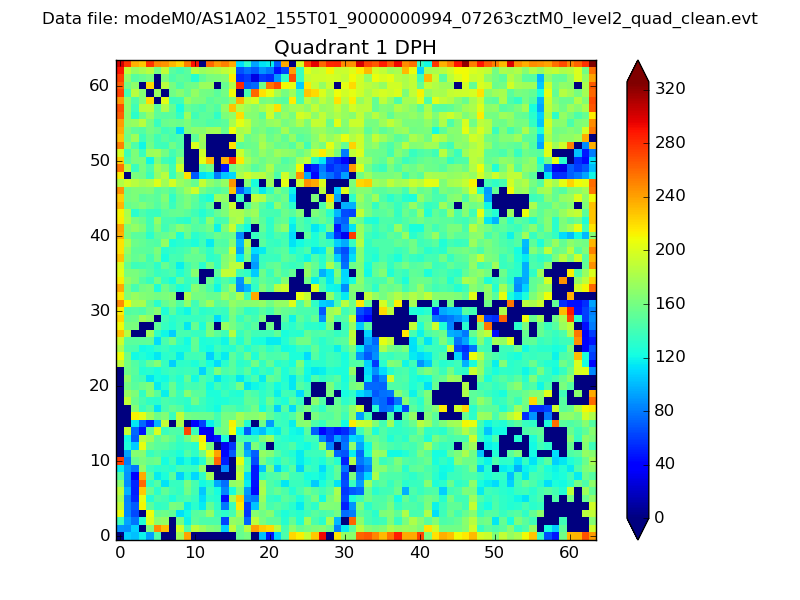
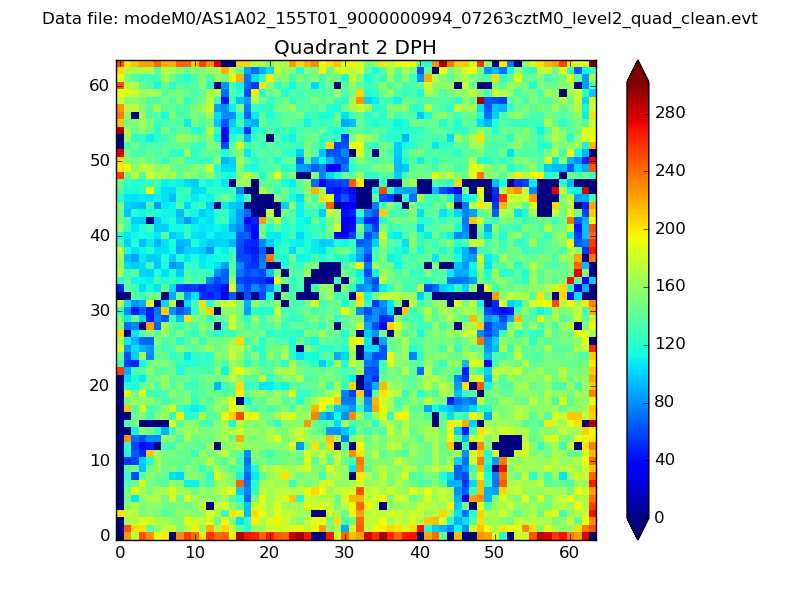
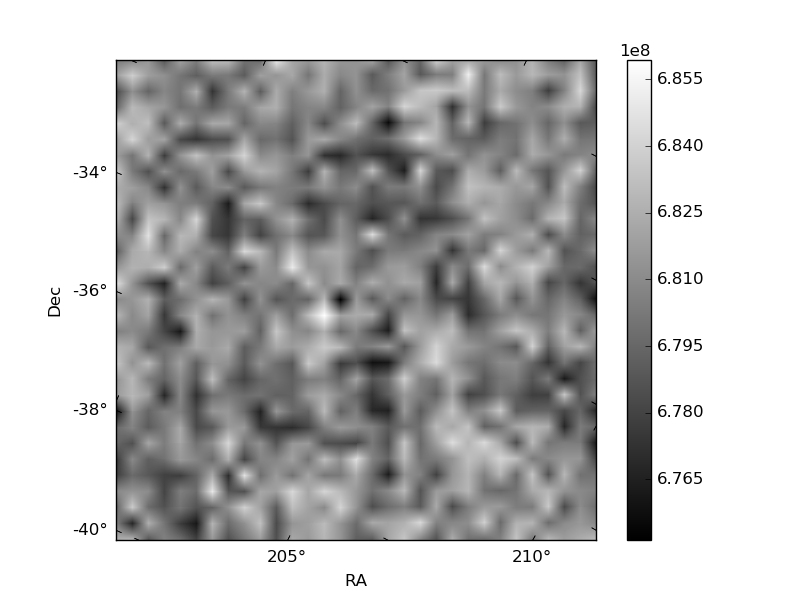
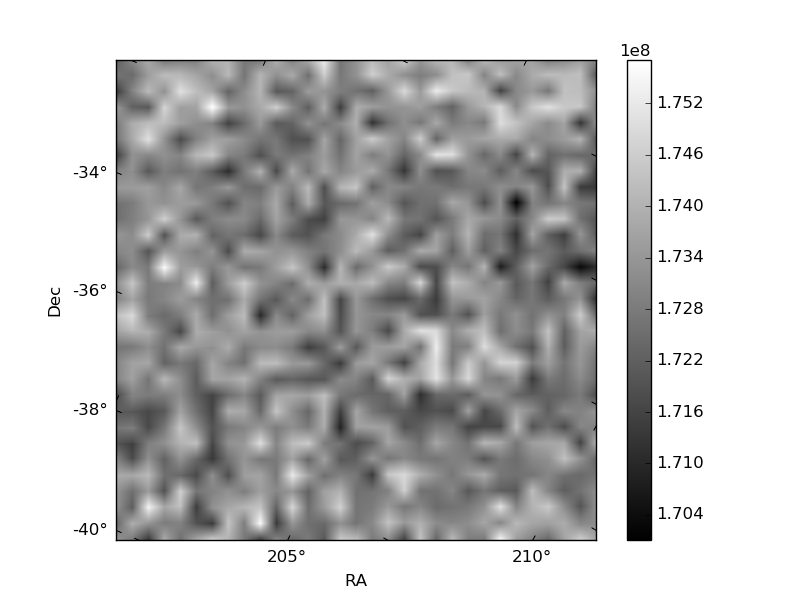
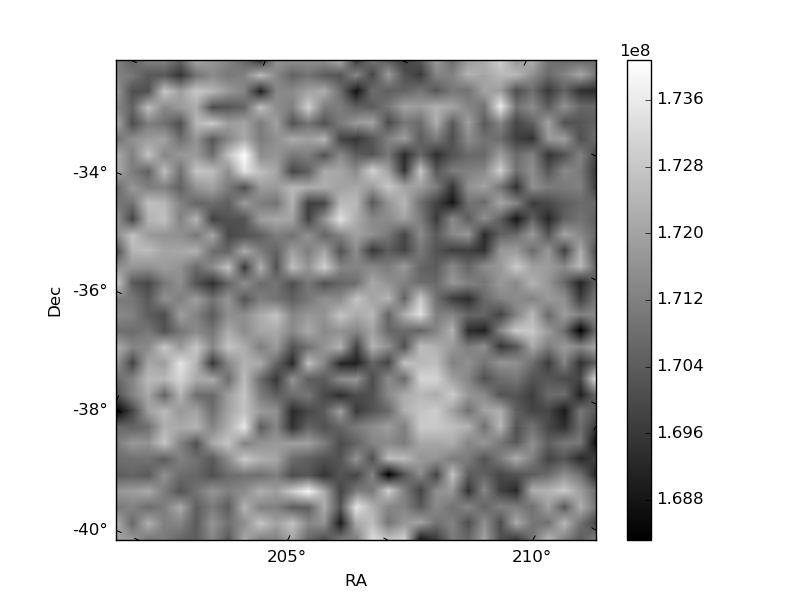
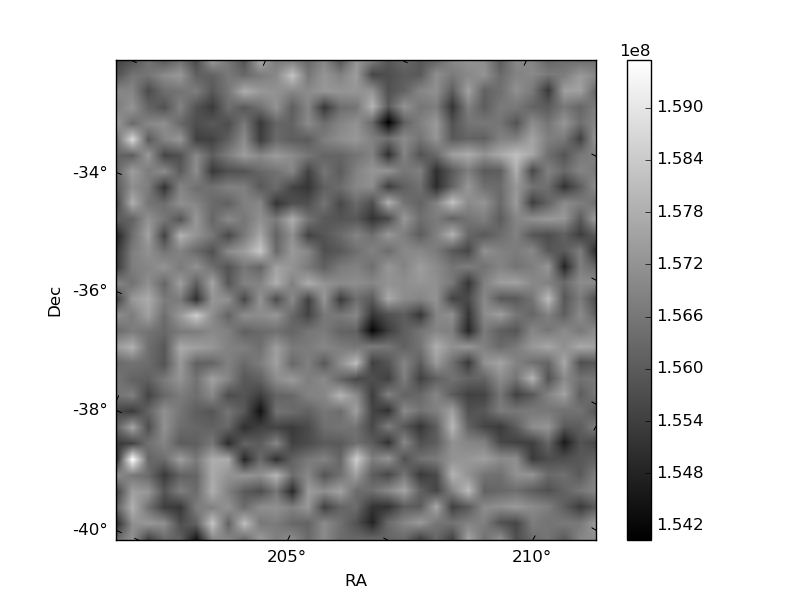
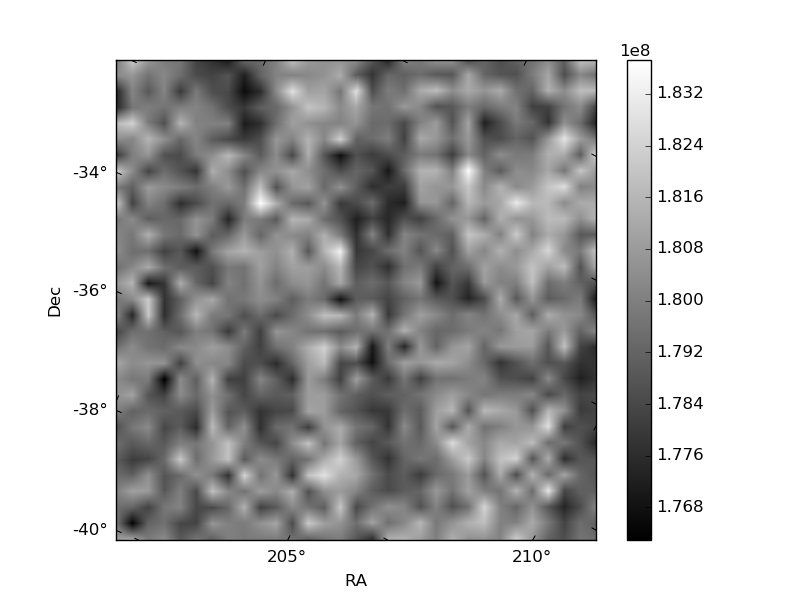
Histogram calculated using DETX and DETY for each event in the final _common_clean file
| Quadrant A |  |
 |
Quadrant B |
|---|---|---|---|
| Quadrant D | 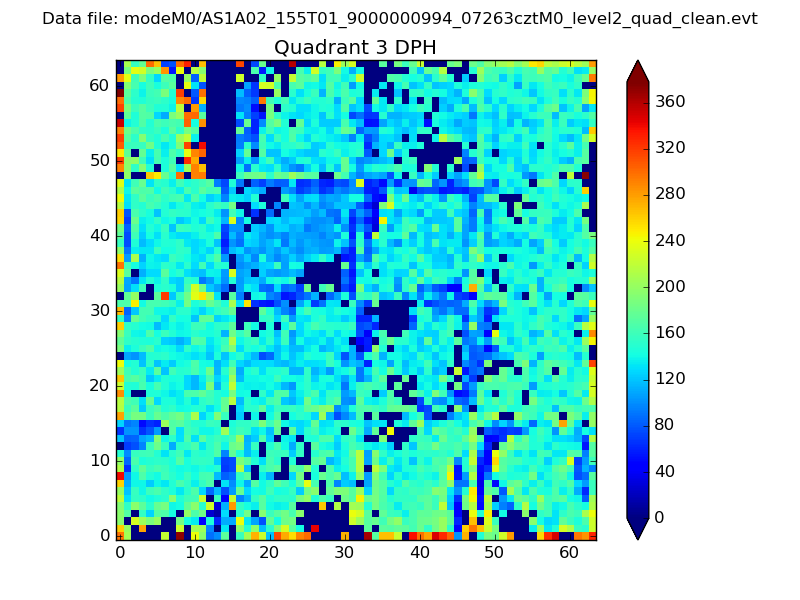 |
 |
Quadrant C |
| Plot type | Count rate plots | Images |
|---|---|---|
| Comparison with Poisson distribution Blue bars denote a histogram of data divided into 1 sec bins. Red curve is a Poisson curve with rate = median count rate of data. |
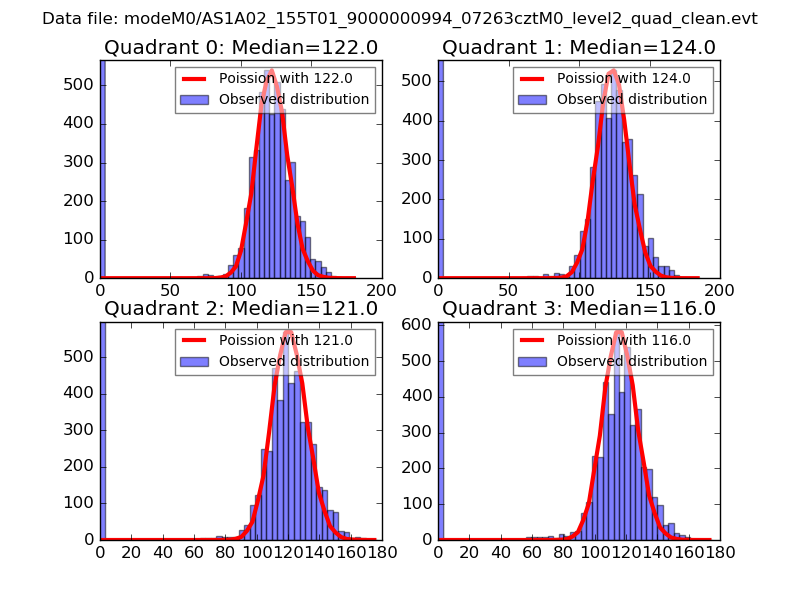 |
 |
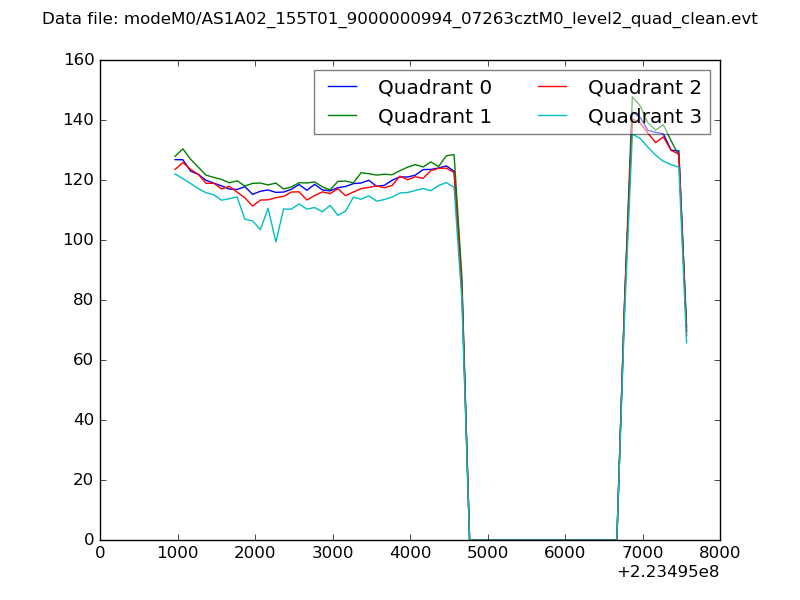
| Quadrant-wise count rates Data is divided into 100 sec bins |
 |
|
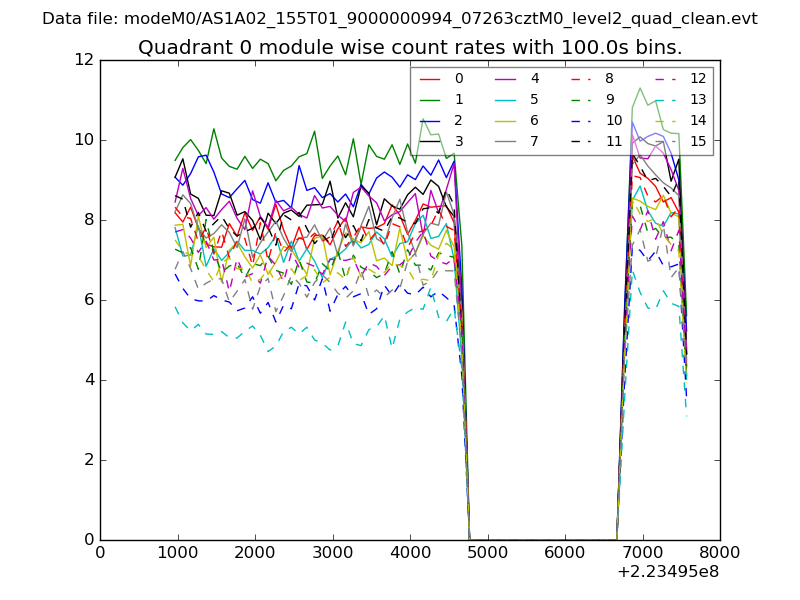
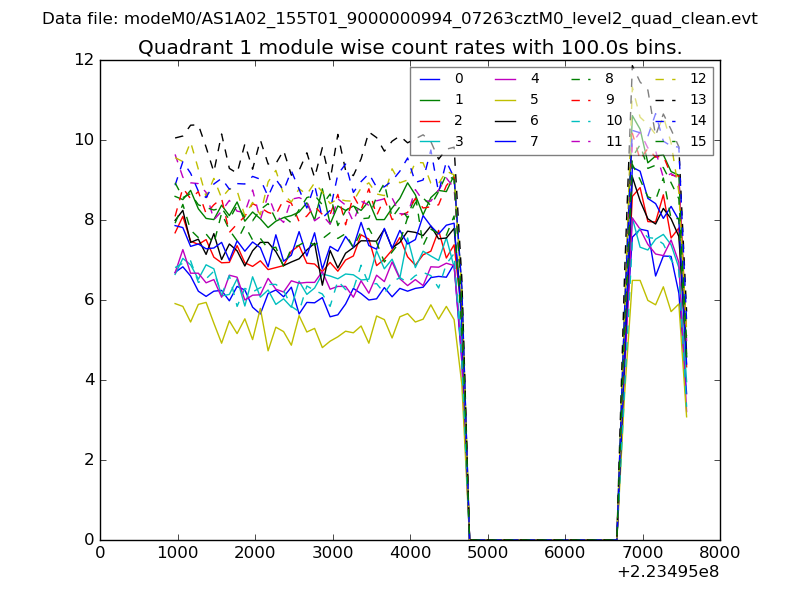
| Module-wise count rates for Quadrant A Data is divided into 100 sec bins |
 |
 |
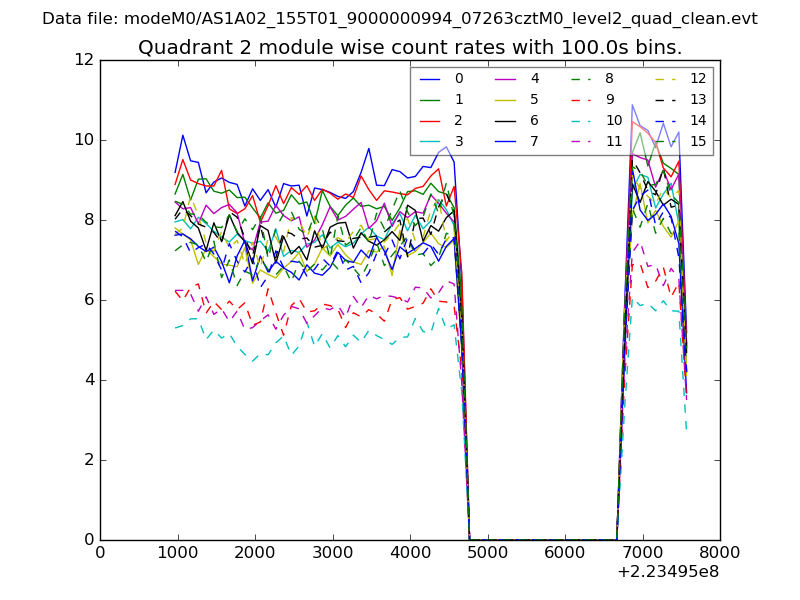
| Module-wise count rates for Quadrant B Data is divided into 100 sec bins |
 |
 |
| Module-wise count rates for Quadrant C Data is divided into 100 sec bins |
 |
 |
| Module-wise count rates for Quadrant D Data is divided into 100 sec bins |
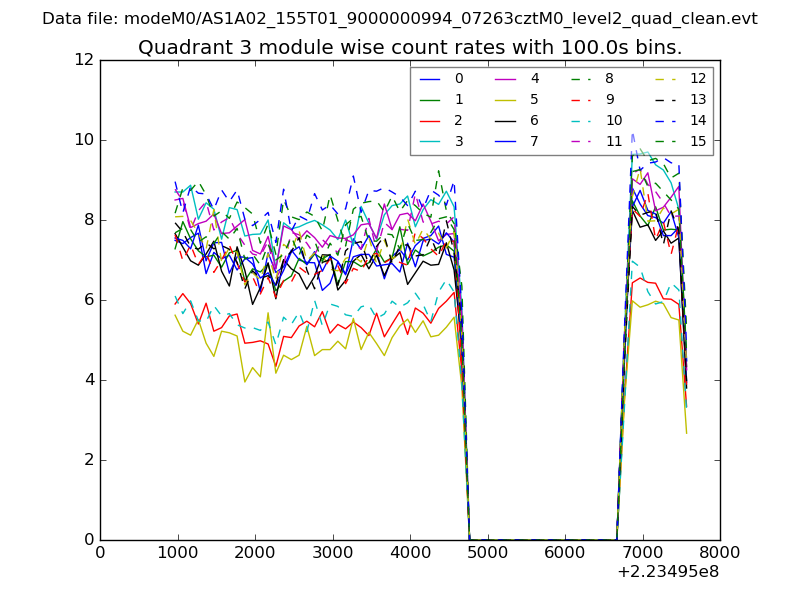 |
 |
| Parameter | Plot |
|---|---|
| CZT HV Monitor | 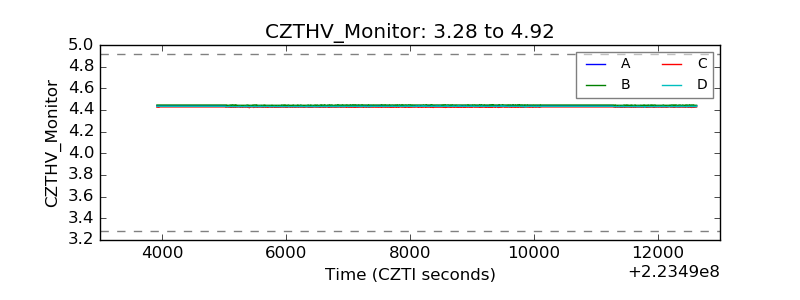 |
| D_VDD | 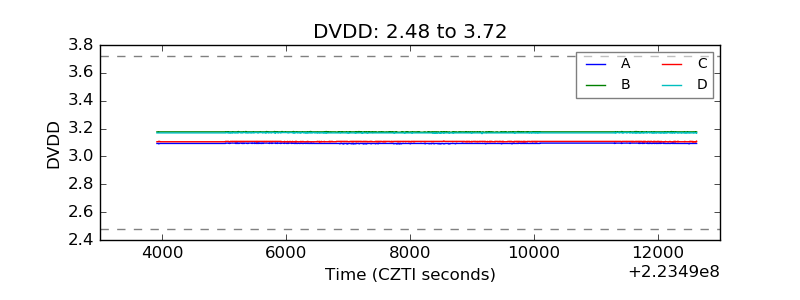 |
| Temperature 1 | 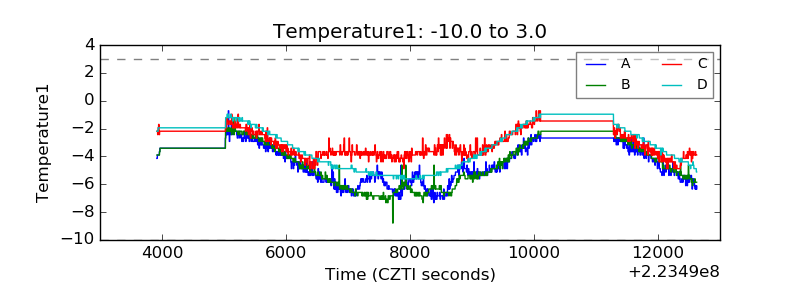 |
| Veto HV Monitor | 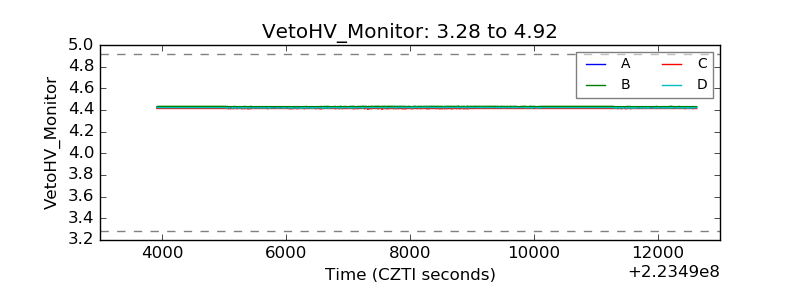 |
| Veto LLD | 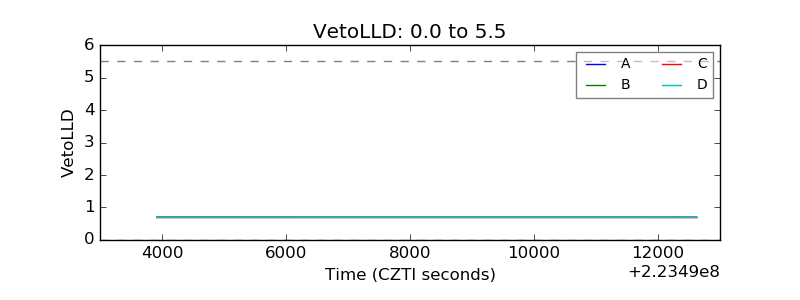 |
| Alpha Counter | 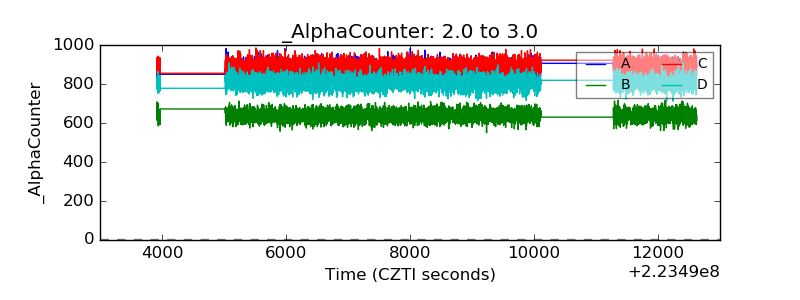 |
| _CPM_Rate | 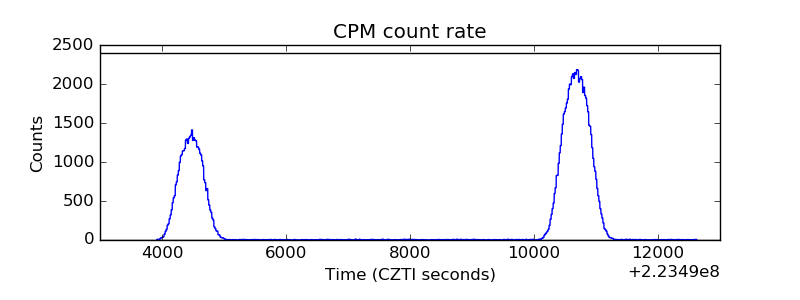 |
| CZT Counter | 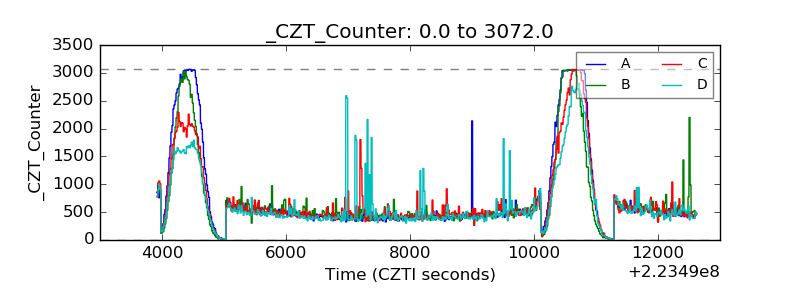 |
| +2.5 Volts monitor |  |
| +5 Volts monitor | 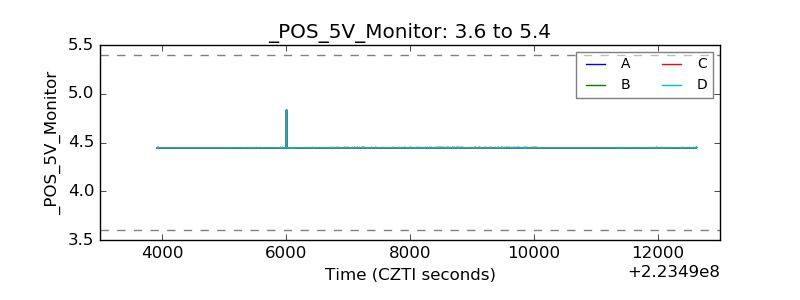 |
| _ROLL_ROT | 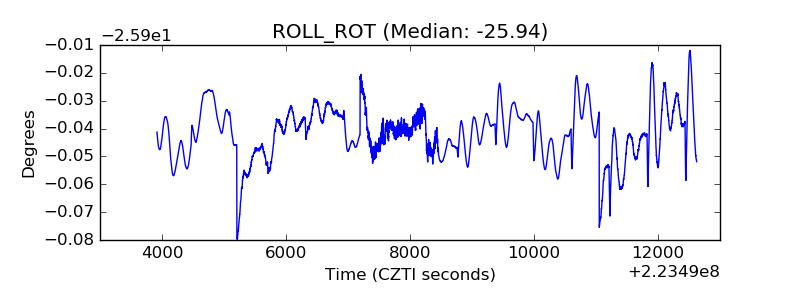 |
| _Roll_DEC | 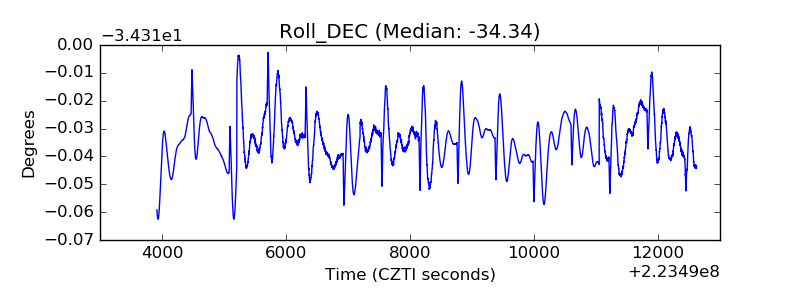 |
| _Roll_RA | 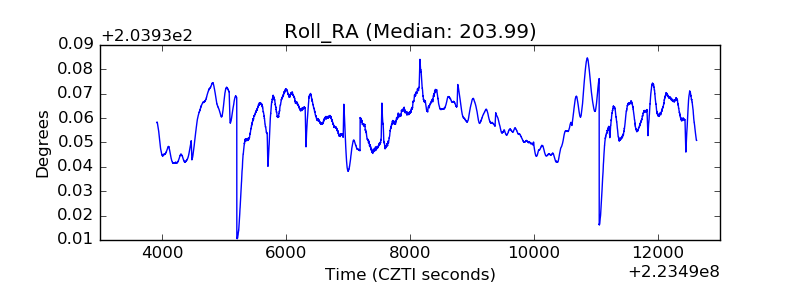 |
| Veto Counter | 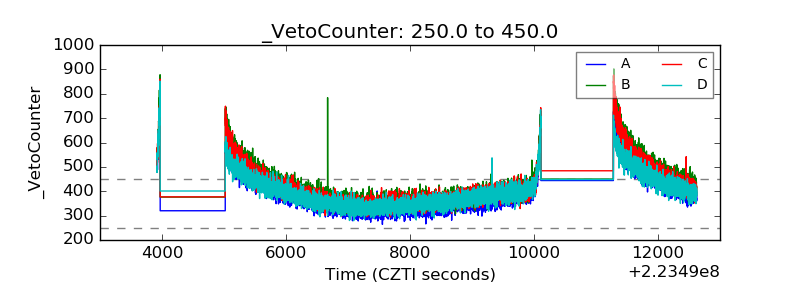 |