| Param | Original file | Final file |
|---|---|---|
| Filename | modeM0/AS1A02_155T01_9000000994_07264cztM0_level2.evt | modeM0/AS1A02_155T01_9000000994_07264cztM0_level2_quad_clean.evt |
| Size (bytes) | 434,064,960 | 97,882,560 |
| Size | 414.0 MB | 93.3 MB |
| Events in quadrant A | 2,998,264 | 638,187 |
| Events in quadrant B | 3,289,976 | 656,321 |
| Events in quadrant C | 3,310,699 | 633,641 |
| Events in quadrant D | 3,123,618 | 601,774 |
| Mode M9 | |||
|---|---|---|---|
| Quadrant | BADHDUFLAG | Total packets | Discarded packets |
| A | 0 | 17 | 0 |
| B | 0 | 17 | 0 |
| C | 0 | 17 | 0 |
| D | 0 | 18 | 0 |
| Mode M0 | |||
|---|---|---|---|
| Quadrant | BADHDUFLAG | Total packets | Discarded packets |
| A | 0 | 13101 | 3 |
| B | 0 | 13947 | 2 |
| C | 0 | 13913 | 2 |
| D | 0 | 13647 | 2 |
| Mode SS | |||
|---|---|---|---|
| Quadrant | BADHDUFLAG | Total packets | Discarded packets |
| A | 0 | 126 | 0 |
| B | 0 | 126 | 0 |
| C | 0 | 126 | 0 |
| D | 0 | 126 | 0 |
| Quadrant | Total seconds | Saturated seconds | Saturation percentage |
|---|---|---|---|
| A | 6226 | 31 | 0.497912% |
| B | 6226 | 86 | 1.381304% |
| C | 6226 | 15 | 0.240925% |
| D | 6226 | 68 | 1.092194% |
Noise dominated data is calculated using 1-second bins in cleaned event files. If a bin has >2000 counts, and if more than 50% of those come from <1% of pixels, then it is considered to be noise-dominated and hence unusable.
| Quadrant | # 1 sec bins | Bins with >0 counts | Bins with >2000 counts | High rate bins dominated by noise | Noise dominated (total time) | Noise dominated (detector-on time) | Marked lightcurve |
|---|---|---|---|---|---|---|---|
| A | 7511 | 6227 | 0 | 0 | 0.00% | 0.00% | 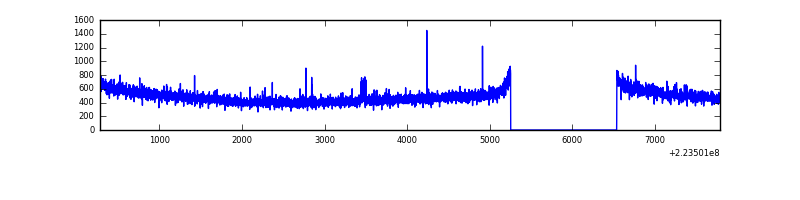 |
| B | 7511 | 6227 | 35 | 35 | 0.47% | 0.56% | 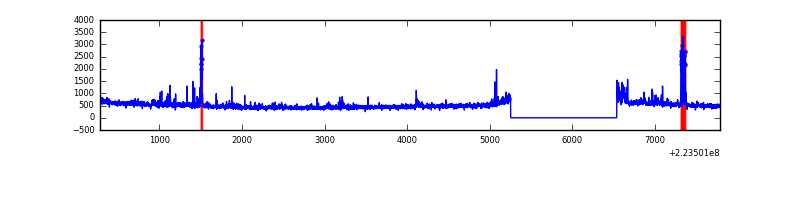 |
| C | 7511 | 6227 | 2 | 2 | 0.03% | 0.03% | 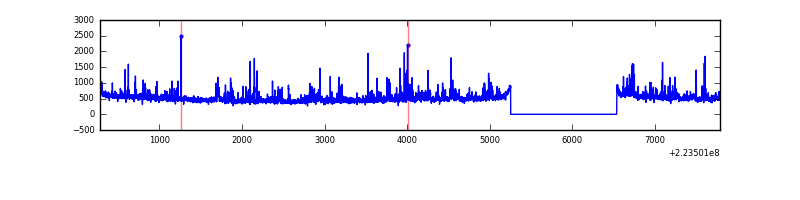 |
| D | 7511 | 6227 | 42 | 42 | 0.56% | 0.67% | 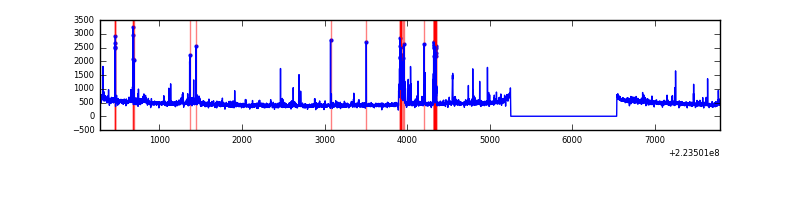 |
Top three noisy pixels from each quadrant. If the there are fewer than three noisy pixels in the level2.evt file, extra rows are filled as -1
| Pixel properties | Quadrant properties | ||||||
|---|---|---|---|---|---|---|---|
| Quadrant | DetID | PixID | Counts | Sigma | Mean | Median | Sigma |
| A | 8 | 15 | 28300 | 177.69 | 765 | 749 | 155.0 |
| A | 14 | 111 | 17792 | 109.92 | 765 | 749 | 155.0 |
| A | 0 | 226 | 7395 | 42.86 | 765 | 749 | 155.0 |
| B | 4 | 239 | 115720 | 786.84 | 779 | 764 | 146.1 |
| B | 0 | 214 | 62520 | 422.7 | 779 | 764 | 146.1 |
| B | 4 | 81 | 54590 | 368.42 | 779 | 764 | 146.1 |
| C | 7 | 247 | 380606 | 2217.02 | 744 | 748 | 171.3 |
| C | 9 | 68 | 13523 | 74.56 | 744 | 748 | 171.3 |
| C | 7 | 190 | 7841 | 41.4 | 744 | 748 | 171.3 |
| D | 2 | 14 | 217196 | 1208.85 | 733 | 711 | 179.1 |
| D | 2 | 33 | 83948 | 464.79 | 733 | 711 | 179.1 |
| D | 2 | 216 | 43229 | 237.42 | 733 | 711 | 179.1 |
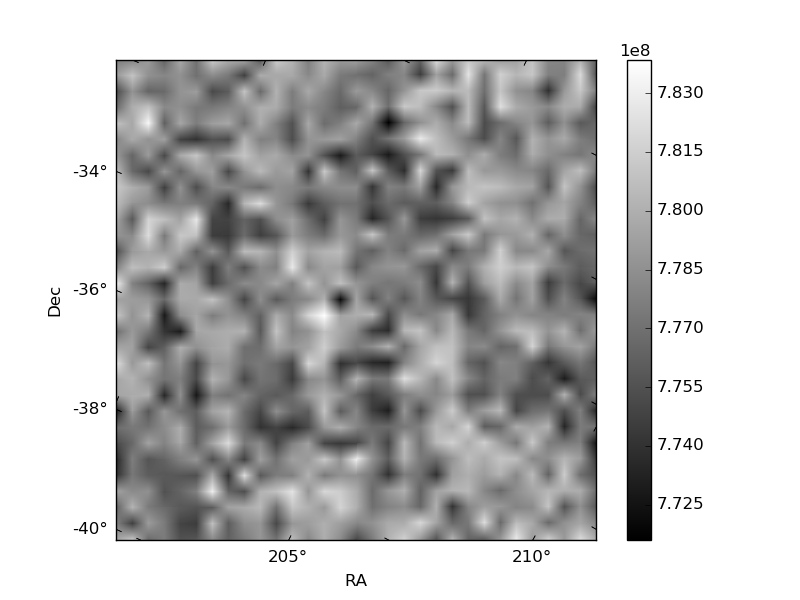
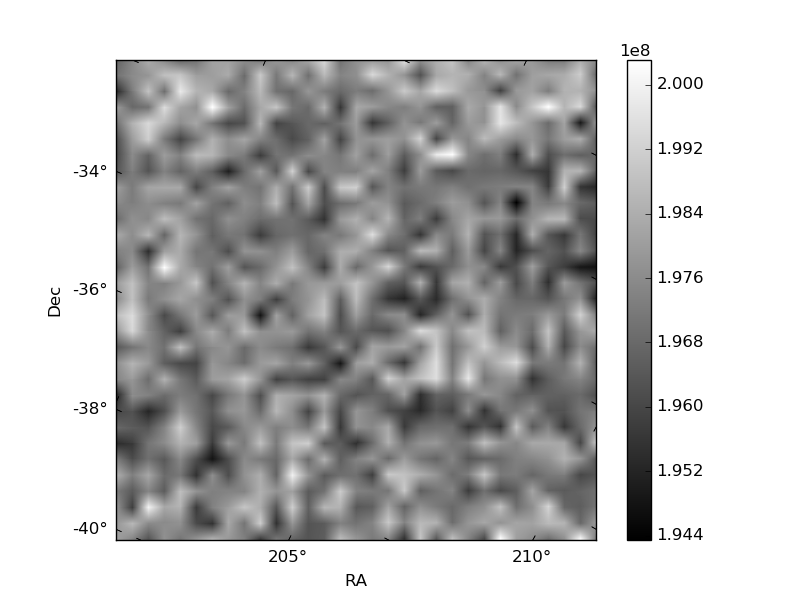
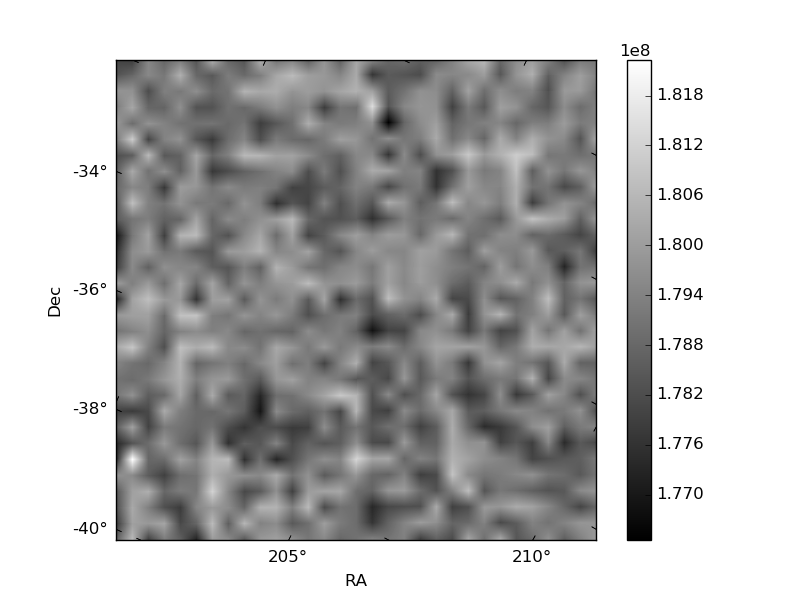
Histogram calculated using DETX and DETY for each event in the final _common_clean file
| Quadrant A | 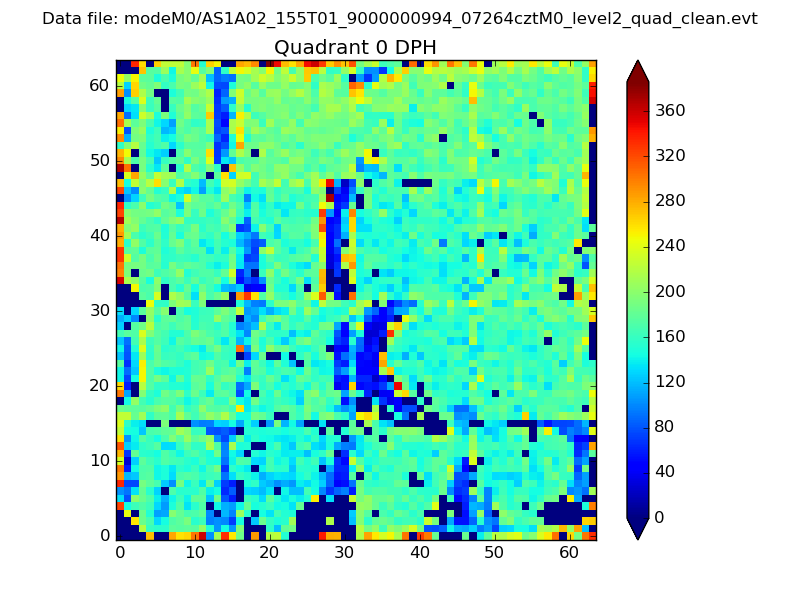 |
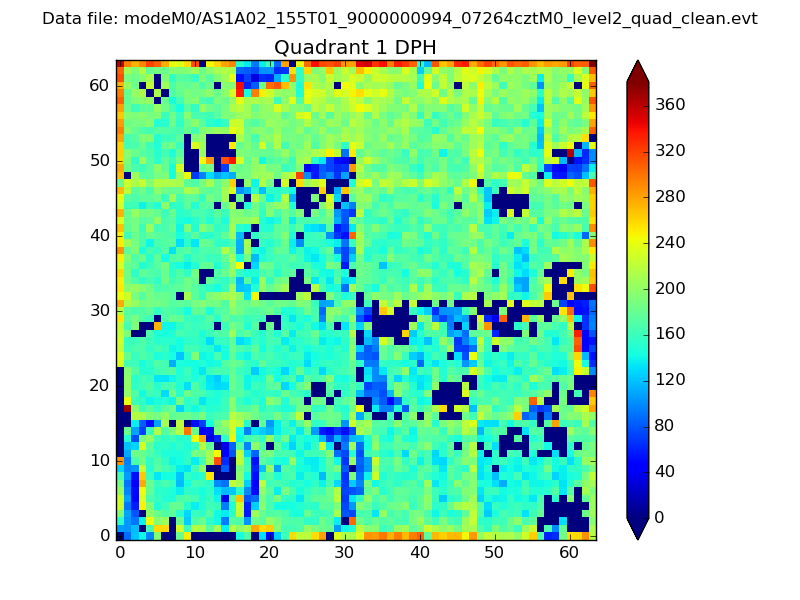 |
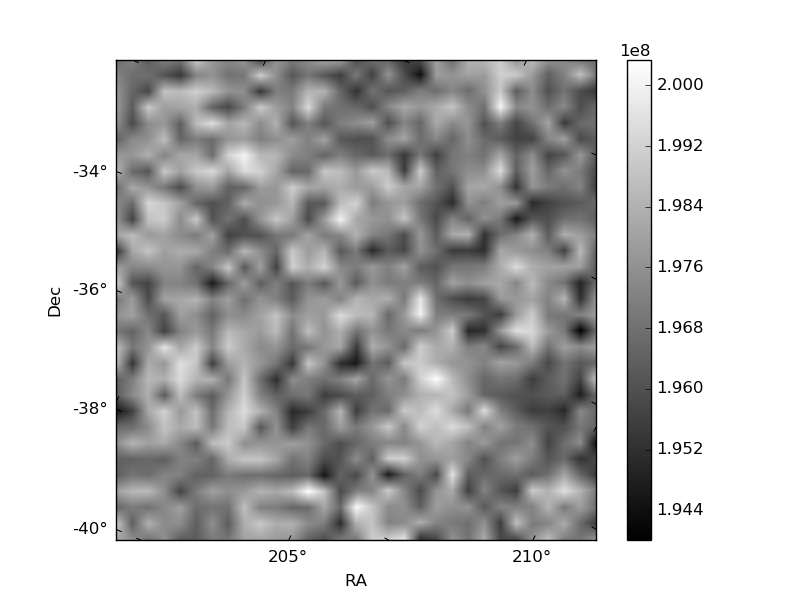
Quadrant B |
|---|---|---|---|
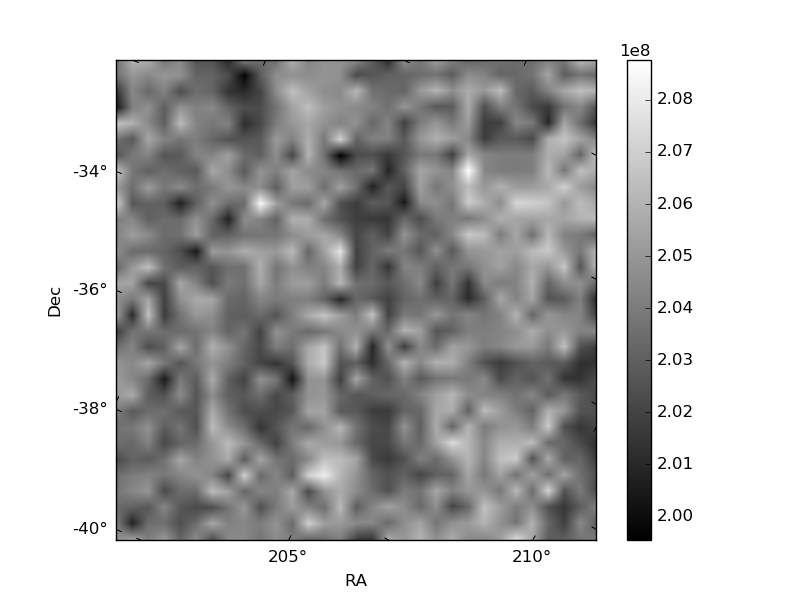
| Quadrant D | 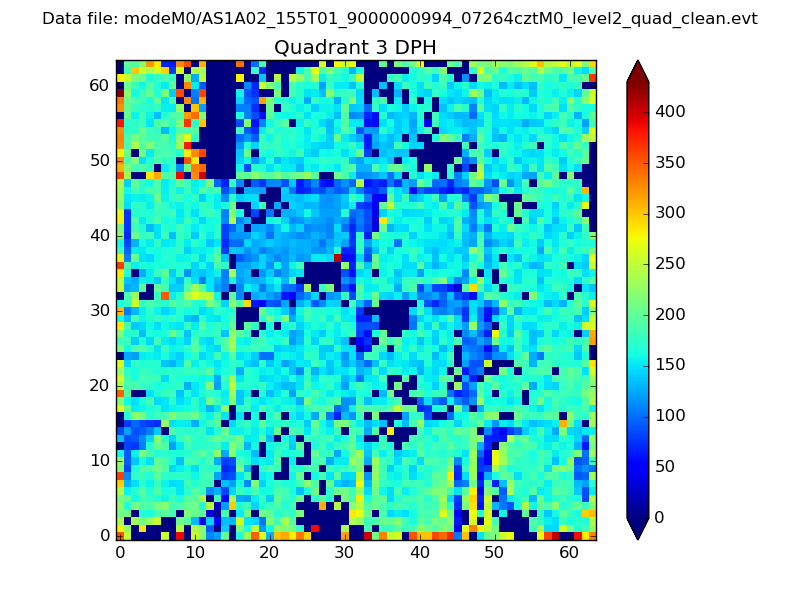 |
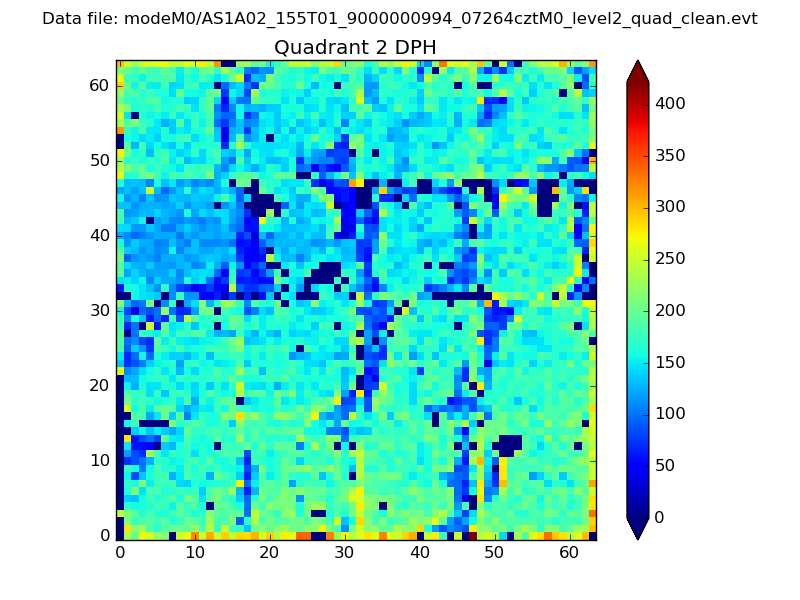 |
Quadrant C |
| Plot type | Count rate plots | Images |
|---|---|---|
| Comparison with Poisson distribution Blue bars denote a histogram of data divided into 1 sec bins. Red curve is a Poisson curve with rate = median count rate of data. |
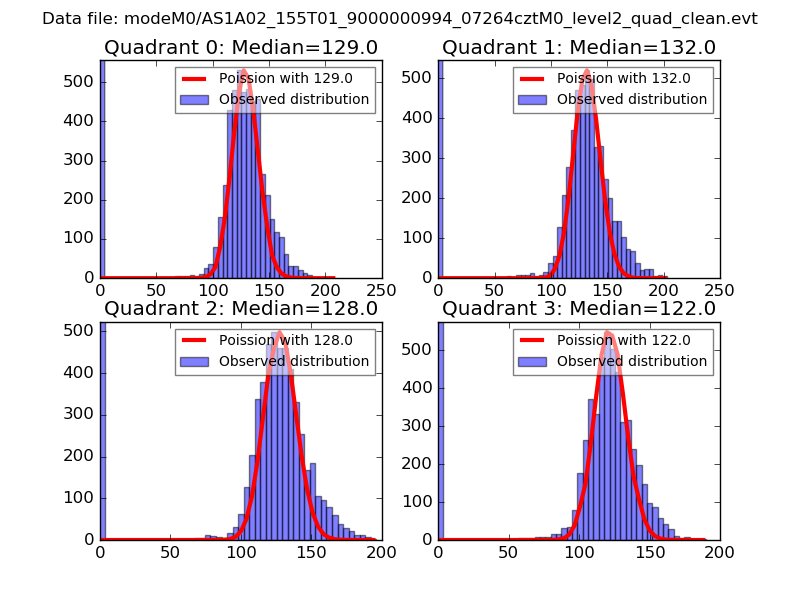 |
 |
| Quadrant-wise count rates Data is divided into 100 sec bins |
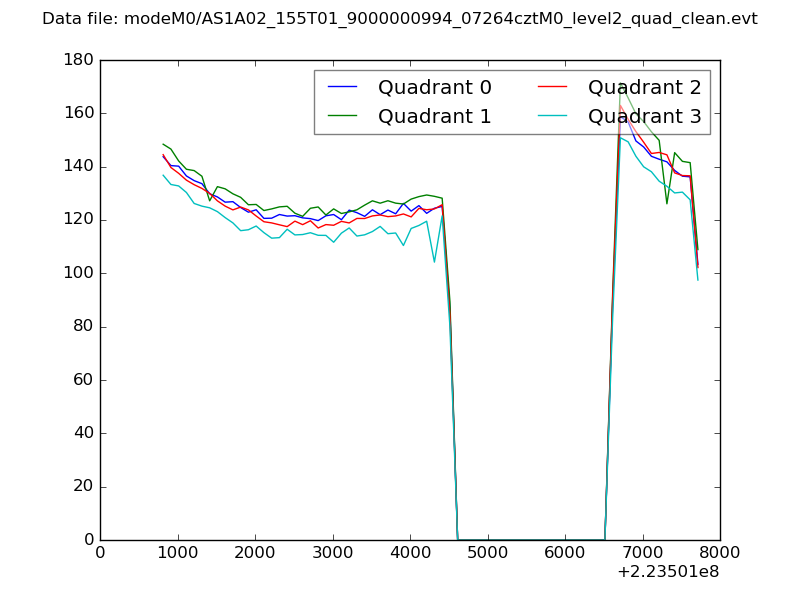 |
|
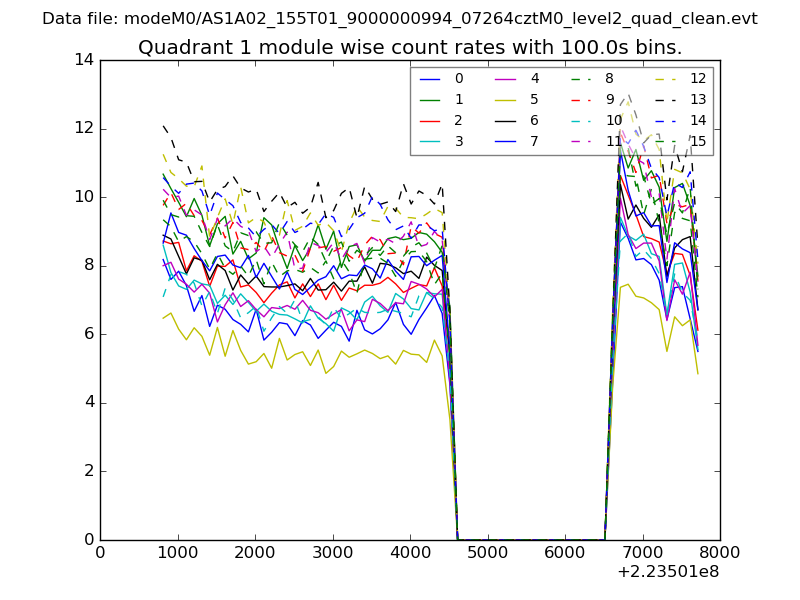
| Module-wise count rates for Quadrant A Data is divided into 100 sec bins |
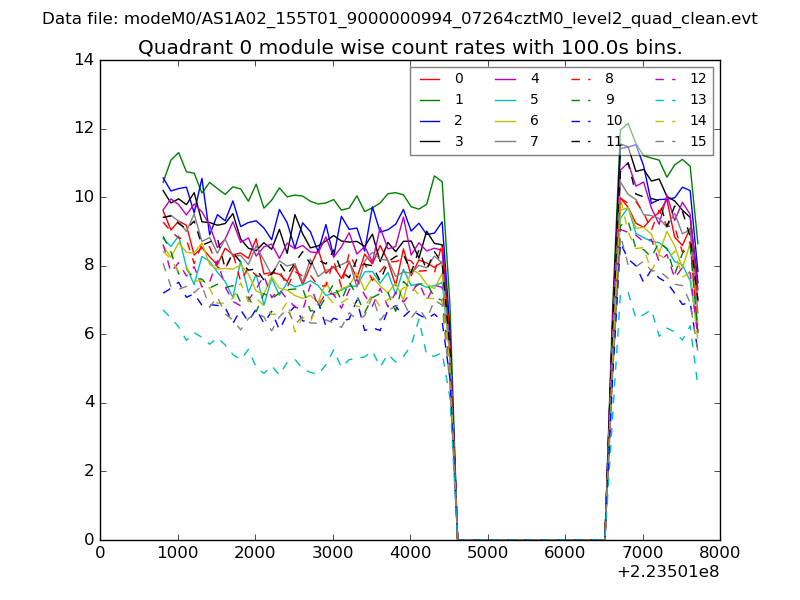 |
 |
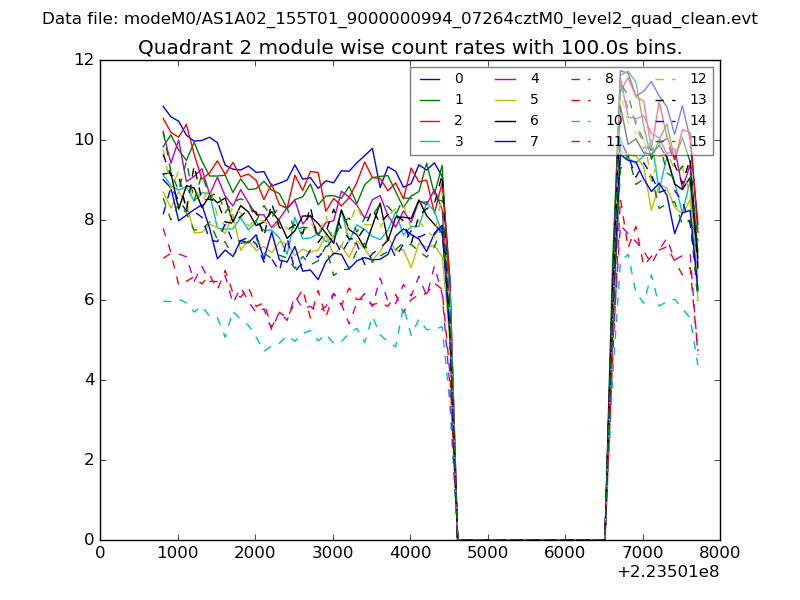
| Module-wise count rates for Quadrant B Data is divided into 100 sec bins |
 |
 |
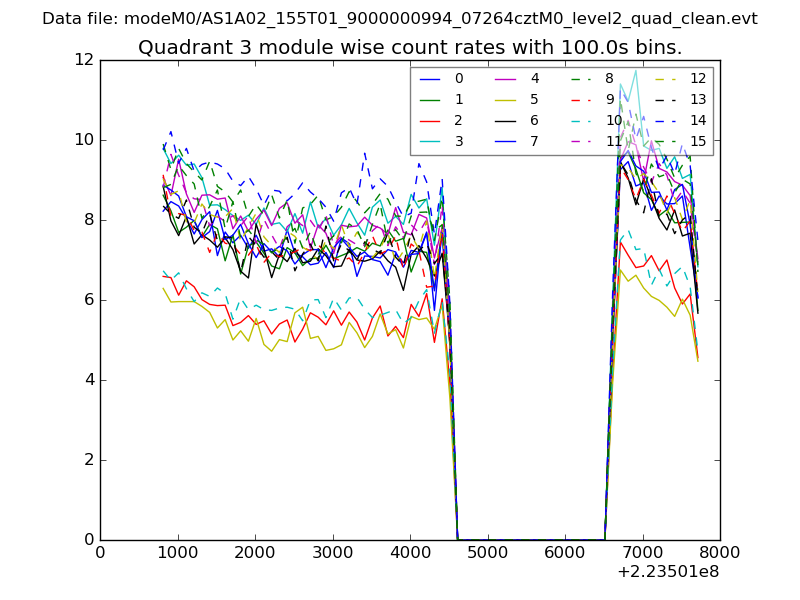
| Module-wise count rates for Quadrant C Data is divided into 100 sec bins |
 |
 |
| Module-wise count rates for Quadrant D Data is divided into 100 sec bins |
 |
 |
| Parameter | Plot |
|---|---|
| CZT HV Monitor | 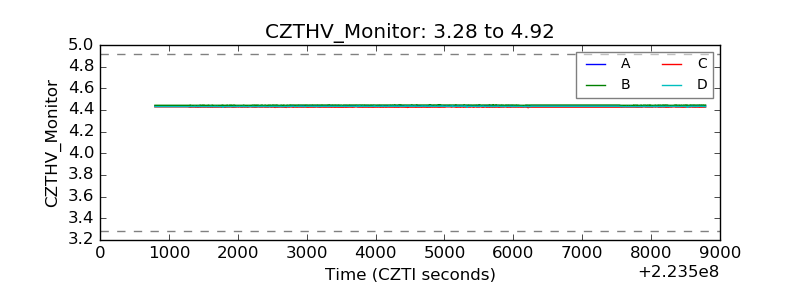 |
| D_VDD | 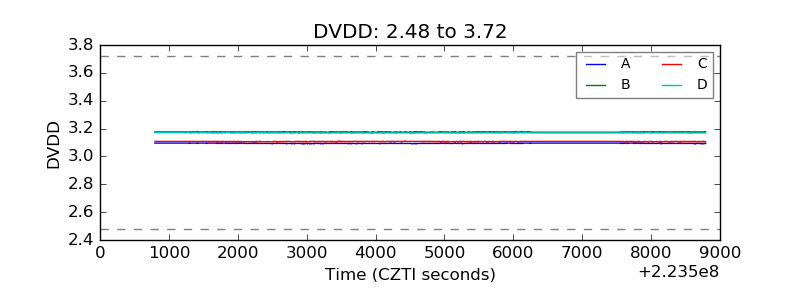 |
| Temperature 1 | 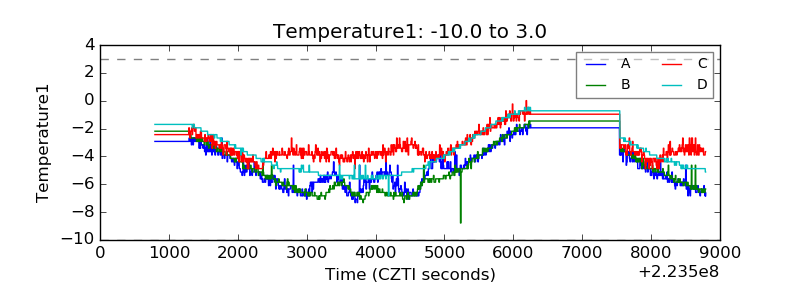 |
| Veto HV Monitor | 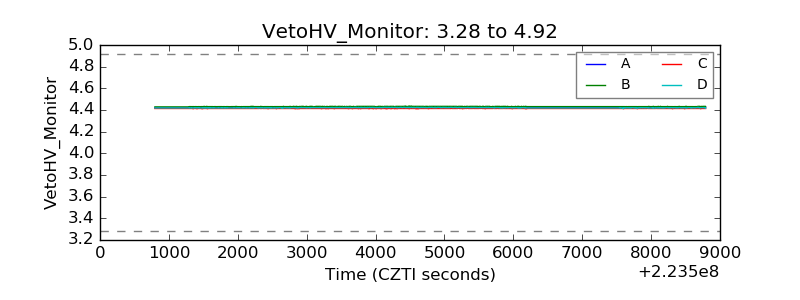 |
| Veto LLD | 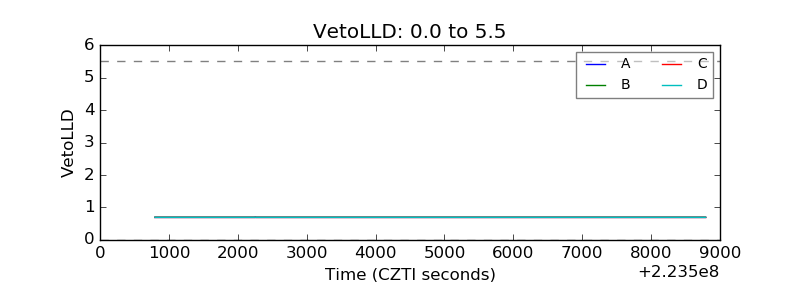 |
| Alpha Counter | 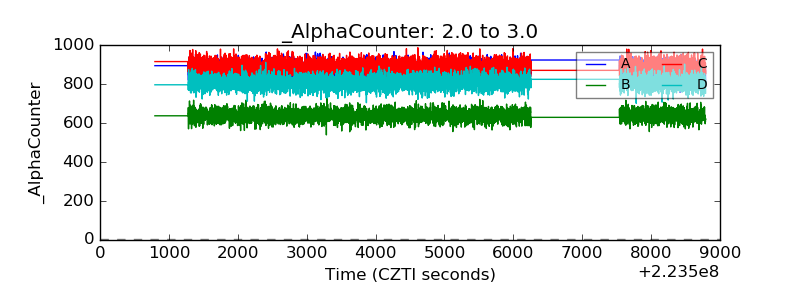 |
| _CPM_Rate | 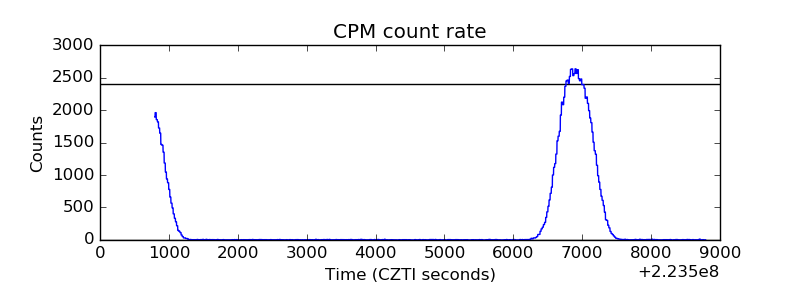 |
| CZT Counter | 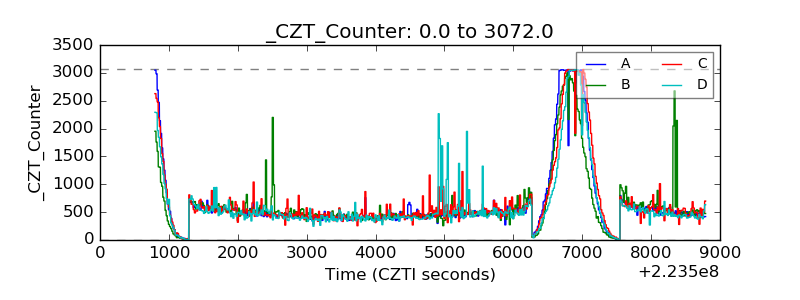 |
| +2.5 Volts monitor | 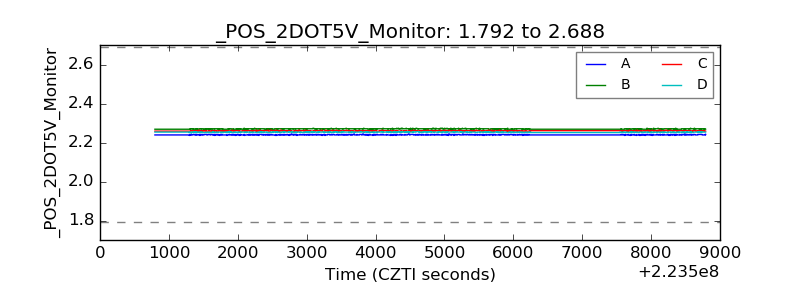 |
| +5 Volts monitor | 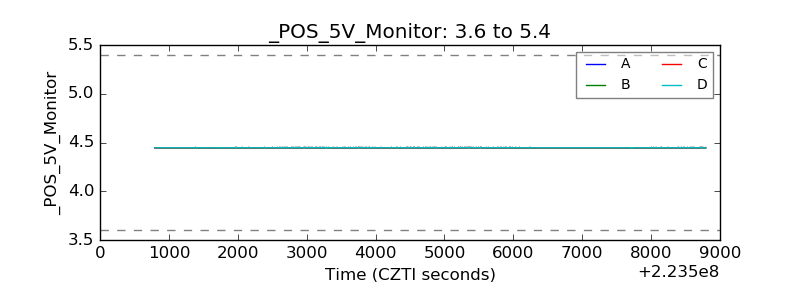 |
| _ROLL_ROT | 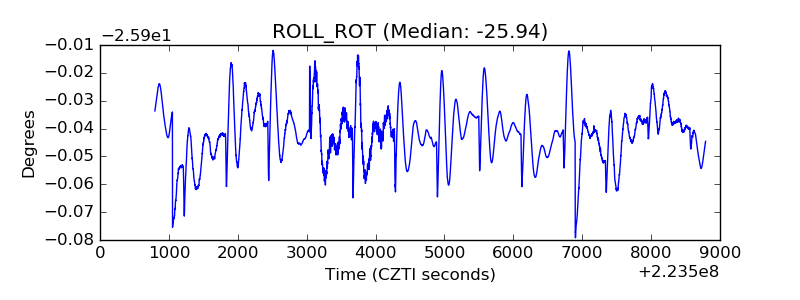 |
| _Roll_DEC | 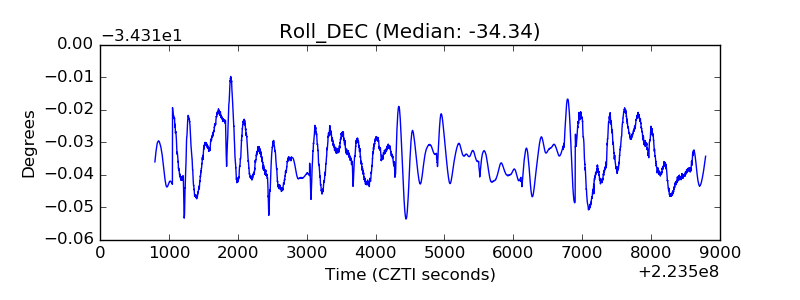 |
| _Roll_RA | 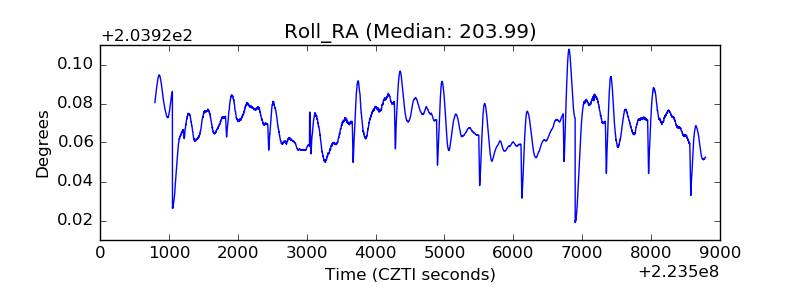 |
| Veto Counter | 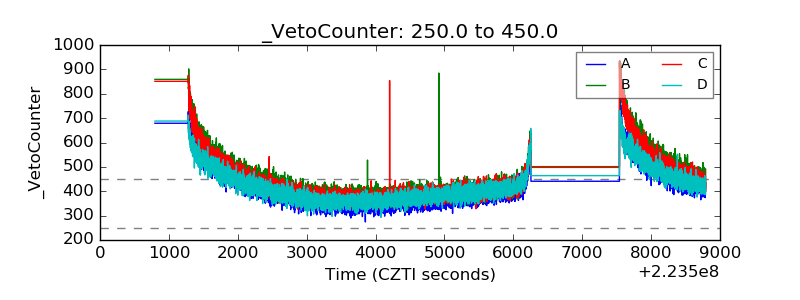 |