| Param | Original file | Final file |
|---|---|---|
| Filename | modeM0/AS1A02_155T01_9000000994_07265cztM0_level2.evt | modeM0/AS1A02_155T01_9000000994_07265cztM0_level2_quad_clean.evt |
| Size (bytes) | 442,056,960 | 105,747,840 |
| Size | 421.6 MB | 100.8 MB |
| Events in quadrant A | 3,064,656 | 693,035 |
| Events in quadrant B | 3,390,504 | 719,309 |
| Events in quadrant C | 3,400,410 | 696,408 |
| Events in quadrant D | 3,105,769 | 656,116 |
| Mode M9 | |||
|---|---|---|---|
| Quadrant | BADHDUFLAG | Total packets | Discarded packets |
| A | 0 | 15 | 0 |
| B | 0 | 15 | 0 |
| C | 0 | 15 | 0 |
| D | 0 | 16 | 0 |
| Mode M0 | |||
|---|---|---|---|
| Quadrant | BADHDUFLAG | Total packets | Discarded packets |
| A | 0 | 13185 | 3 |
| B | 0 | 14176 | 2 |
| C | 0 | 14187 | 2 |
| D | 0 | 13484 | 2 |
| Mode SS | |||
|---|---|---|---|
| Quadrant | BADHDUFLAG | Total packets | Discarded packets |
| A | 0 | 128 | 0 |
| B | 0 | 128 | 0 |
| C | 0 | 128 | 0 |
| D | 0 | 128 | 0 |
| Quadrant | Total seconds | Saturated seconds | Saturation percentage |
|---|---|---|---|
| A | 6271 | 51 | 0.813267% |
| B | 6271 | 128 | 2.041142% |
| C | 6271 | 38 | 0.605964% |
| D | 6271 | 39 | 0.621910% |
Noise dominated data is calculated using 1-second bins in cleaned event files. If a bin has >2000 counts, and if more than 50% of those come from <1% of pixels, then it is considered to be noise-dominated and hence unusable.
| Quadrant | # 1 sec bins | Bins with >0 counts | Bins with >2000 counts | High rate bins dominated by noise | Noise dominated (total time) | Noise dominated (detector-on time) | Marked lightcurve |
|---|---|---|---|---|---|---|---|
| A | 7591 | 6271 | 1 | 1 | 0.01% | 0.02% |  |
| B | 7591 | 6271 | 53 | 53 | 0.70% | 0.85% | 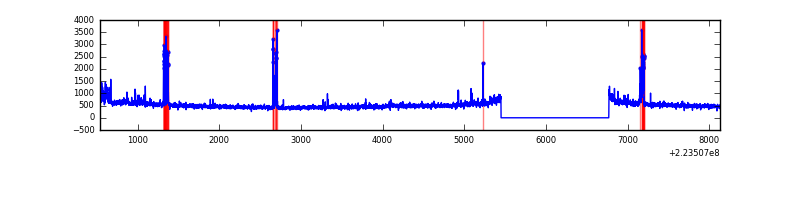 |
| C | 7591 | 6272 | 9 | 9 | 0.12% | 0.14% | 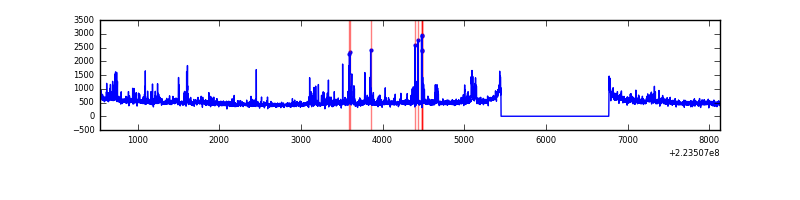 |
| D | 7591 | 6272 | 17 | 17 | 0.22% | 0.27% | 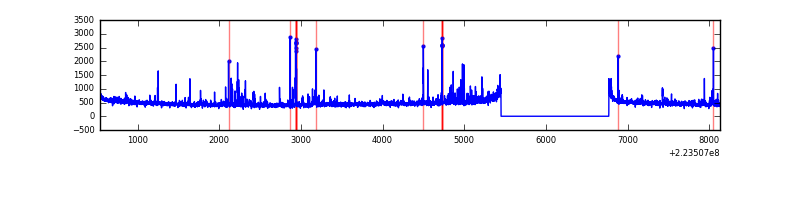 |
Top three noisy pixels from each quadrant. If the there are fewer than three noisy pixels in the level2.evt file, extra rows are filled as -1
| Pixel properties | Quadrant properties | ||||||
|---|---|---|---|---|---|---|---|
| Quadrant | DetID | PixID | Counts | Sigma | Mean | Median | Sigma |
| A | 8 | 15 | 53336 | 335.43 | 774 | 759 | 156.7 |
| A | 15 | 174 | 19920 | 122.24 | 774 | 759 | 156.7 |
| A | 0 | 226 | 7479 | 42.87 | 774 | 759 | 156.7 |
| B | 4 | 239 | 141426 | 950.56 | 790 | 773 | 148.0 |
| B | 4 | 81 | 82483 | 552.21 | 790 | 773 | 148.0 |
| B | 0 | 214 | 46662 | 310.13 | 790 | 773 | 148.0 |
| C | 7 | 247 | 391647 | 2214.11 | 763 | 768 | 176.5 |
| C | 9 | 68 | 28680 | 158.11 | 763 | 768 | 176.5 |
| C | 13 | 61 | 6083 | 30.11 | 763 | 768 | 176.5 |
| D | 2 | 216 | 113757 | 614.79 | 748 | 725 | 183.9 |
| D | 2 | 14 | 82161 | 442.94 | 748 | 725 | 183.9 |
| D | 12 | 233 | 26956 | 142.67 | 748 | 725 | 183.9 |
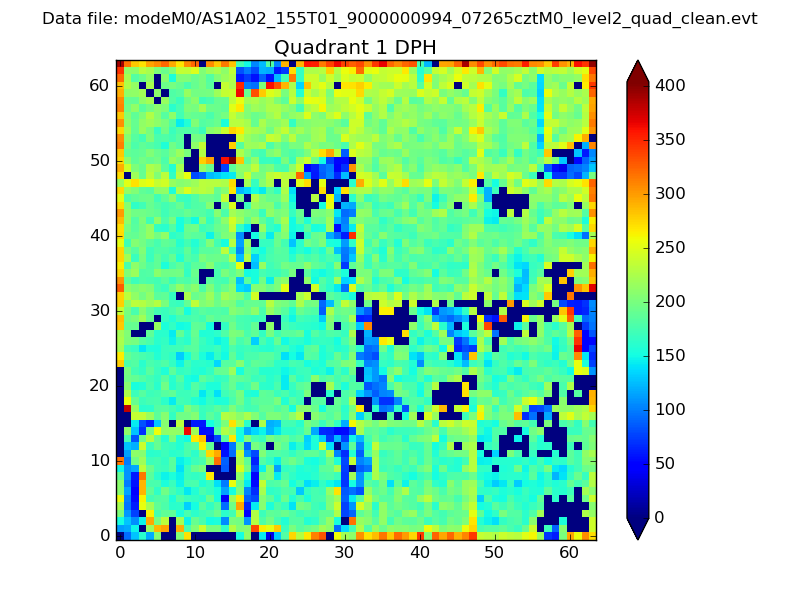
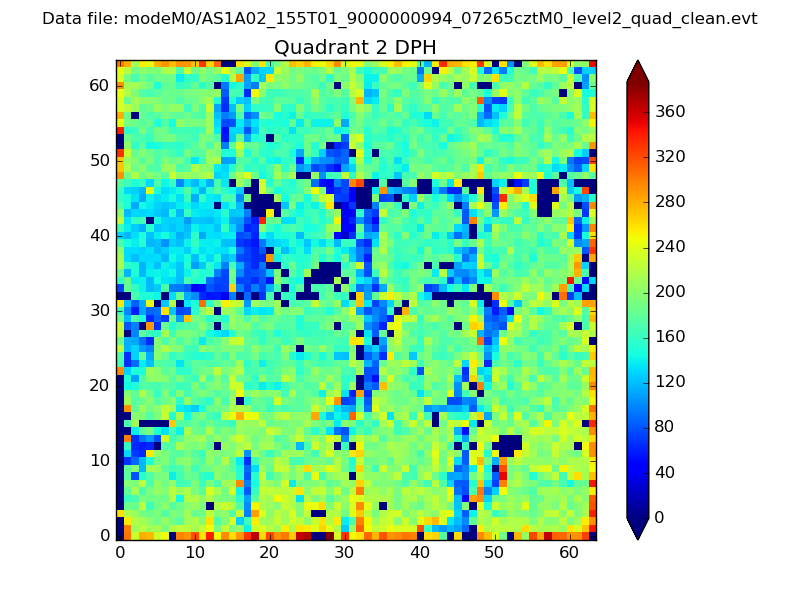
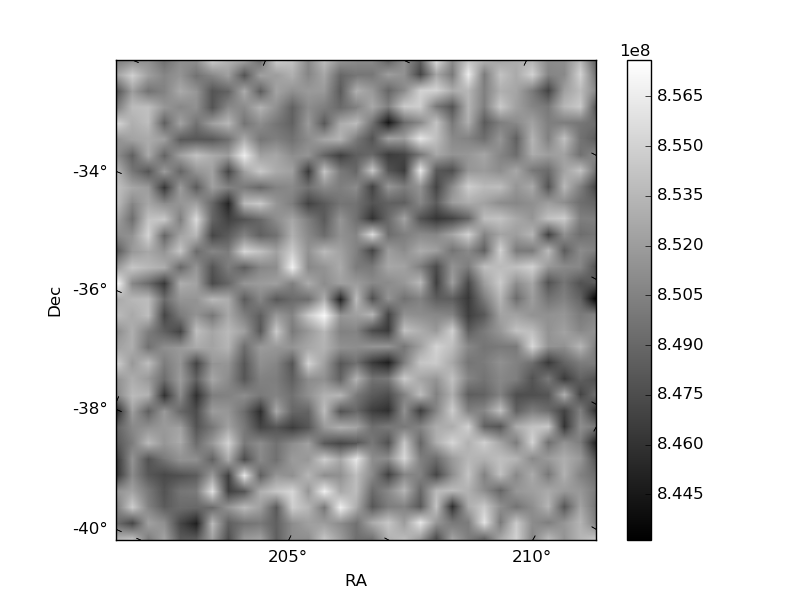
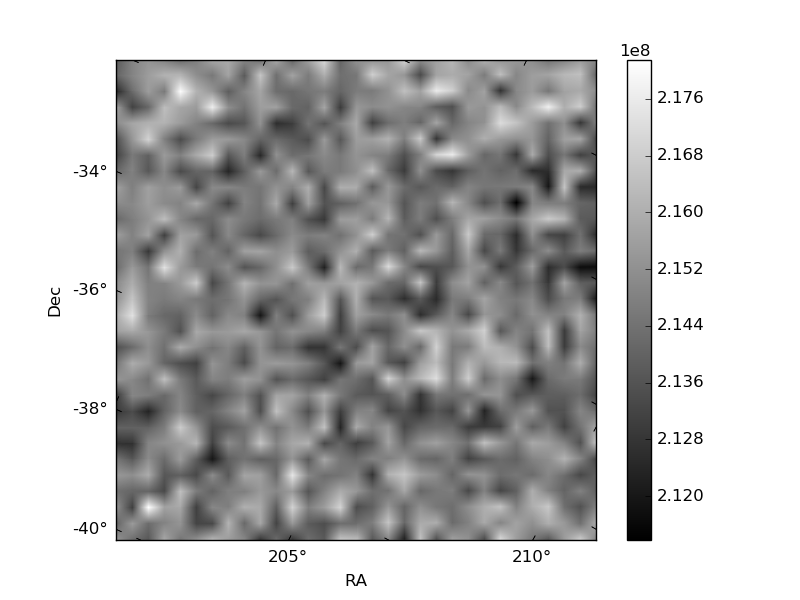
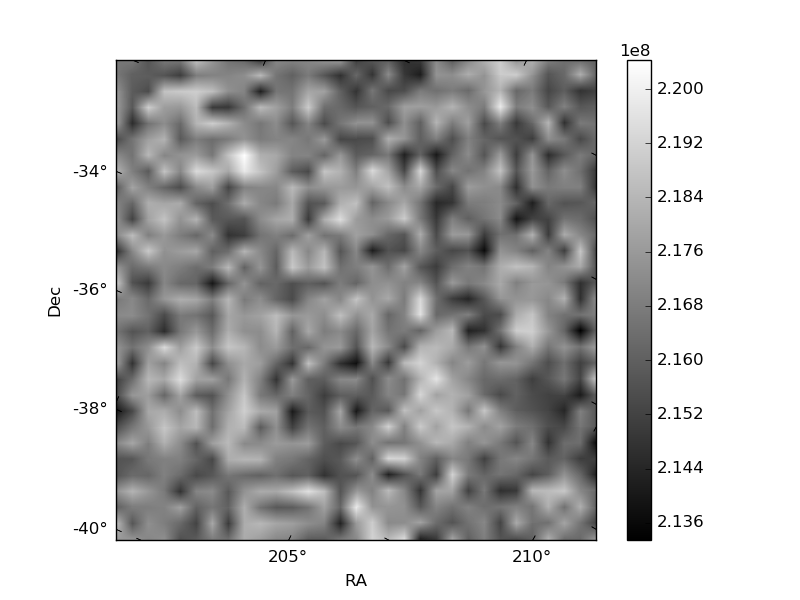
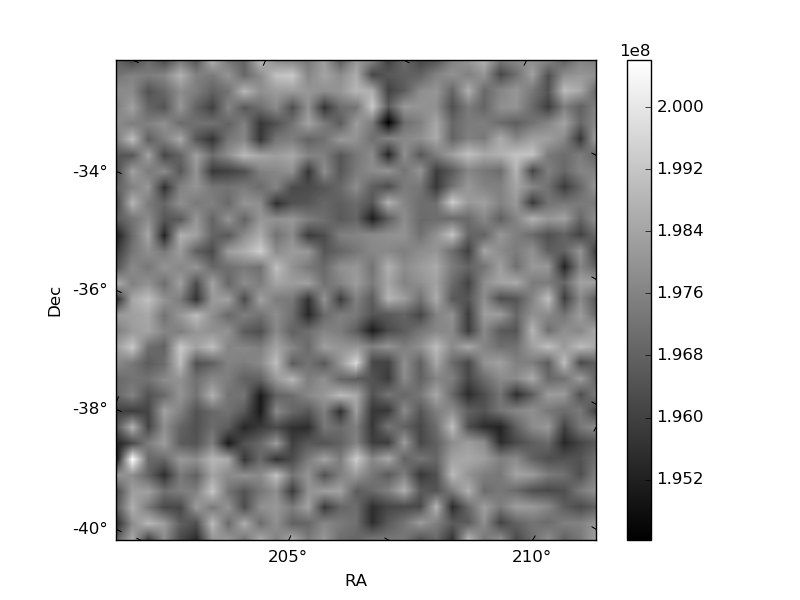
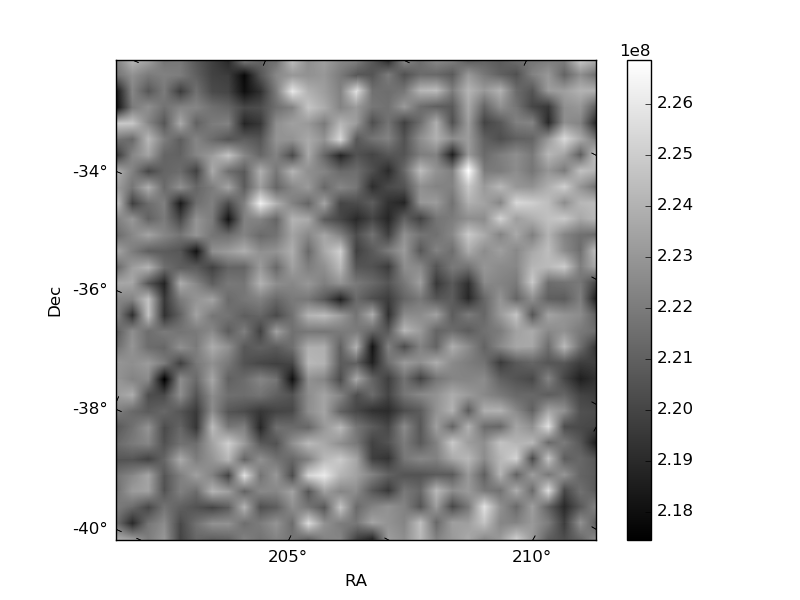
Histogram calculated using DETX and DETY for each event in the final _common_clean file
| Quadrant A | 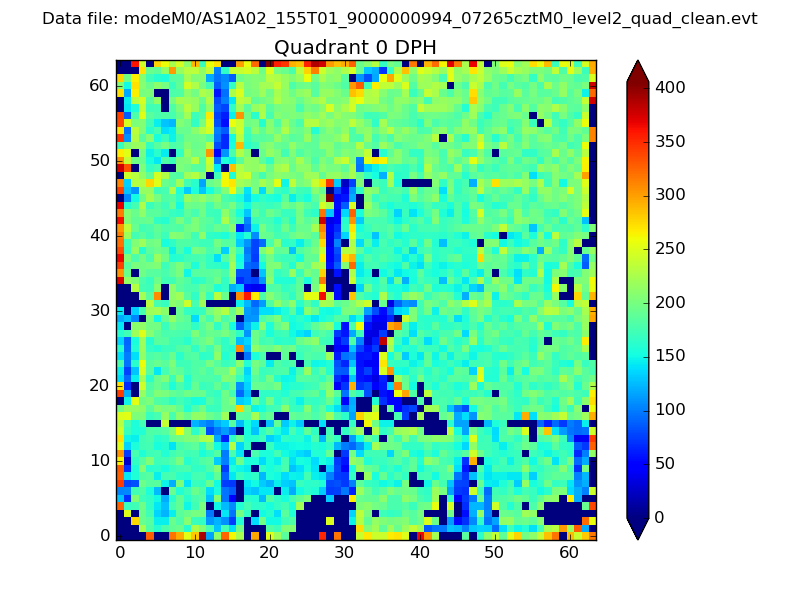 |
 |
Quadrant B |
|---|---|---|---|
| Quadrant D | 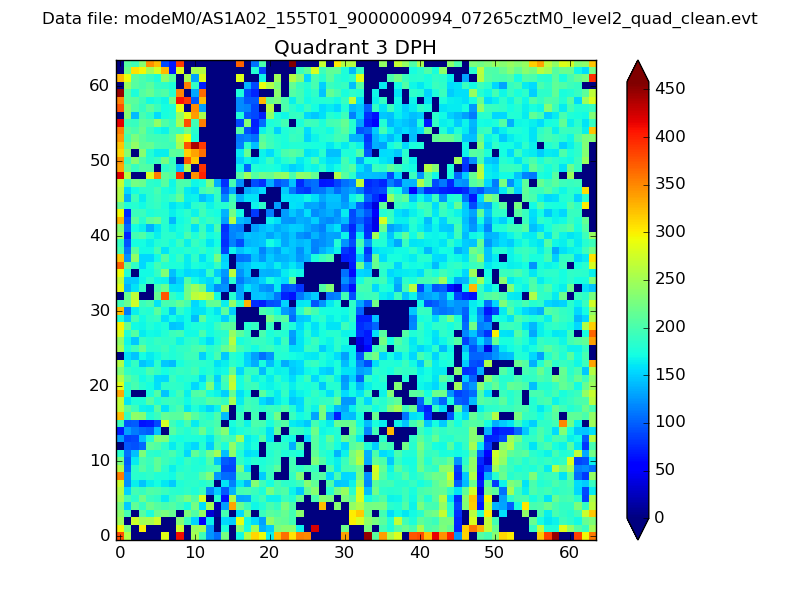 |
 |
Quadrant C |
| Plot type | Count rate plots | Images |
|---|---|---|
| Comparison with Poisson distribution Blue bars denote a histogram of data divided into 1 sec bins. Red curve is a Poisson curve with rate = median count rate of data. |
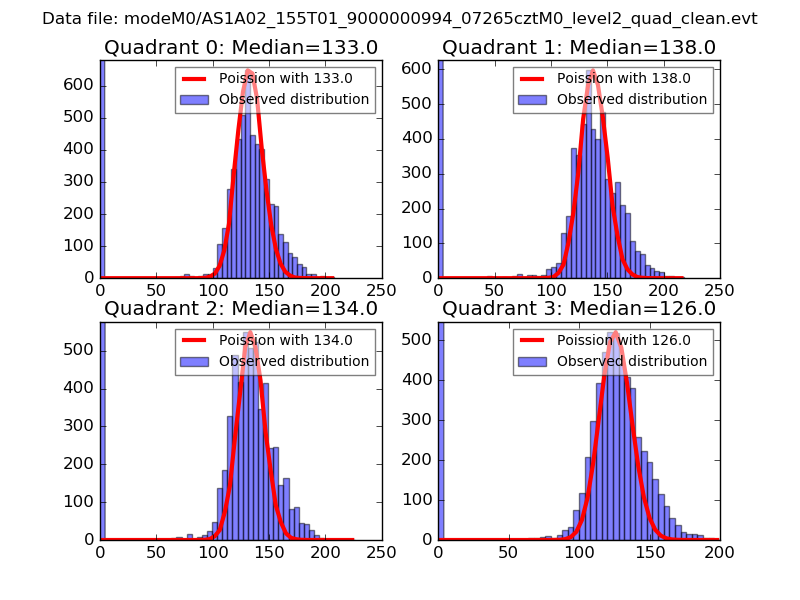 |
 |
| Quadrant-wise count rates Data is divided into 100 sec bins |
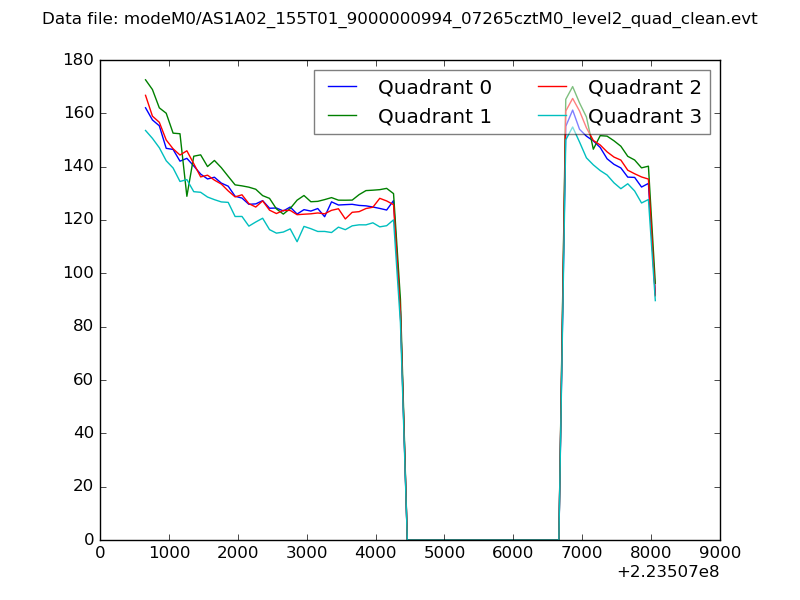 |
|
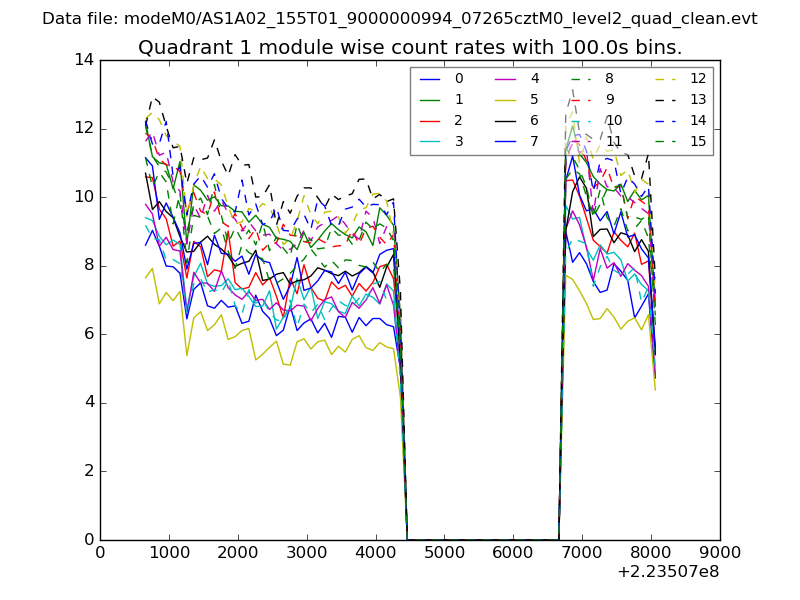
| Module-wise count rates for Quadrant A Data is divided into 100 sec bins |
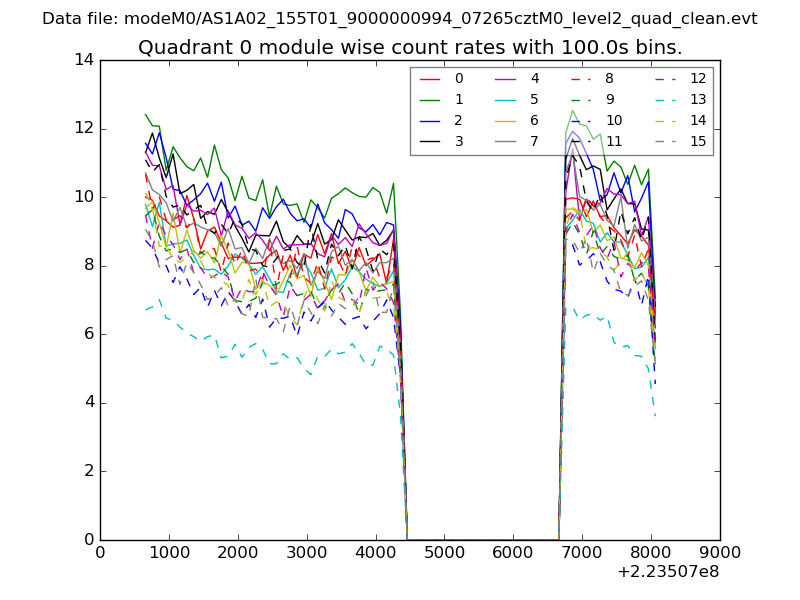 |
 |
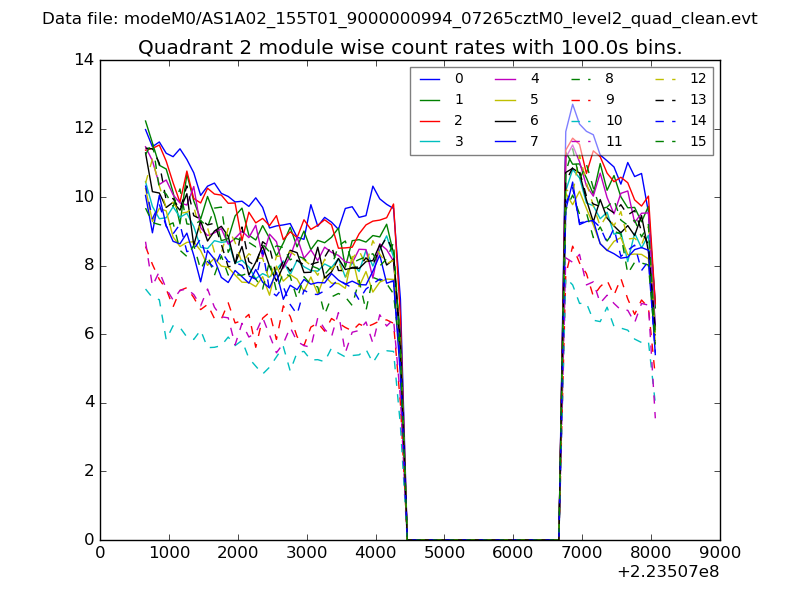
| Module-wise count rates for Quadrant B Data is divided into 100 sec bins |
 |
 |
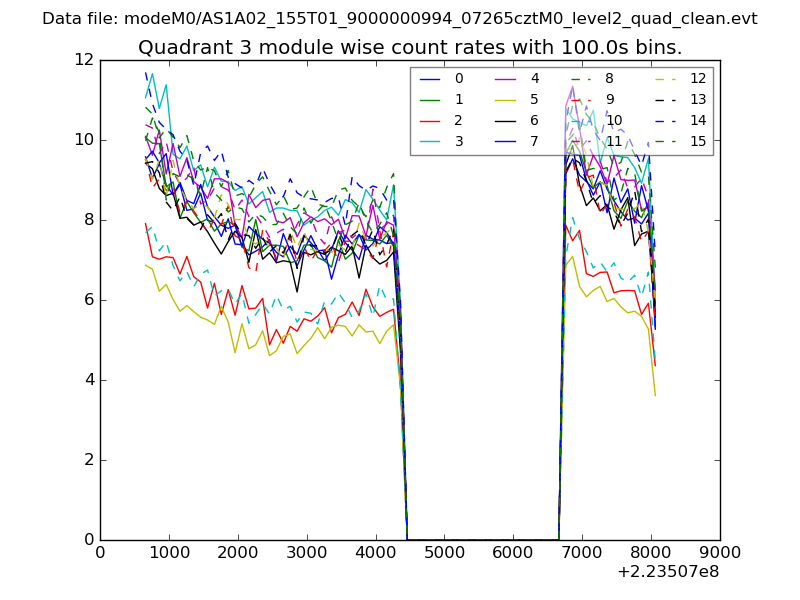
| Module-wise count rates for Quadrant C Data is divided into 100 sec bins |
 |
 |
| Module-wise count rates for Quadrant D Data is divided into 100 sec bins |
 |
 |
| Parameter | Plot |
|---|---|
| CZT HV Monitor | 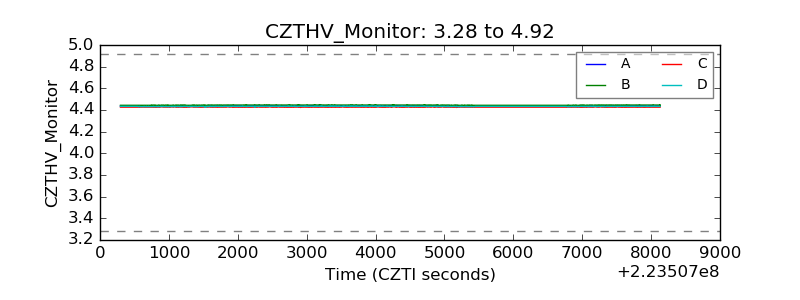 |
| D_VDD |  |
| Temperature 1 | 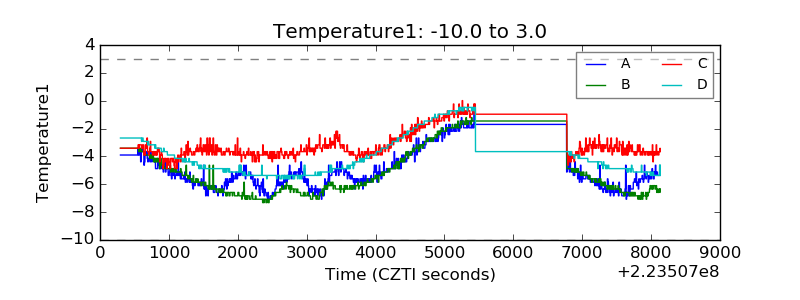 |
| Veto HV Monitor | 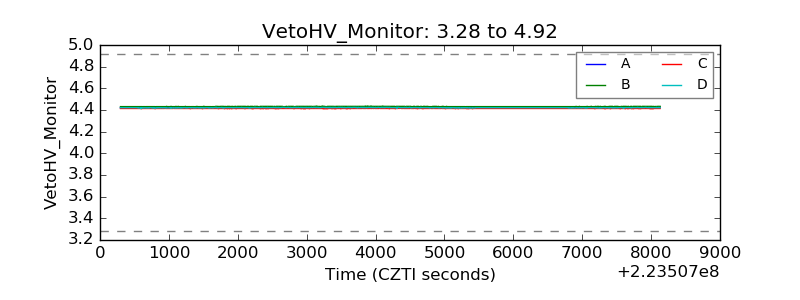 |
| Veto LLD | 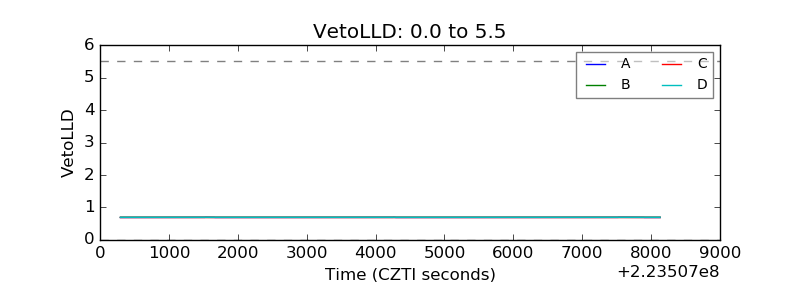 |
| Alpha Counter | 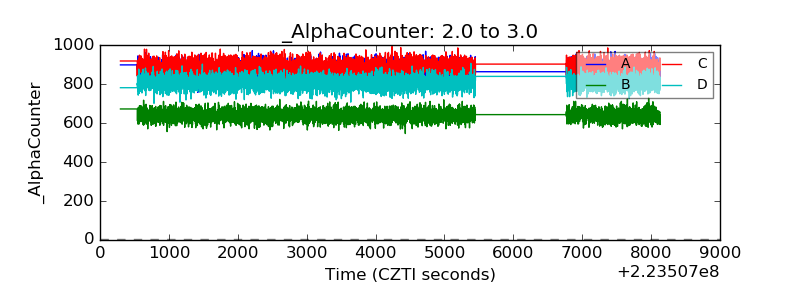 |
| _CPM_Rate | 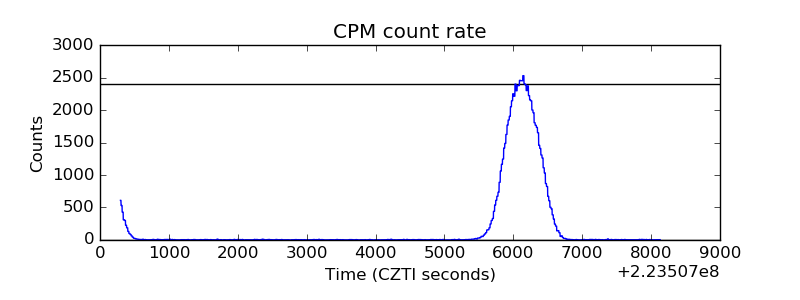 |
| CZT Counter | 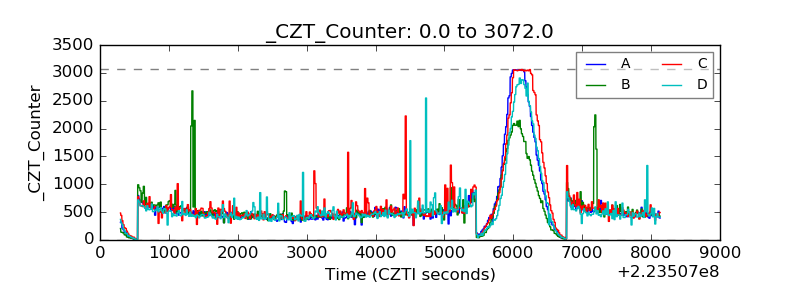 |
| +2.5 Volts monitor |  |
| +5 Volts monitor | 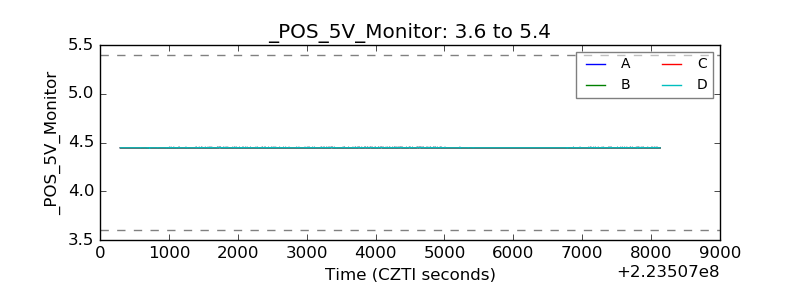 |
| _ROLL_ROT | 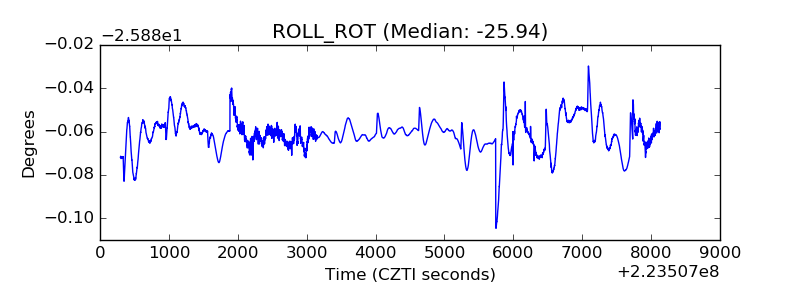 |
| _Roll_DEC | 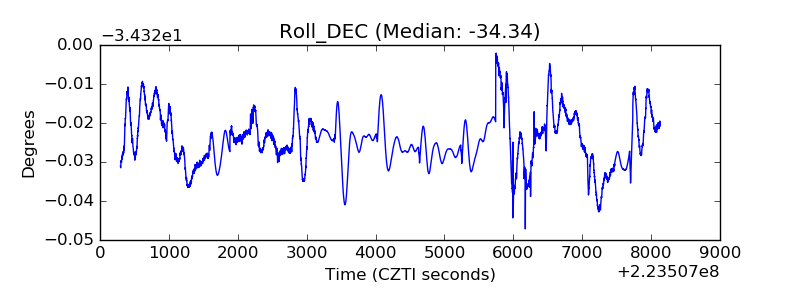 |
| _Roll_RA | 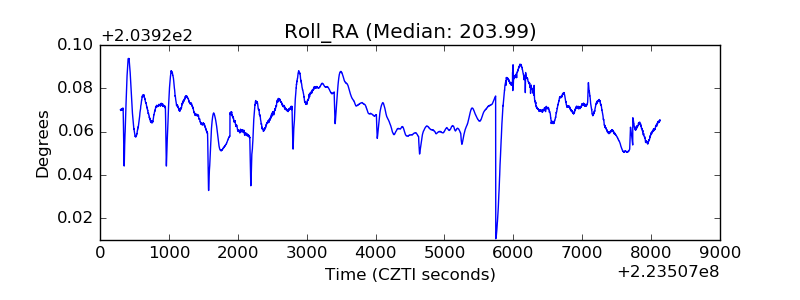 |
| Veto Counter | 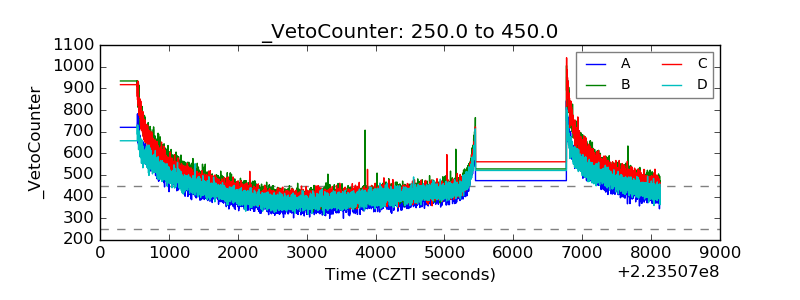 |