| Param | Original file | Final file |
|---|---|---|
| Filename | modeM0/AS1A02_155T01_9000000994_07266cztM0_level2.evt | modeM0/AS1A02_155T01_9000000994_07266cztM0_level2_quad_clean.evt |
| Size (bytes) | 474,413,760 | 106,611,840 |
| Size | 452.4 MB | 101.7 MB |
| Events in quadrant A | 3,139,365 | 693,690 |
| Events in quadrant B | 3,310,577 | 722,897 |
| Events in quadrant C | 3,888,656 | 693,844 |
| Events in quadrant D | 3,582,250 | 659,663 |
| Mode M9 | |||
|---|---|---|---|
| Quadrant | BADHDUFLAG | Total packets | Discarded packets |
| A | 0 | 17 | 0 |
| B | 0 | 17 | 0 |
| C | 0 | 17 | 0 |
| D | 0 | 18 | 0 |
| Mode M0 | |||
|---|---|---|---|
| Quadrant | BADHDUFLAG | Total packets | Discarded packets |
| A | 0 | 13715 | 3 |
| B | 0 | 14185 | 2 |
| C | 0 | 15848 | 2 |
| D | 0 | 15346 | 2 |
| Mode SS | |||
|---|---|---|---|
| Quadrant | BADHDUFLAG | Total packets | Discarded packets |
| A | 0 | 134 | 0 |
| B | 0 | 134 | 0 |
| C | 0 | 134 | 0 |
| D | 0 | 134 | 0 |
| Quadrant | Total seconds | Saturated seconds | Saturation percentage |
|---|---|---|---|
| A | 6577 | 38 | 0.577771% |
| B | 6577 | 66 | 1.003497% |
| C | 6577 | 133 | 2.022199% |
| D | 6577 | 96 | 1.459632% |
Noise dominated data is calculated using 1-second bins in cleaned event files. If a bin has >2000 counts, and if more than 50% of those come from <1% of pixels, then it is considered to be noise-dominated and hence unusable.
| Quadrant | # 1 sec bins | Bins with >0 counts | Bins with >2000 counts | High rate bins dominated by noise | Noise dominated (total time) | Noise dominated (detector-on time) | Marked lightcurve |
|---|---|---|---|---|---|---|---|
| A | 7952 | 6579 | 1 | 1 | 0.01% | 0.02% | 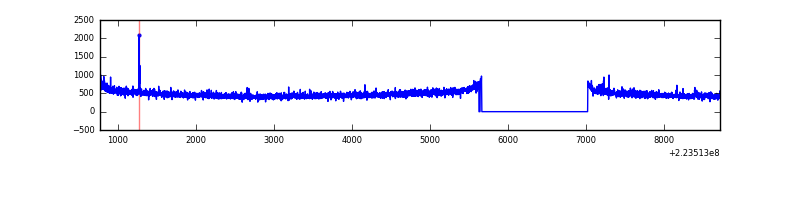 |
| B | 7952 | 6579 | 16 | 16 | 0.20% | 0.24% |  |
| C | 7952 | 6579 | 114 | 114 | 1.43% | 1.73% |  |
| D | 7952 | 6579 | 45 | 45 | 0.57% | 0.68% |  |
Top three noisy pixels from each quadrant. If the there are fewer than three noisy pixels in the level2.evt file, extra rows are filled as -1
| Pixel properties | Quadrant properties | ||||||
|---|---|---|---|---|---|---|---|
| Quadrant | DetID | PixID | Counts | Sigma | Mean | Median | Sigma |
| A | 8 | 15 | 70176 | 429.56 | 795 | 779 | 161.6 |
| A | 0 | 226 | 7478 | 41.47 | 795 | 779 | 161.6 |
| A | 12 | 194 | 7110 | 39.19 | 795 | 779 | 161.6 |
| B | 4 | 239 | 59973 | 386.51 | 815 | 795 | 153.1 |
| B | 4 | 81 | 38211 | 244.38 | 815 | 795 | 153.1 |
| B | 0 | 214 | 37954 | 242.7 | 815 | 795 | 153.1 |
| C | 7 | 247 | 791462 | 4365.54 | 785 | 790 | 181.1 |
| C | 9 | 68 | 24592 | 131.42 | 785 | 790 | 181.1 |
| C | 13 | 61 | 6193 | 29.83 | 785 | 790 | 181.1 |
| D | 2 | 216 | 475470 | 2535.74 | 767 | 744 | 187.2 |
| D | 14 | 34 | 131633 | 699.14 | 767 | 744 | 187.2 |
| D | 2 | 14 | 77472 | 409.84 | 767 | 744 | 187.2 |
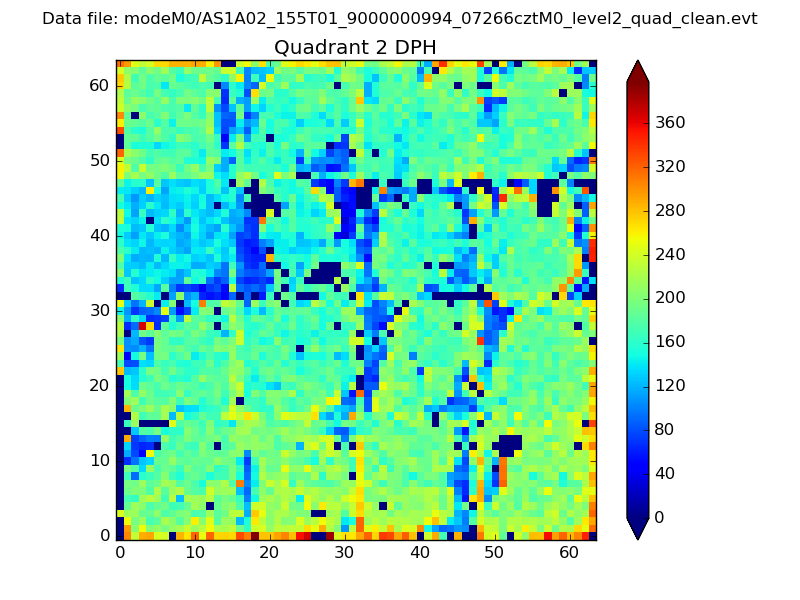
Histogram calculated using DETX and DETY for each event in the final _common_clean file
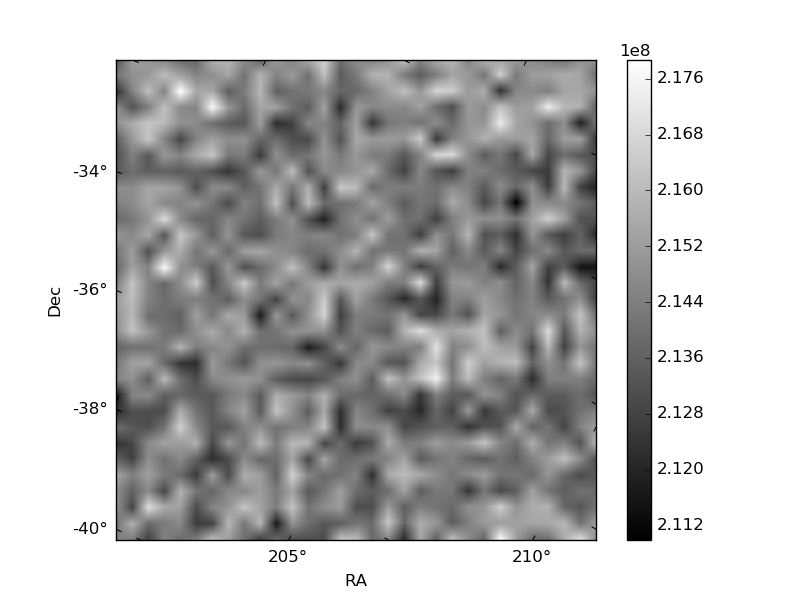
| Quadrant A | 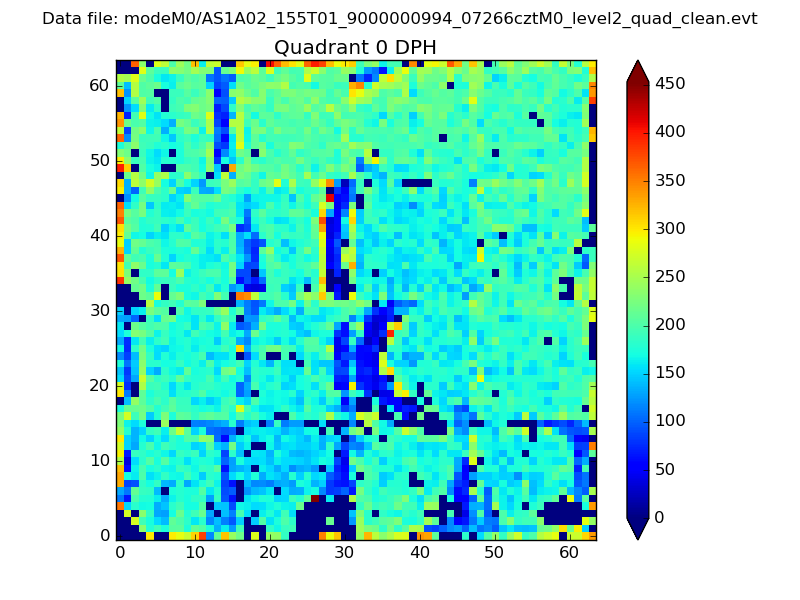 |
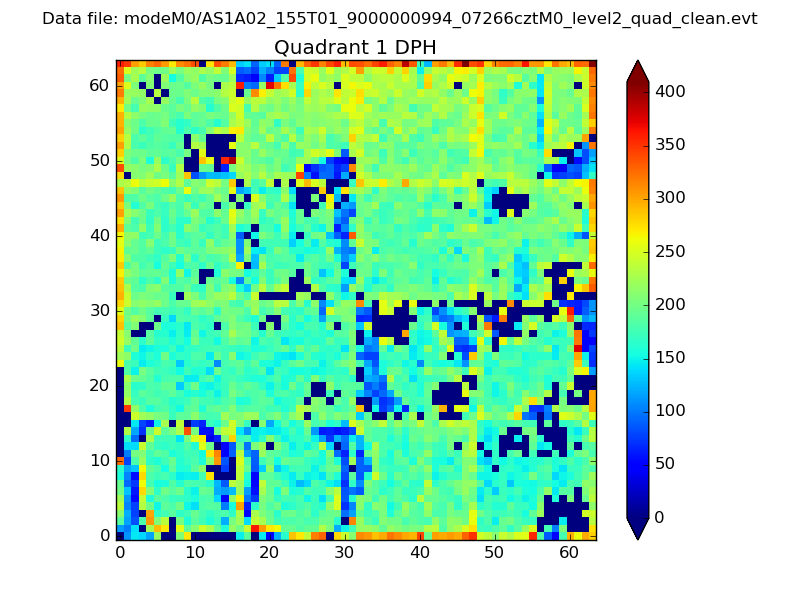 |
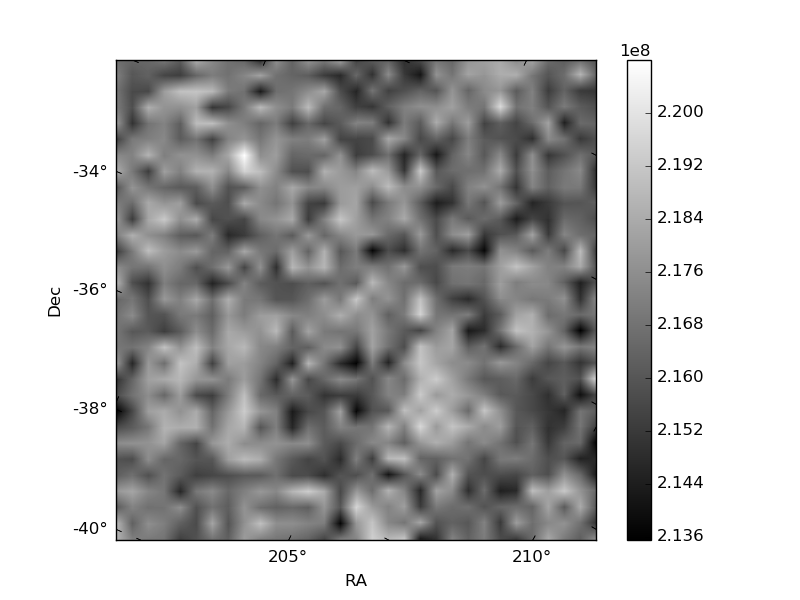
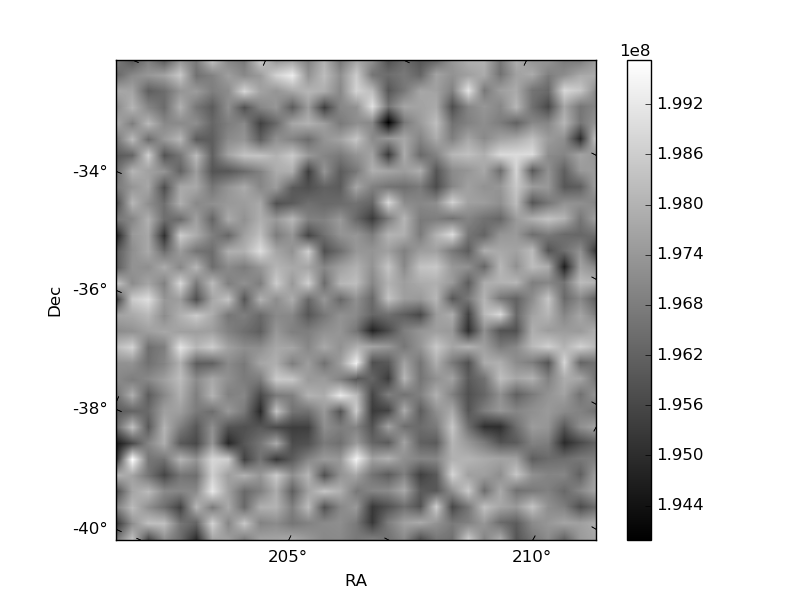
Quadrant B |
|---|---|---|---|
| Quadrant D | 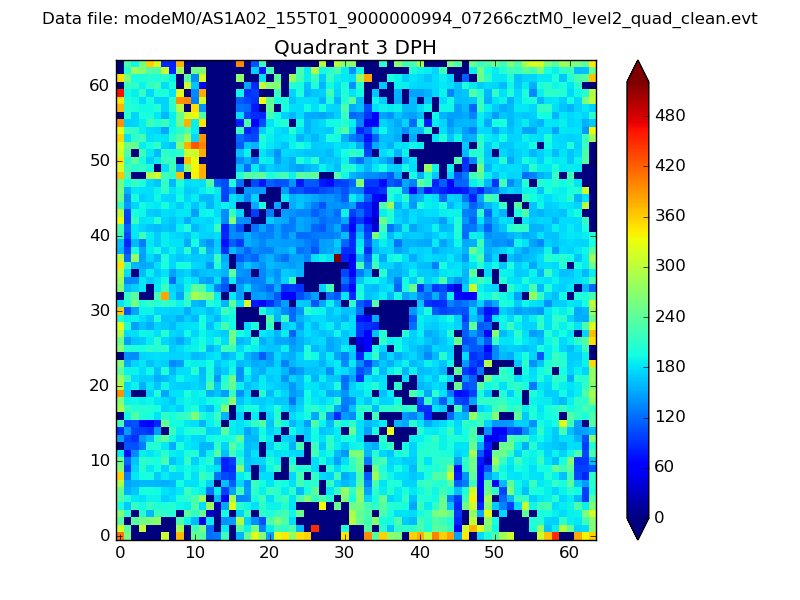 |
 |
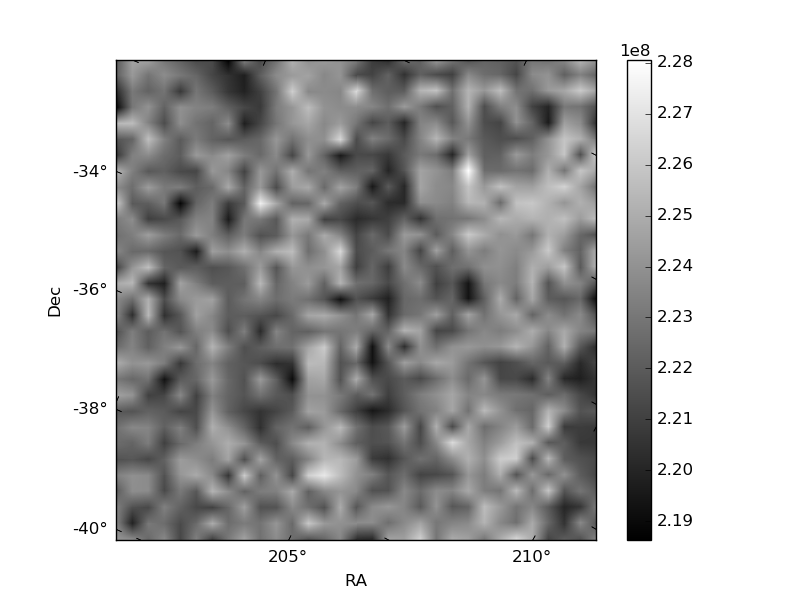
Quadrant C |
| Plot type | Count rate plots | Images |
|---|---|---|
| Comparison with Poisson distribution Blue bars denote a histogram of data divided into 1 sec bins. Red curve is a Poisson curve with rate = median count rate of data. |
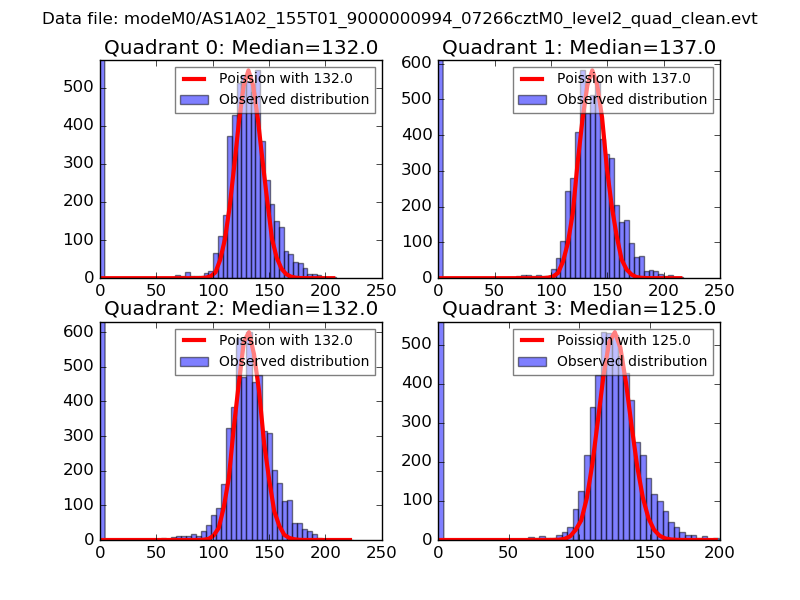 |
 |
| Quadrant-wise count rates Data is divided into 100 sec bins |
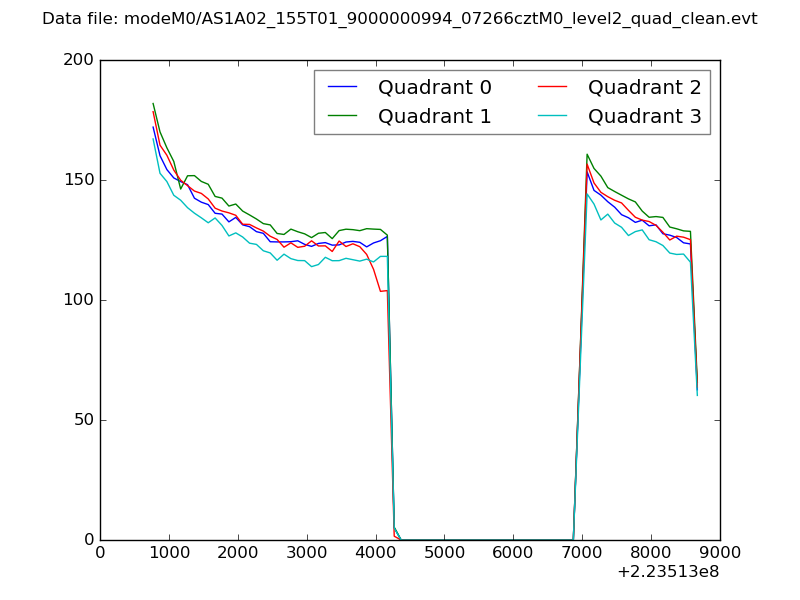 |
|
| Module-wise count rates for Quadrant A Data is divided into 100 sec bins |
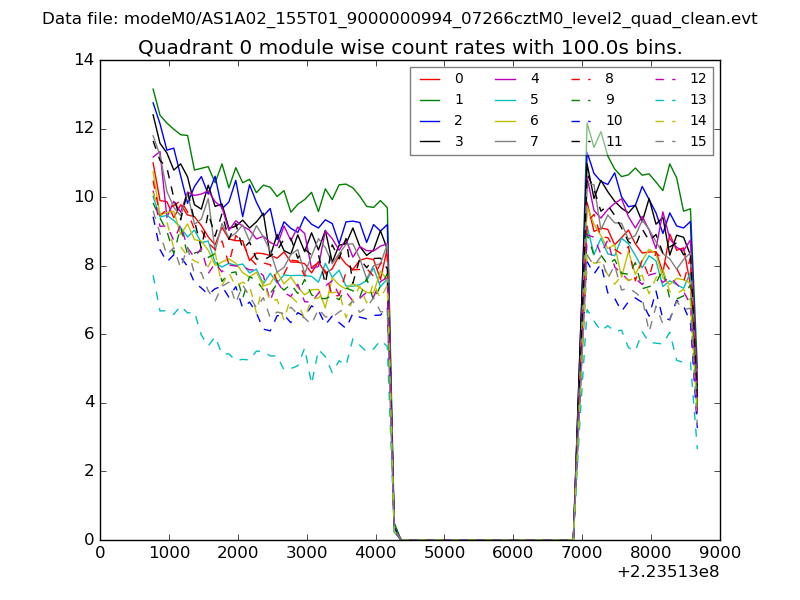 |
 |
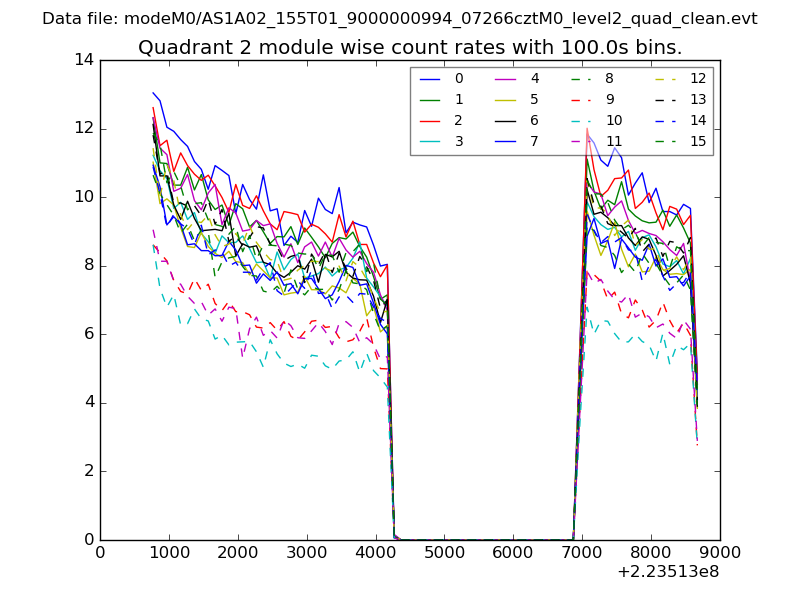
| Module-wise count rates for Quadrant B Data is divided into 100 sec bins |
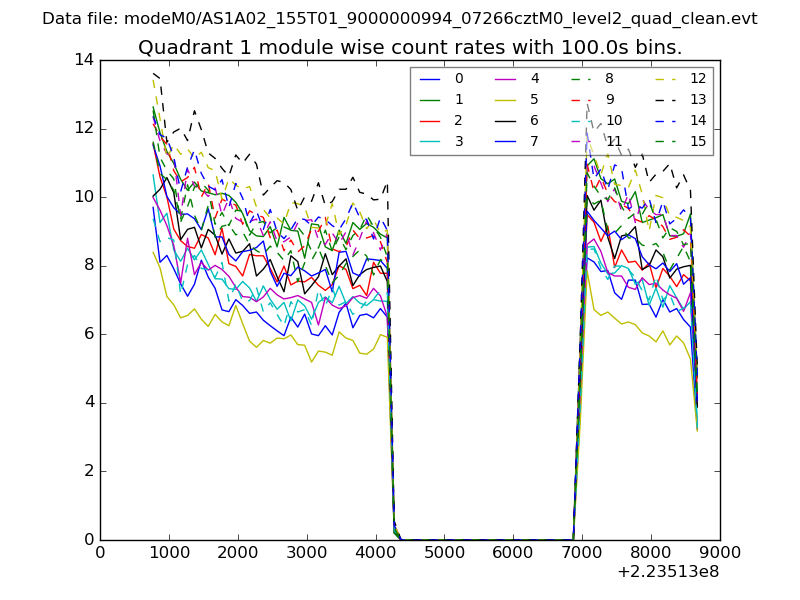 |
 |
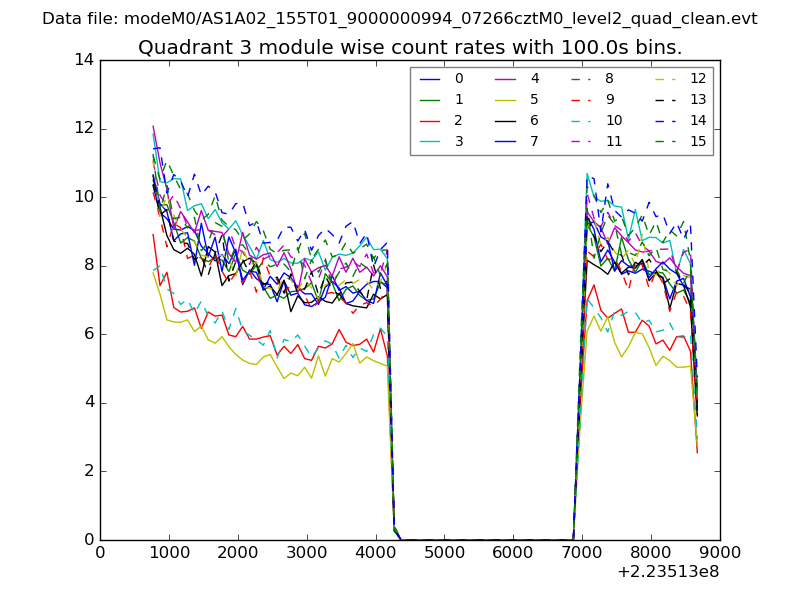
| Module-wise count rates for Quadrant C Data is divided into 100 sec bins |
 |
 |
| Module-wise count rates for Quadrant D Data is divided into 100 sec bins |
 |
 |
| Parameter | Plot |
|---|---|
| CZT HV Monitor | 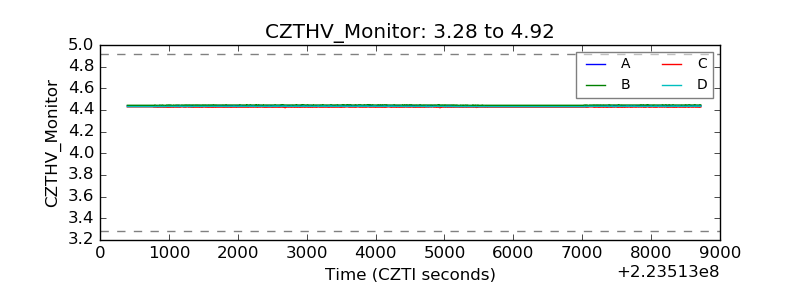 |
| D_VDD | 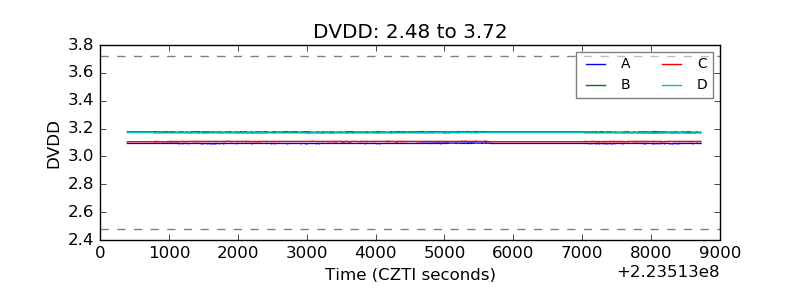 |
| Temperature 1 | 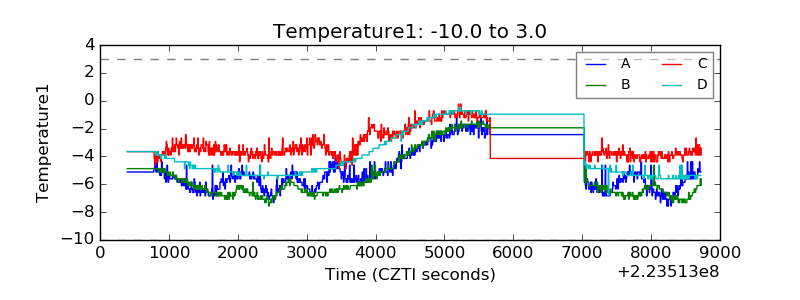 |
| Veto HV Monitor | 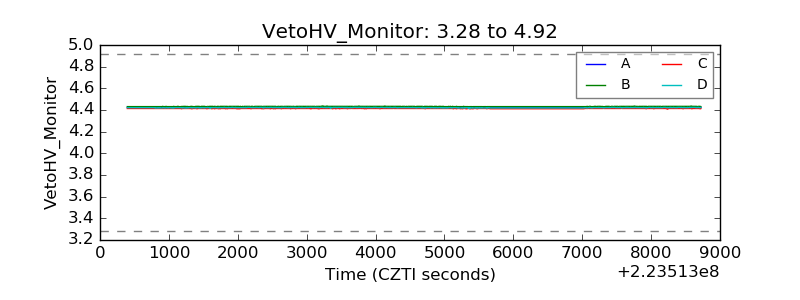 |
| Veto LLD | 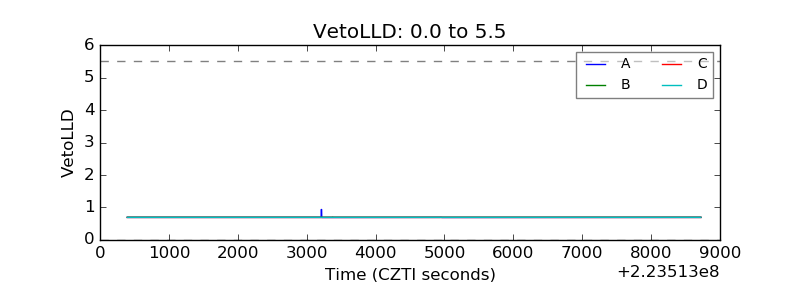 |
| Alpha Counter | 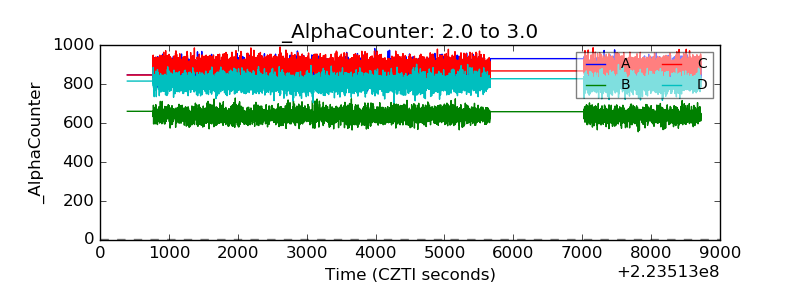 |
| _CPM_Rate | 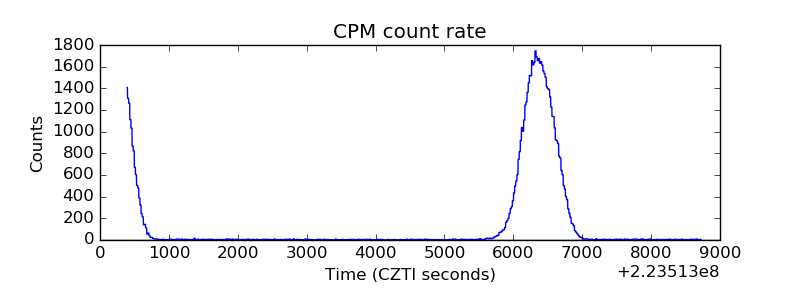 |
| CZT Counter | 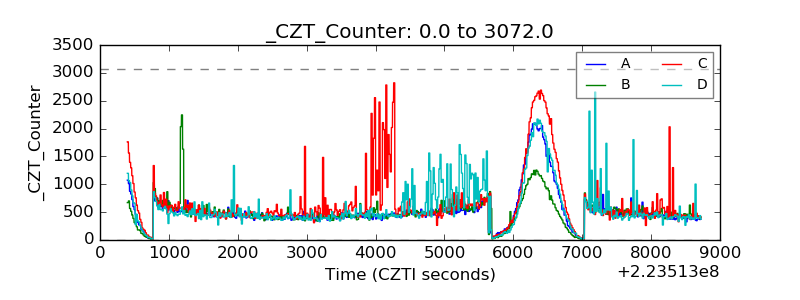 |
| +2.5 Volts monitor |  |
| +5 Volts monitor |  |
| _ROLL_ROT | 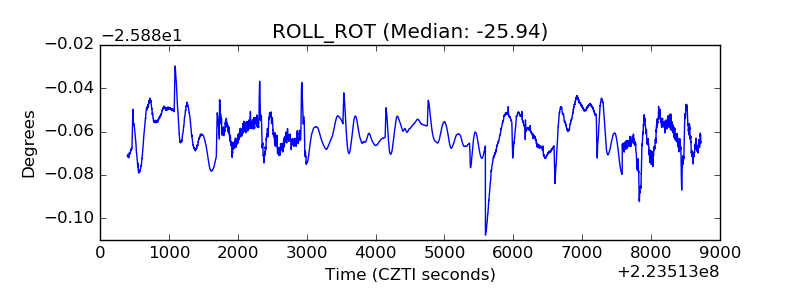 |
| _Roll_DEC | 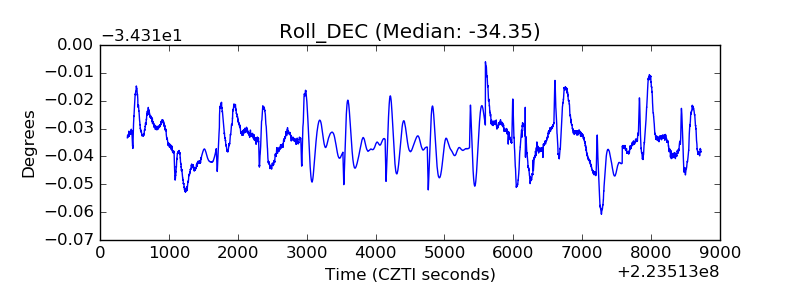 |
| _Roll_RA | 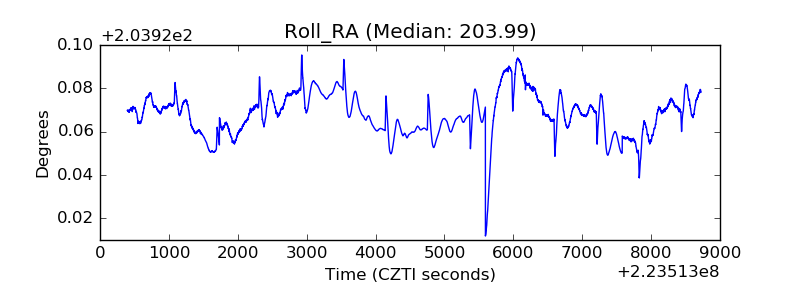 |
| Veto Counter | 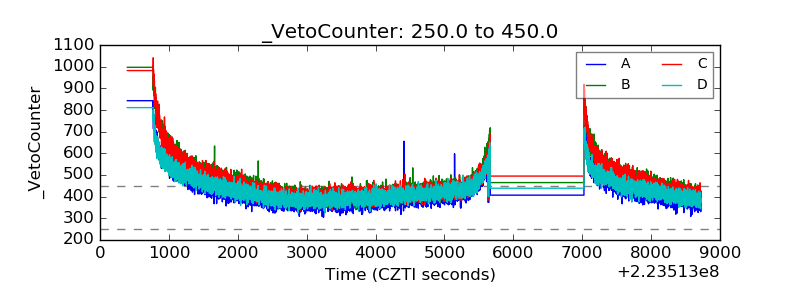 |