| Param | Original file | Final file |
|---|---|---|
| Filename | modeM0/AS1A02_155T01_9000000994_07267cztM0_level2.evt | modeM0/AS1A02_155T01_9000000994_07267cztM0_level2_quad_clean.evt |
| Size (bytes) | 445,440,960 | 96,209,280 |
| Size | 424.8 MB | 91.8 MB |
| Events in quadrant A | 3,145,675 | 610,862 |
| Events in quadrant B | 3,265,317 | 635,258 |
| Events in quadrant C | 3,464,538 | 618,427 |
| Events in quadrant D | 3,160,866 | 583,807 |
| Mode M9 | |||
|---|---|---|---|
| Quadrant | BADHDUFLAG | Total packets | Discarded packets |
| A | 0 | 17 | 0 |
| B | 0 | 17 | 0 |
| C | 0 | 17 | 0 |
| D | 0 | 18 | 0 |
| Mode M0 | |||
|---|---|---|---|
| Quadrant | BADHDUFLAG | Total packets | Discarded packets |
| A | 0 | 13907 | 3 |
| B | 0 | 14209 | 2 |
| C | 0 | 14639 | 2 |
| D | 0 | 14261 | 2 |
| Mode SS | |||
|---|---|---|---|
| Quadrant | BADHDUFLAG | Total packets | Discarded packets |
| A | 0 | 136 | 0 |
| B | 0 | 136 | 0 |
| C | 0 | 136 | 0 |
| D | 0 | 136 | 0 |
| Quadrant | Total seconds | Saturated seconds | Saturation percentage |
|---|---|---|---|
| A | 6672 | 39 | 0.584532% |
| B | 6672 | 55 | 0.824341% |
| C | 6672 | 24 | 0.359712% |
| D | 6672 | 42 | 0.629496% |
Noise dominated data is calculated using 1-second bins in cleaned event files. If a bin has >2000 counts, and if more than 50% of those come from <1% of pixels, then it is considered to be noise-dominated and hence unusable.
| Quadrant | # 1 sec bins | Bins with >0 counts | Bins with >2000 counts | High rate bins dominated by noise | Noise dominated (total time) | Noise dominated (detector-on time) | Marked lightcurve |
|---|---|---|---|---|---|---|---|
| A | 7892 | 6673 | 0 | 0 | 0.00% | 0.00% | 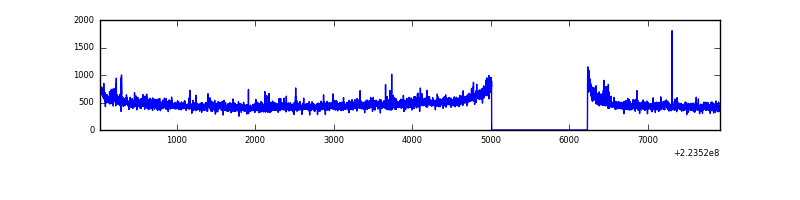 |
| B | 7892 | 6673 | 7 | 7 | 0.09% | 0.10% | 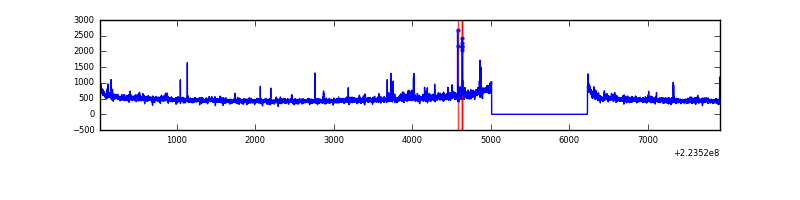 |
| C | 7892 | 6673 | 10 | 10 | 0.13% | 0.15% | 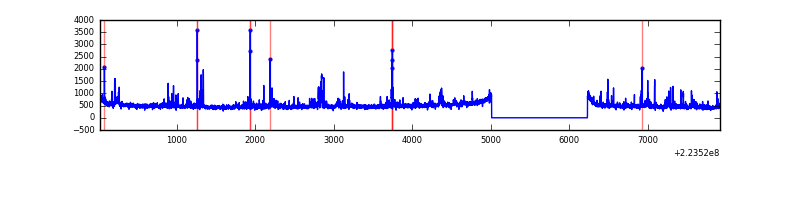 |
| D | 7892 | 6673 | 27 | 27 | 0.34% | 0.40% | 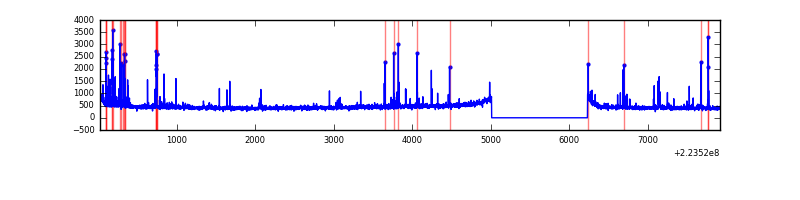 |
Top three noisy pixels from each quadrant. If the there are fewer than three noisy pixels in the level2.evt file, extra rows are filled as -1
| Pixel properties | Quadrant properties | ||||||
|---|---|---|---|---|---|---|---|
| Quadrant | DetID | PixID | Counts | Sigma | Mean | Median | Sigma |
| A | 8 | 15 | 79822 | 493.18 | 793 | 776 | 160.3 |
| A | 14 | 111 | 10539 | 60.91 | 793 | 776 | 160.3 |
| A | 0 | 226 | 7456 | 41.68 | 793 | 776 | 160.3 |
| B | 4 | 81 | 47880 | 308.41 | 810 | 791 | 152.7 |
| B | 0 | 214 | 32651 | 208.67 | 810 | 791 | 152.7 |
| B | 12 | 111 | 15408 | 95.73 | 810 | 791 | 152.7 |
| C | 7 | 247 | 365040 | 1997.58 | 789 | 796 | 182.3 |
| C | 9 | 68 | 16759 | 87.54 | 789 | 796 | 182.3 |
| C | 13 | 61 | 6132 | 29.26 | 789 | 796 | 182.3 |
| D | 14 | 34 | 106203 | 560.98 | 773 | 749 | 188.0 |
| D | 2 | 14 | 100390 | 530.06 | 773 | 749 | 188.0 |
| D | 12 | 233 | 33498 | 174.21 | 773 | 749 | 188.0 |
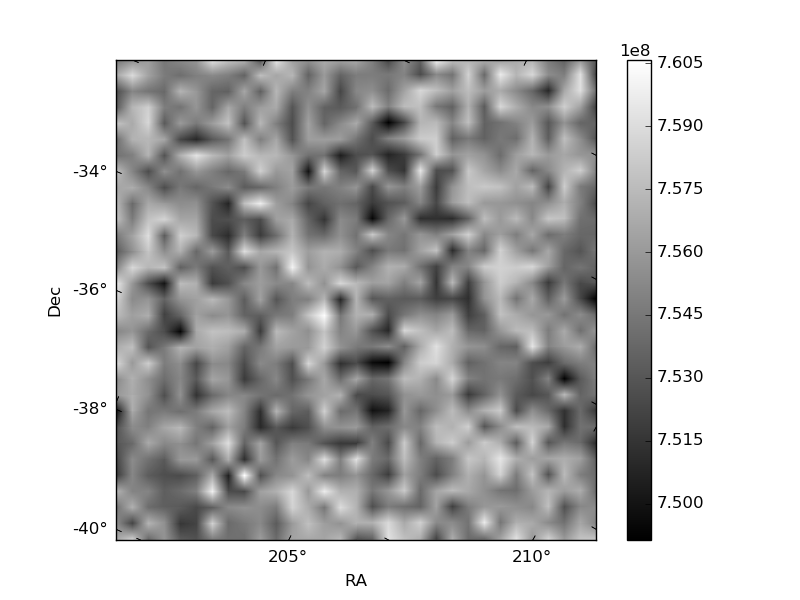
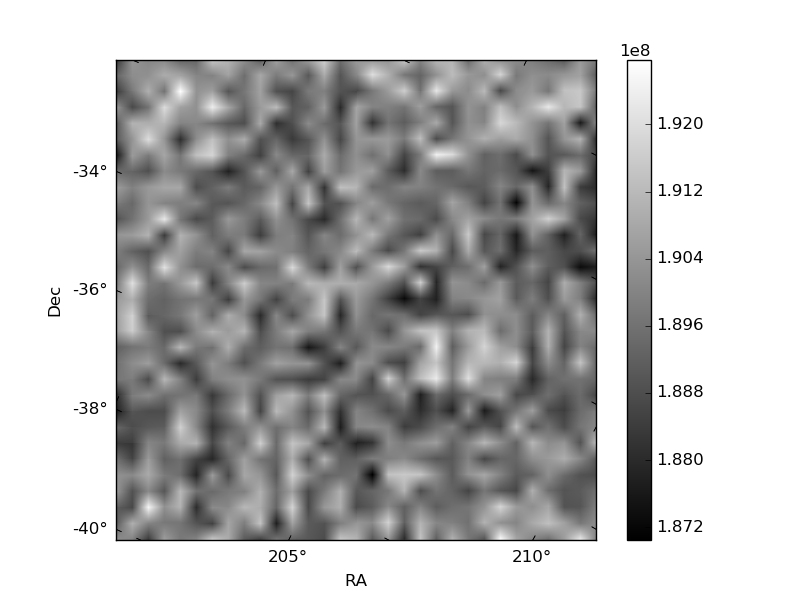
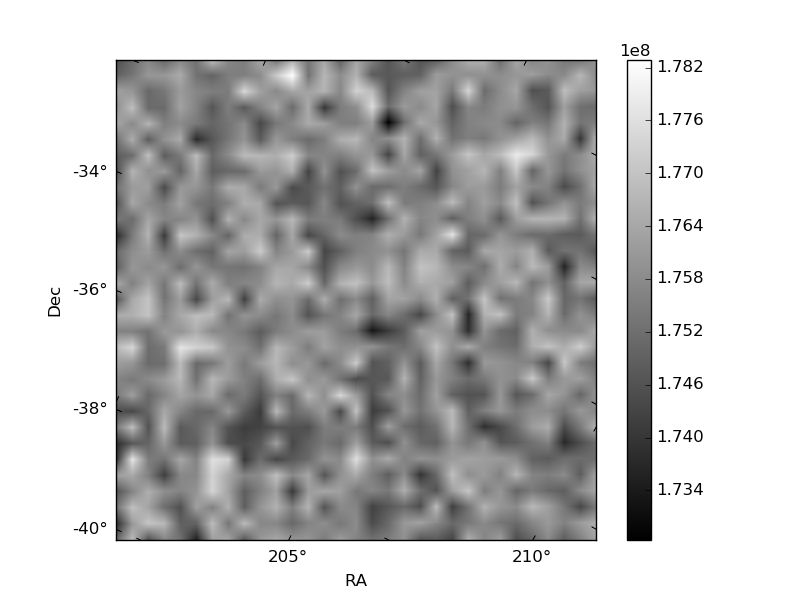
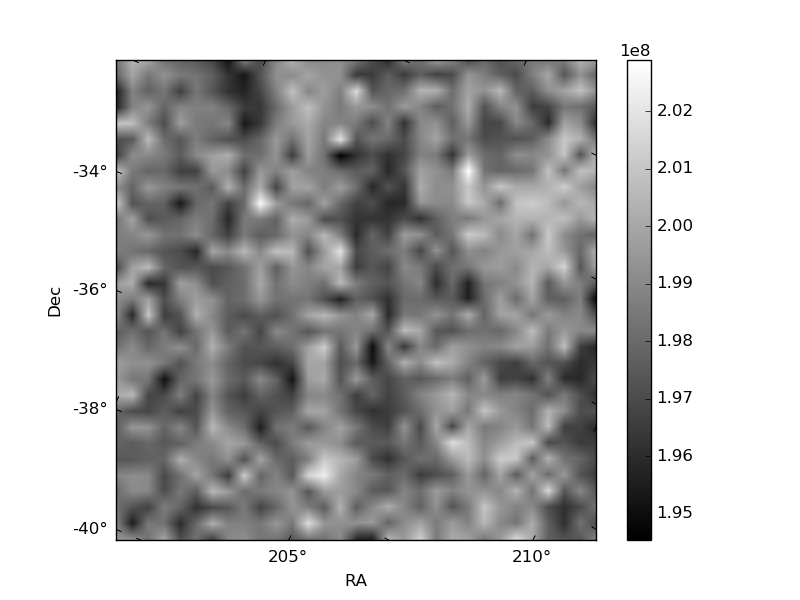
Histogram calculated using DETX and DETY for each event in the final _common_clean file
| Quadrant A | 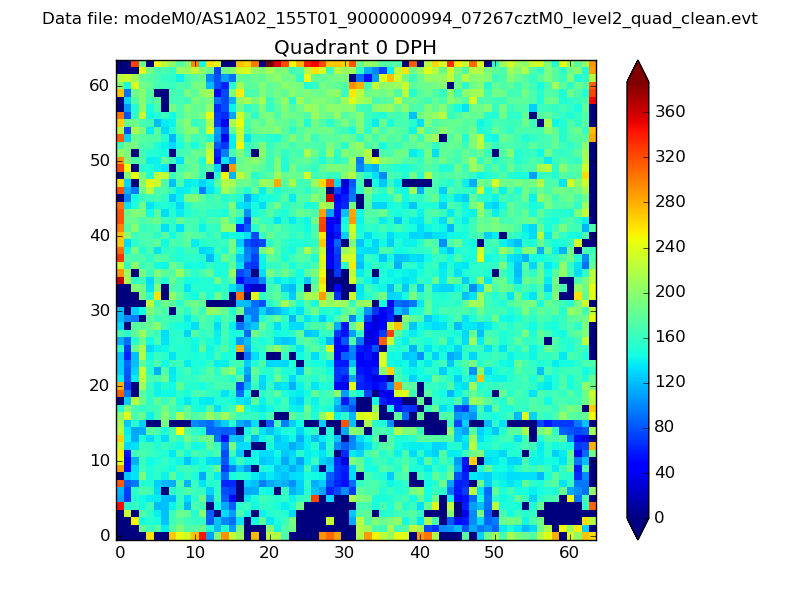 |
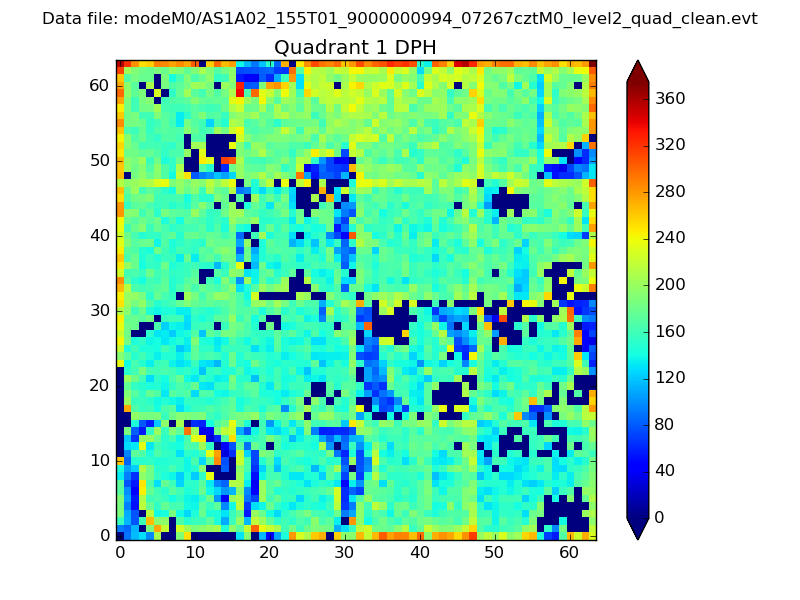 |
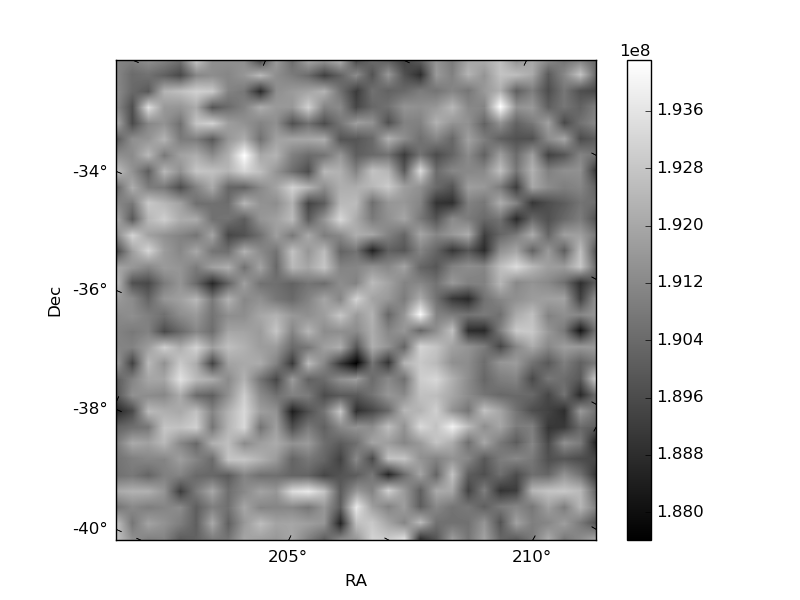
Quadrant B |
|---|---|---|---|
| Quadrant D | 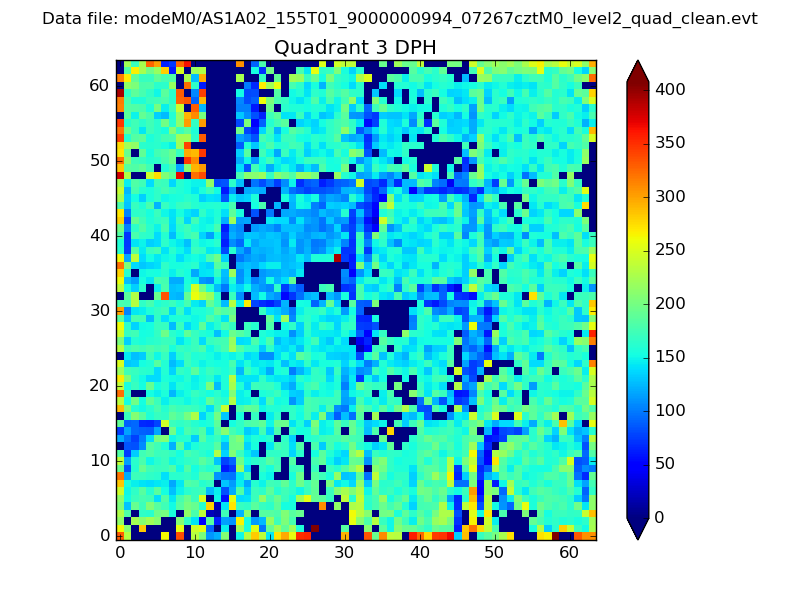 |
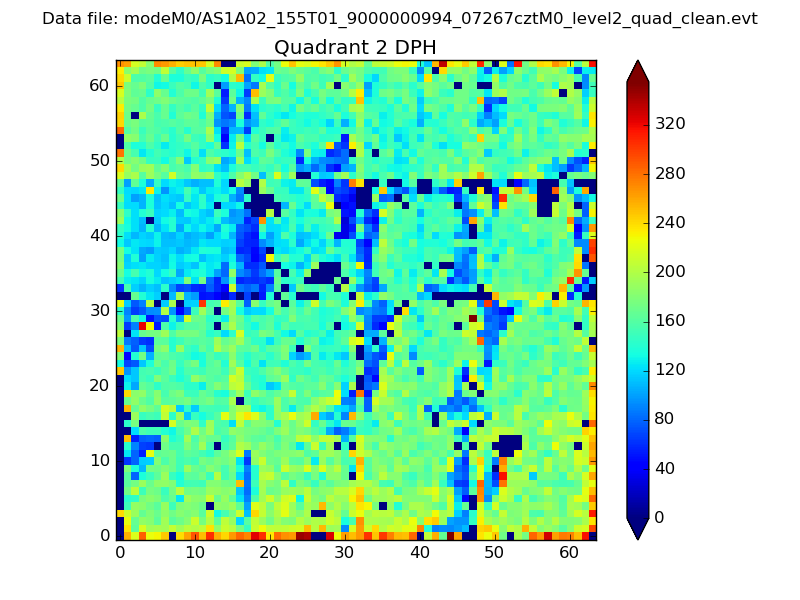 |
Quadrant C |
| Plot type | Count rate plots | Images |
|---|---|---|
| Comparison with Poisson distribution Blue bars denote a histogram of data divided into 1 sec bins. Red curve is a Poisson curve with rate = median count rate of data. |
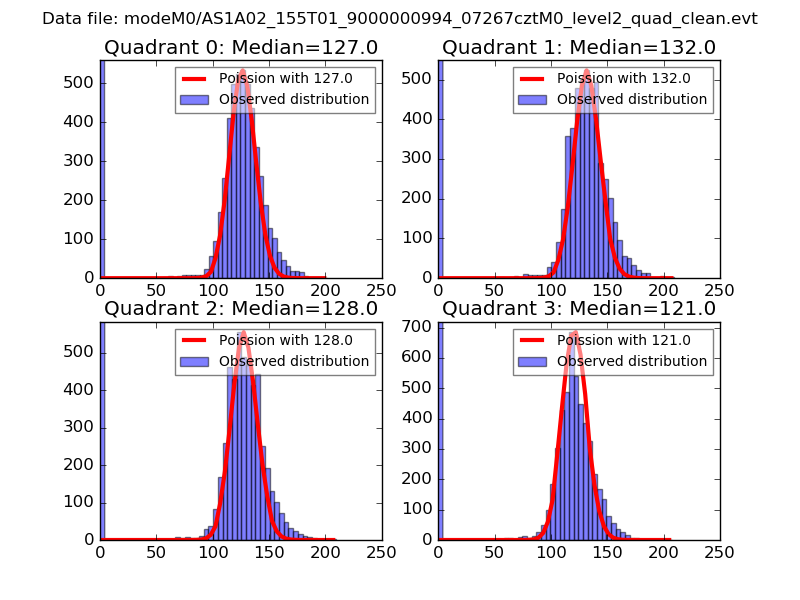 |
 |
| Quadrant-wise count rates Data is divided into 100 sec bins |
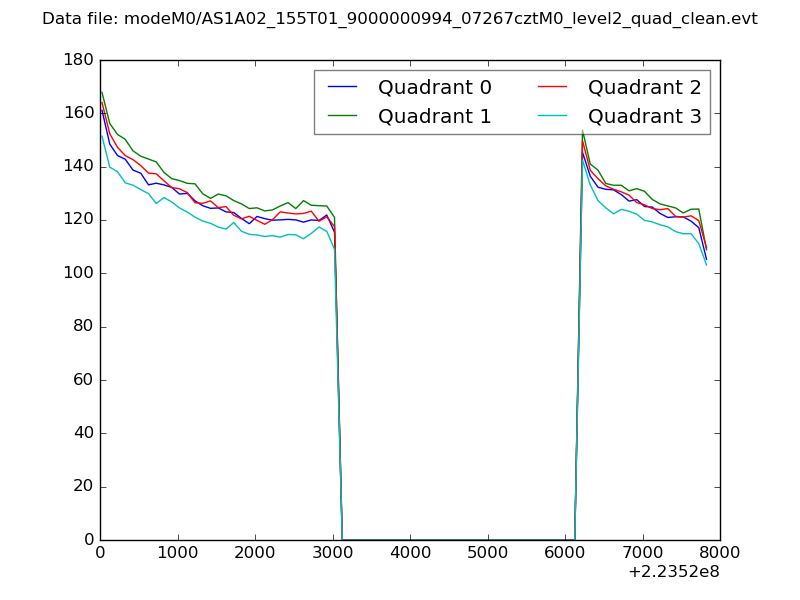 |
|
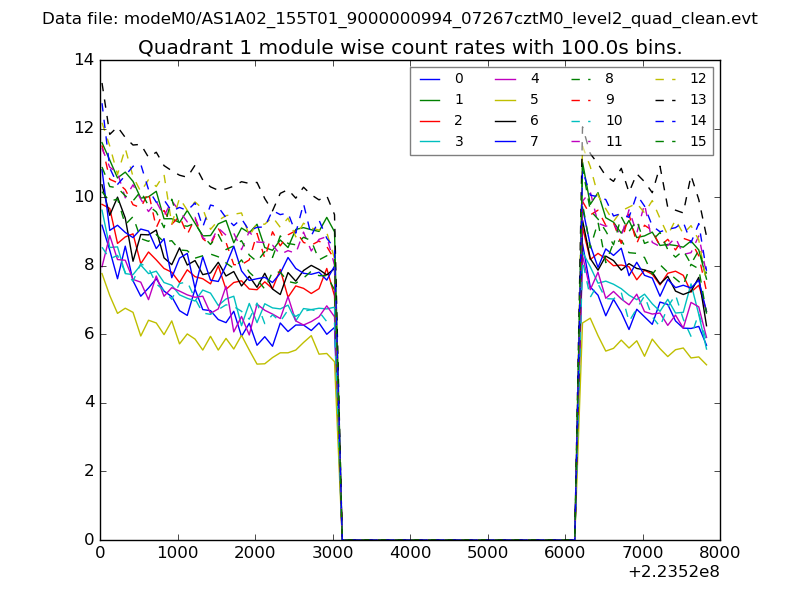
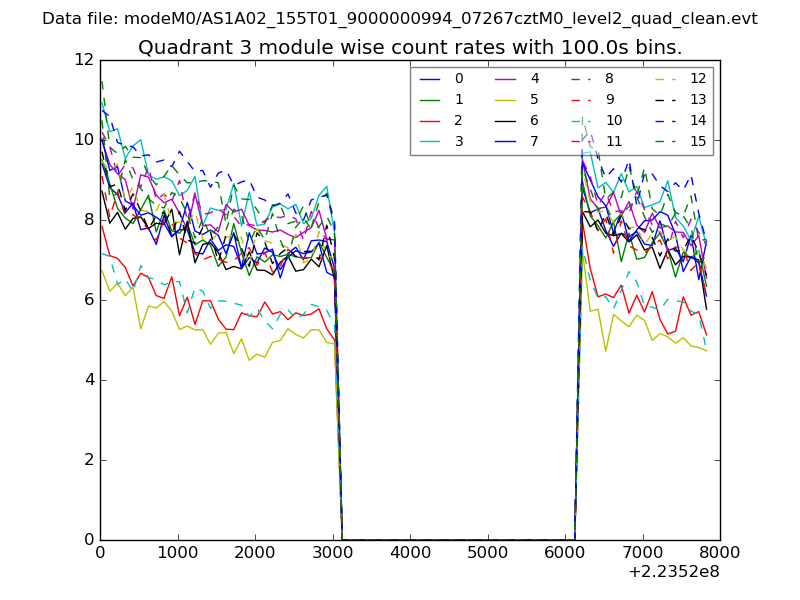
| Module-wise count rates for Quadrant A Data is divided into 100 sec bins |
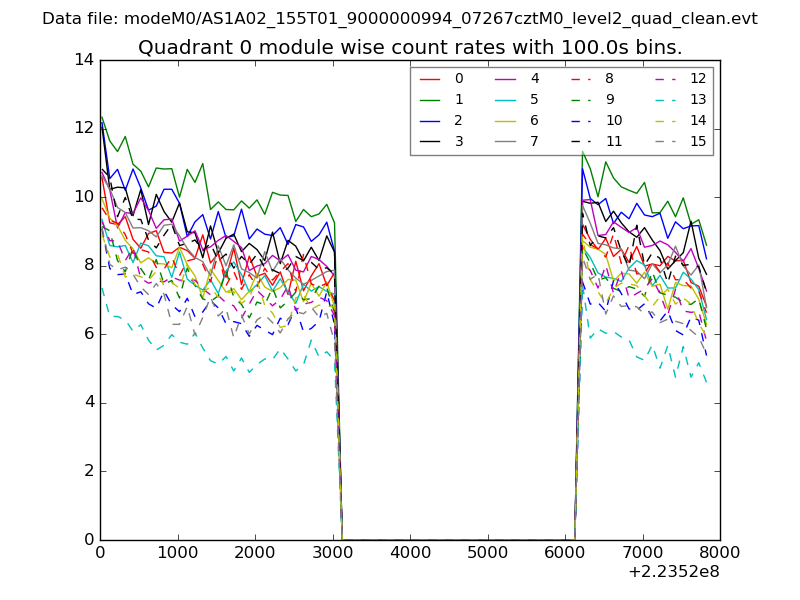 |
 |
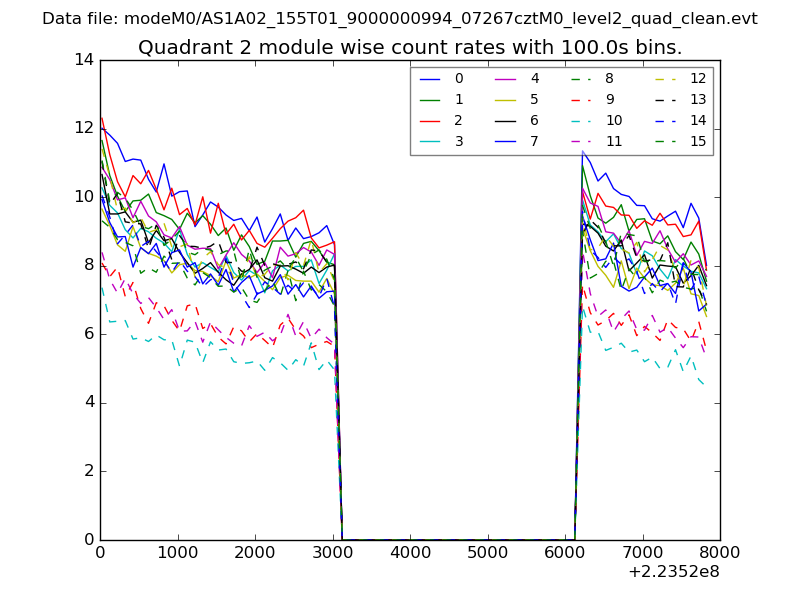
| Module-wise count rates for Quadrant B Data is divided into 100 sec bins |
 |
 |
| Module-wise count rates for Quadrant C Data is divided into 100 sec bins |
 |
 |
| Module-wise count rates for Quadrant D Data is divided into 100 sec bins |
 |
 |
| Parameter | Plot |
|---|---|
| CZT HV Monitor | 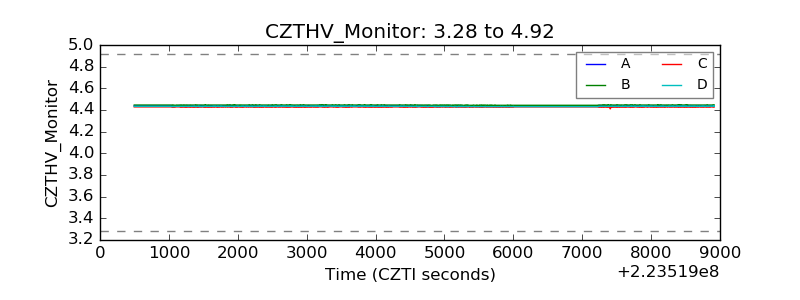 |
| D_VDD | 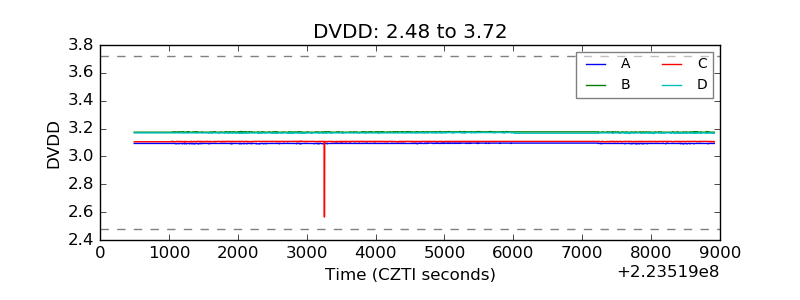 |
| Temperature 1 | 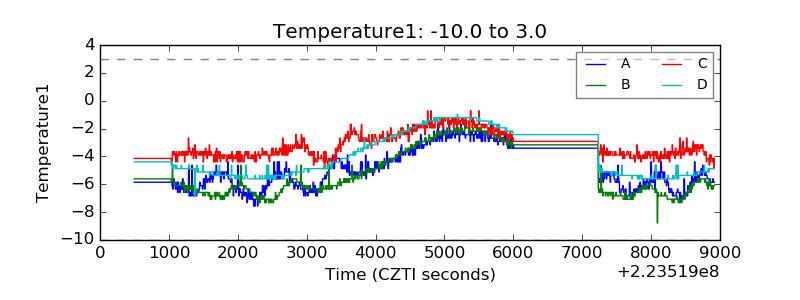 |
| Veto HV Monitor | 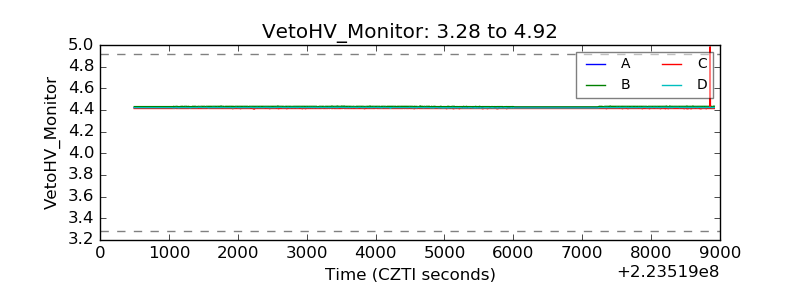 |
| Veto LLD | 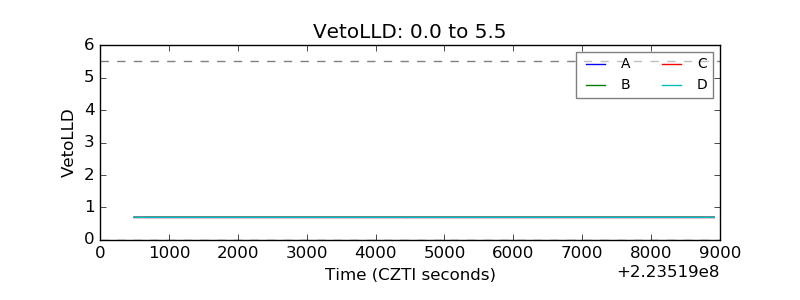 |
| Alpha Counter | 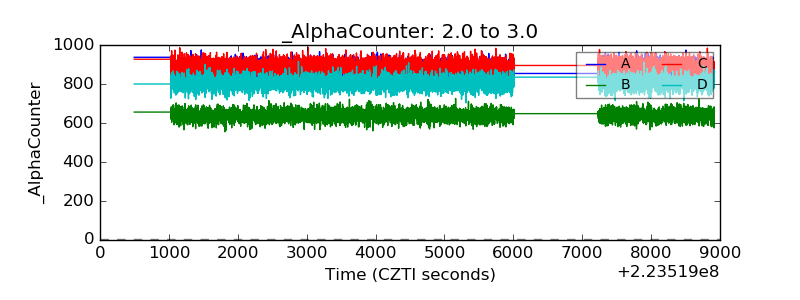 |
| _CPM_Rate | 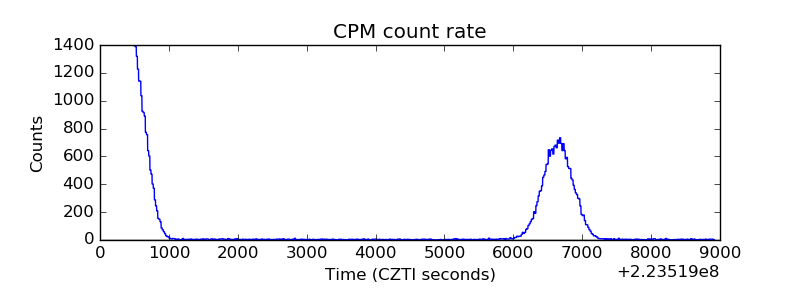 |
| CZT Counter | 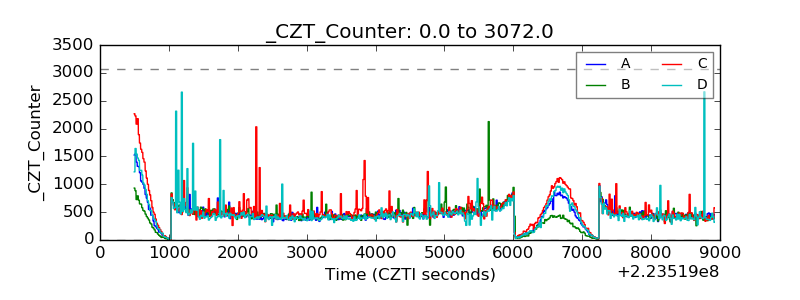 |
| +2.5 Volts monitor |  |
| +5 Volts monitor | 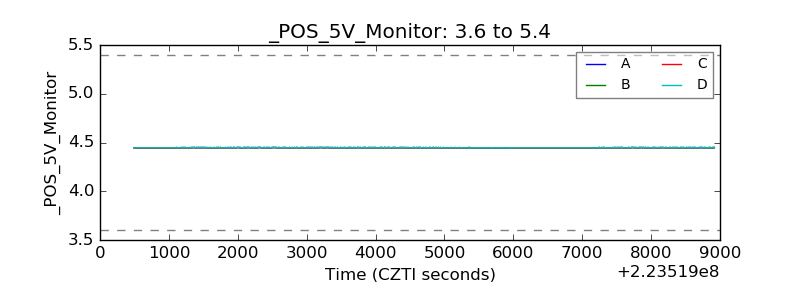 |
| _ROLL_ROT | 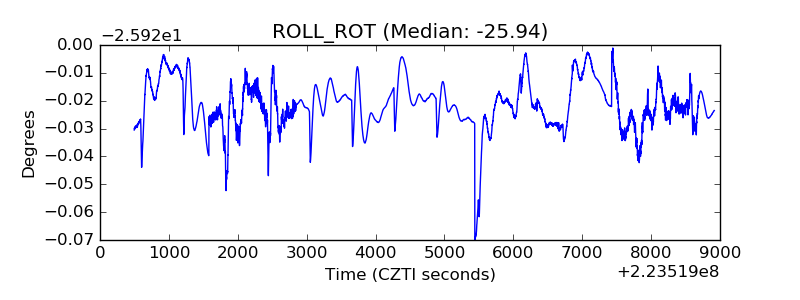 |
| _Roll_DEC | 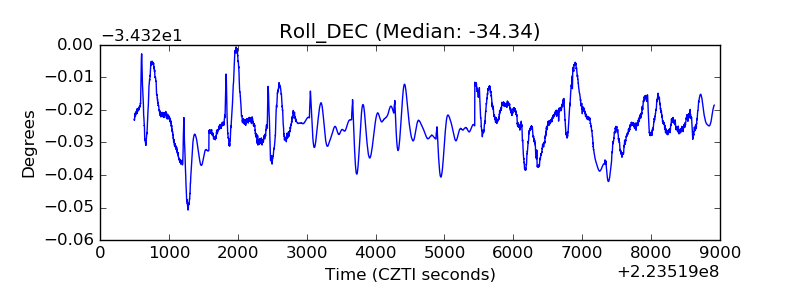 |
| _Roll_RA | 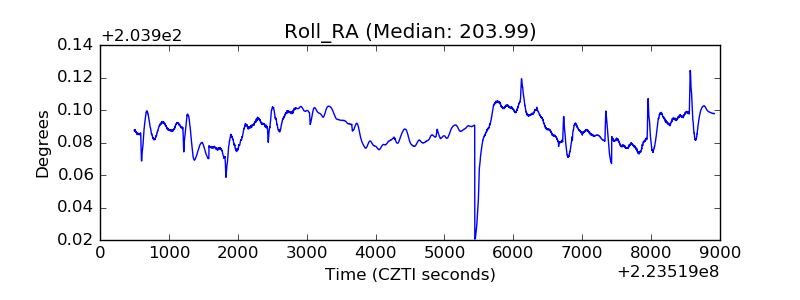 |
| Veto Counter | 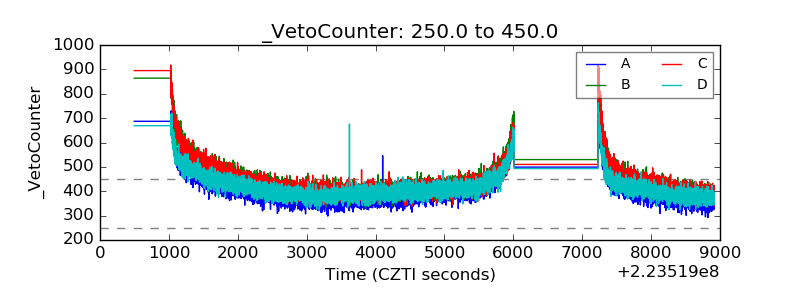 |