| Param | Original file | Final file |
|---|---|---|
| Filename | modeM0/AS1A02_155T01_9000000994_07270cztM0_level2.evt | modeM0/AS1A02_155T01_9000000994_07270cztM0_level2_quad_clean.evt |
| Size (bytes) | 695,030,400 | 135,512,640 |
| Size | 662.8 MB | 129.2 MB |
| Events in quadrant A | 4,853,034 | 849,548 |
| Events in quadrant B | 5,430,165 | 866,448 |
| Events in quadrant C | 4,940,870 | 853,437 |
| Events in quadrant D | 5,116,529 | 811,051 |
| Mode M9 | |||
|---|---|---|---|
| Quadrant | BADHDUFLAG | Total packets | Discarded packets |
| A | 0 | 5 | 0 |
| B | 0 | 5 | 0 |
| C | 0 | 5 | 0 |
| D | 0 | 5 | 0 |
| Mode M0 | |||
|---|---|---|---|
| Quadrant | BADHDUFLAG | Total packets | Discarded packets |
| A | 0 | 21722 | 3 |
| B | 0 | 23129 | 2 |
| C | 0 | 21791 | 2 |
| D | 0 | 22847 | 2 |
| Mode SS | |||
|---|---|---|---|
| Quadrant | BADHDUFLAG | Total packets | Discarded packets |
| A | 0 | 214 | 0 |
| B | 0 | 214 | 0 |
| C | 0 | 214 | 0 |
| D | 0 | 214 | 0 |
| Quadrant | Total seconds | Saturated seconds | Saturation percentage |
|---|---|---|---|
| A | 10440 | 266 | 2.547893% |
| B | 10440 | 358 | 3.429119% |
| C | 10440 | 191 | 1.829502% |
| D | 10440 | 248 | 2.375479% |
Noise dominated data is calculated using 1-second bins in cleaned event files. If a bin has >2000 counts, and if more than 50% of those come from <1% of pixels, then it is considered to be noise-dominated and hence unusable.
| Quadrant | # 1 sec bins | Bins with >0 counts | Bins with >2000 counts | High rate bins dominated by noise | Noise dominated (total time) | Noise dominated (detector-on time) | Marked lightcurve |
|---|---|---|---|---|---|---|---|
| A | 10925 | 10441 | 7 | 7 | 0.06% | 0.07% |  |
| B | 10925 | 10442 | 105 | 105 | 0.96% | 1.01% |  |
| C | 10925 | 10441 | 2 | 2 | 0.02% | 0.02% | 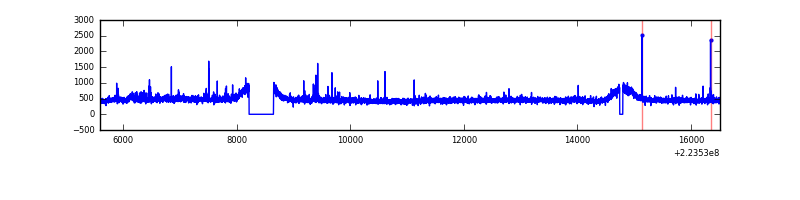 |
| D | 10925 | 10441 | 64 | 64 | 0.59% | 0.61% | 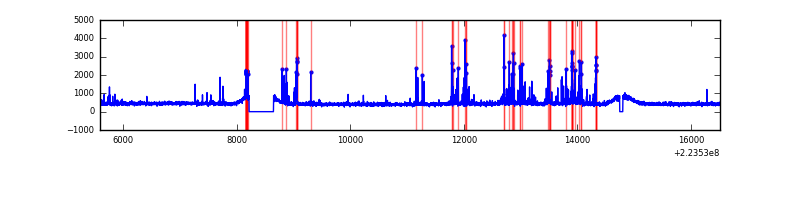 |
Top three noisy pixels from each quadrant. If the there are fewer than three noisy pixels in the level2.evt file, extra rows are filled as -1
| Pixel properties | Quadrant properties | ||||||
|---|---|---|---|---|---|---|---|
| Quadrant | DetID | PixID | Counts | Sigma | Mean | Median | Sigma |
| A | 14 | 111 | 92654 | 362.54 | 1230 | 1201 | 252.3 |
| A | 3 | 1 | 17470 | 64.49 | 1230 | 1201 | 252.3 |
| A | 0 | 226 | 11554 | 41.04 | 1230 | 1201 | 252.3 |
| B | 10 | 245 | 354804 | 1481.75 | 1241 | 1206 | 238.6 |
| B | 4 | 239 | 106265 | 440.25 | 1241 | 1206 | 238.6 |
| B | 4 | 81 | 73180 | 301.61 | 1241 | 1206 | 238.6 |
| C | 7 | 247 | 146510 | 512.65 | 1218 | 1223 | 283.4 |
| C | 9 | 68 | 30445 | 103.11 | 1218 | 1223 | 283.4 |
| C | 13 | 61 | 9540 | 29.35 | 1218 | 1223 | 283.4 |
| D | 2 | 14 | 233583 | 786.03 | 1205 | 1164 | 295.7 |
| D | 2 | 216 | 224080 | 753.89 | 1205 | 1164 | 295.7 |
| D | 14 | 34 | 76153 | 253.61 | 1205 | 1164 | 295.7 |
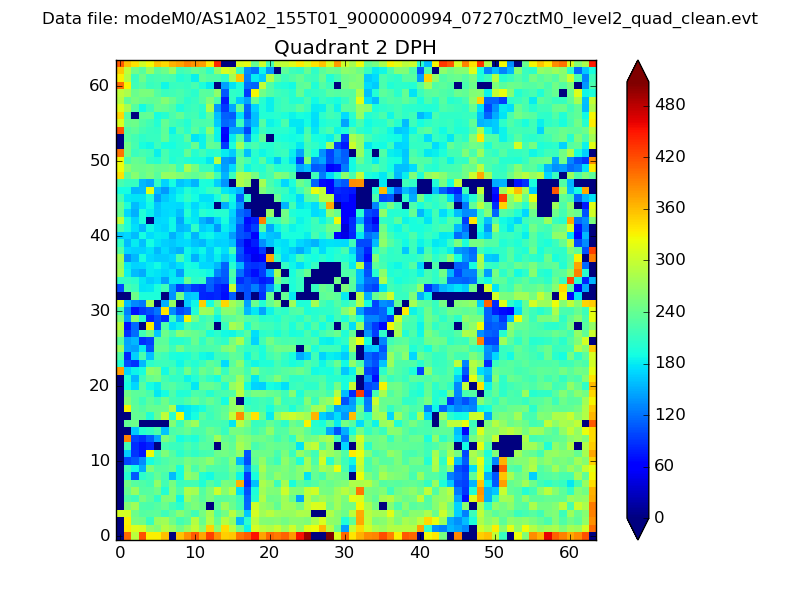
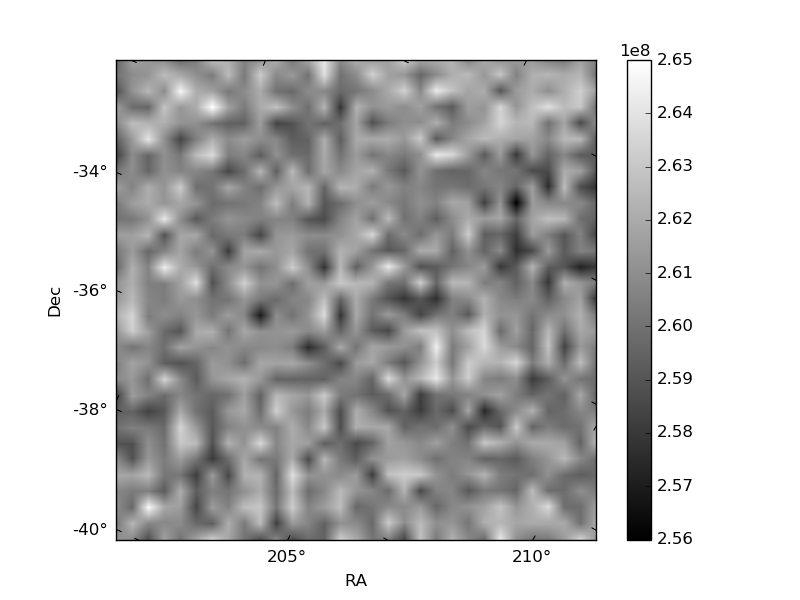
Histogram calculated using DETX and DETY for each event in the final _common_clean file
| Quadrant A | 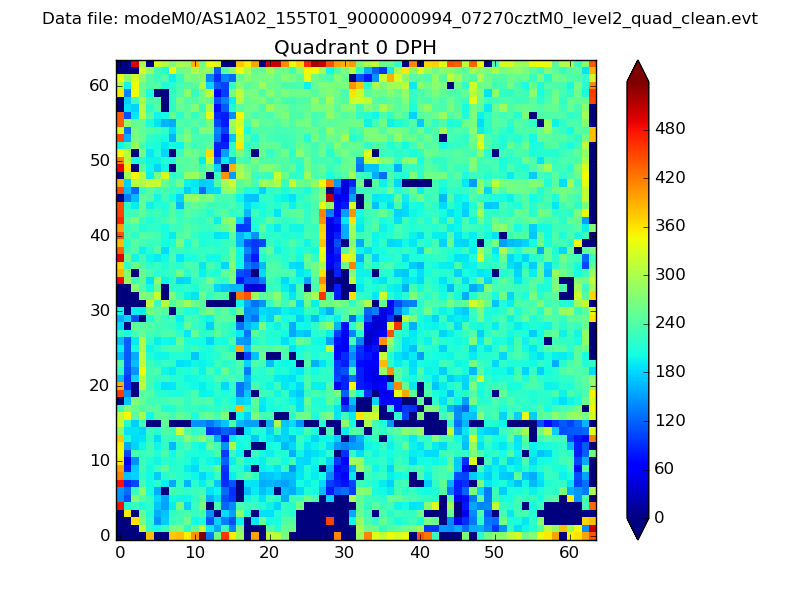 |
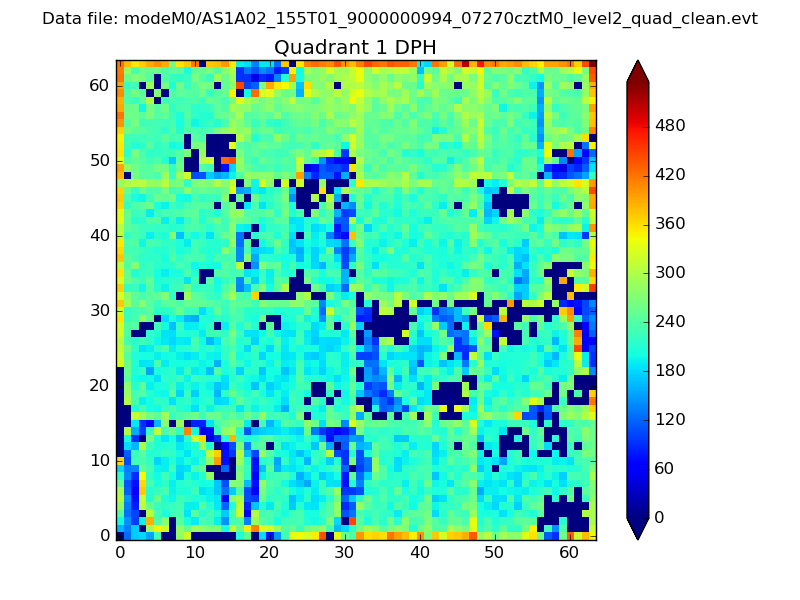 |
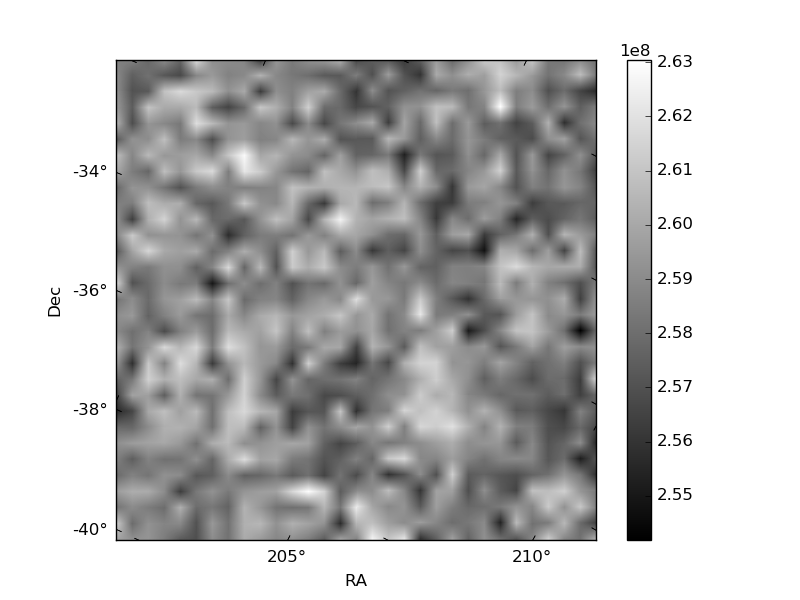
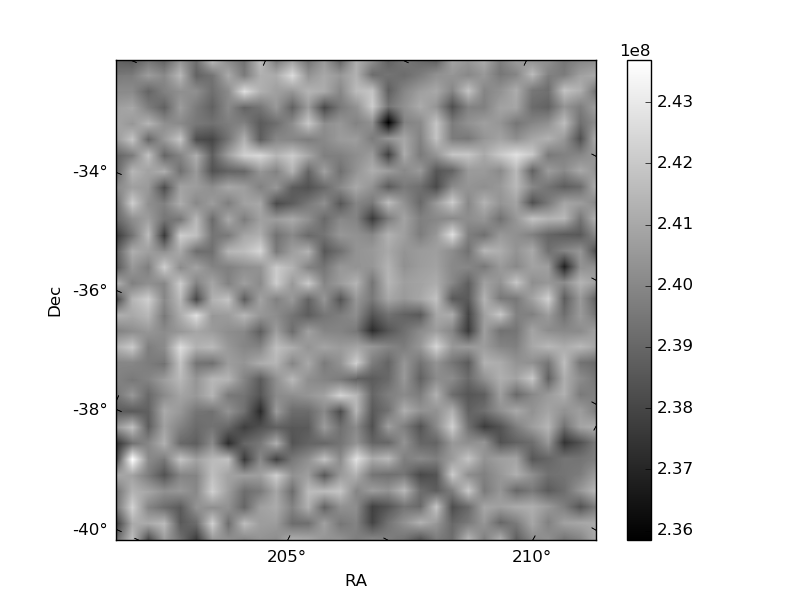
Quadrant B |
|---|---|---|---|
| Quadrant D | 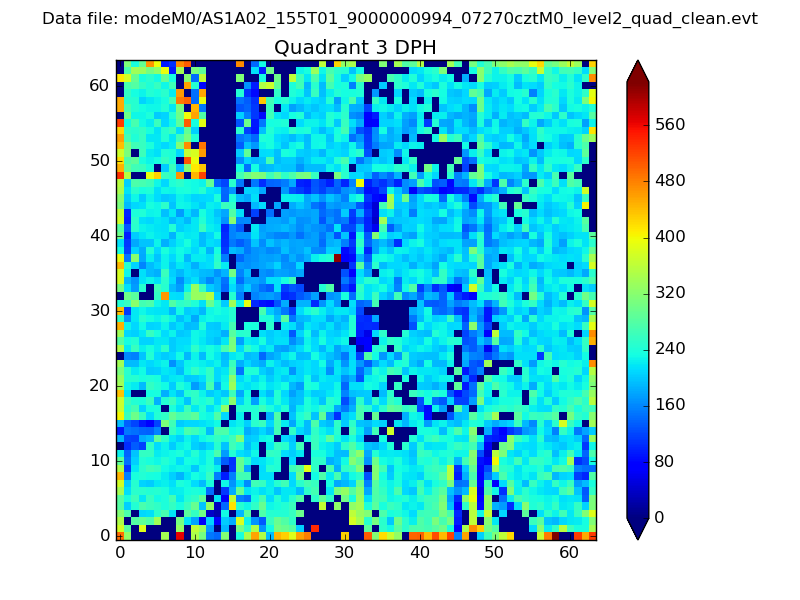 |
 |
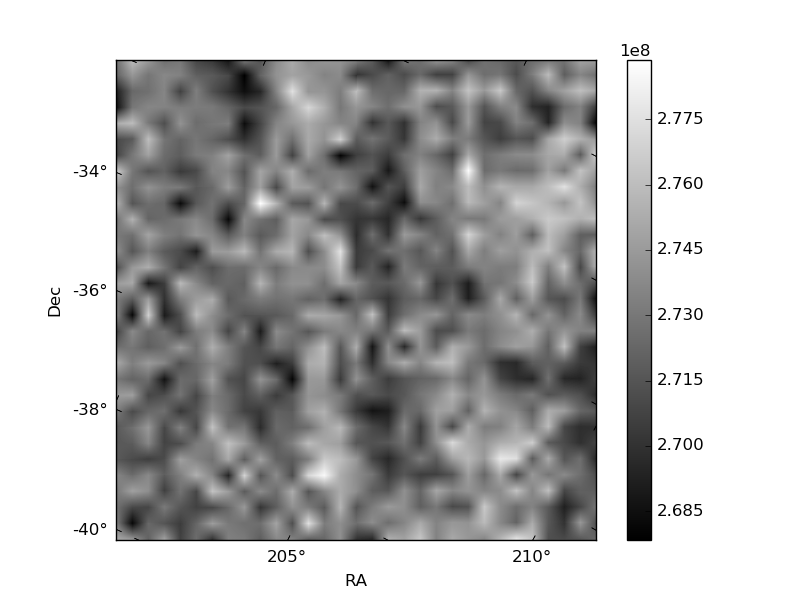
Quadrant C |
| Plot type | Count rate plots | Images |
|---|---|---|
| Comparison with Poisson distribution Blue bars denote a histogram of data divided into 1 sec bins. Red curve is a Poisson curve with rate = median count rate of data. |
 |
 |
| Quadrant-wise count rates Data is divided into 100 sec bins |
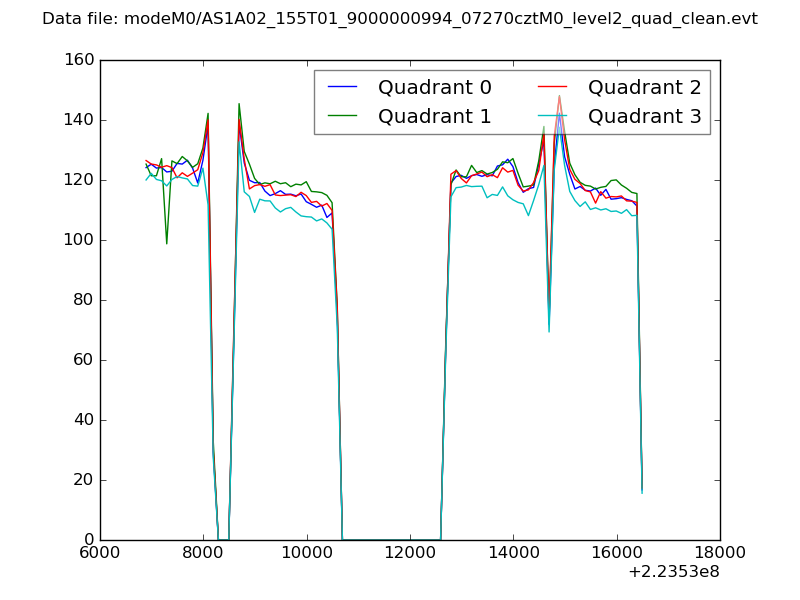 |
|
| Module-wise count rates for Quadrant A Data is divided into 100 sec bins |
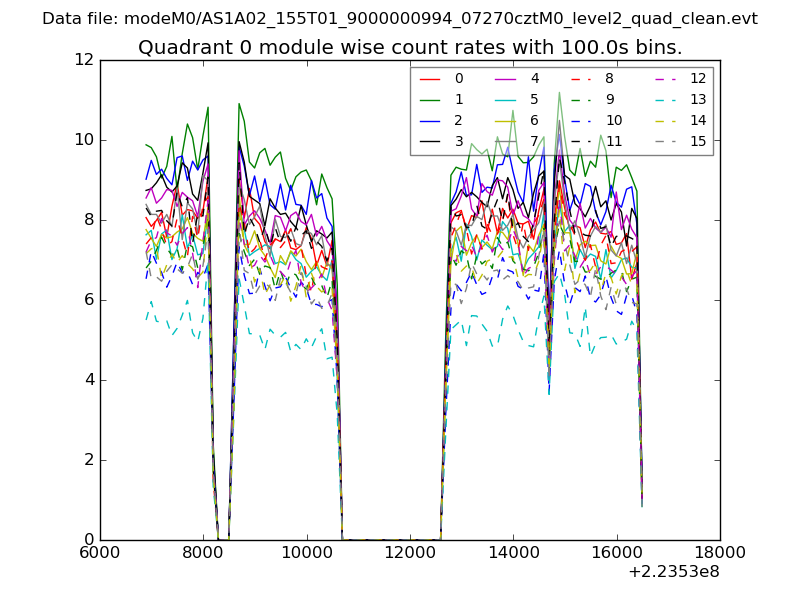 |
 |
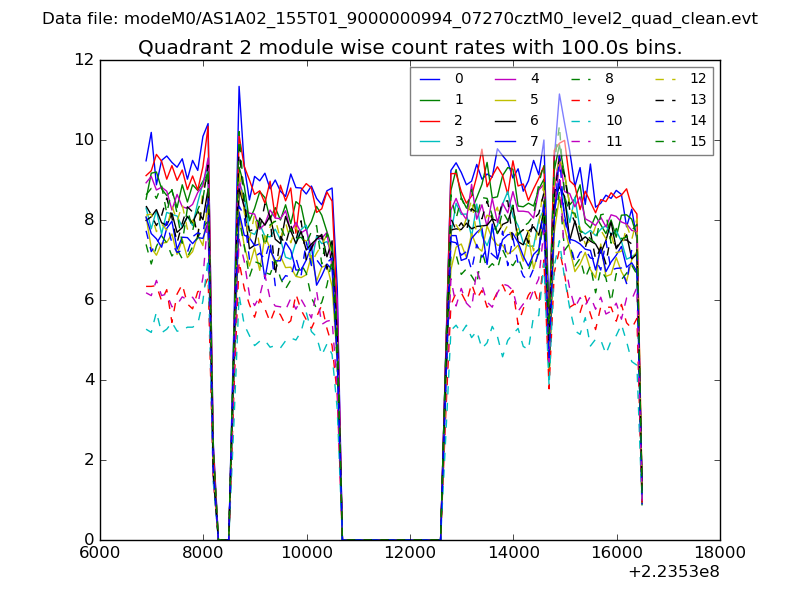
| Module-wise count rates for Quadrant B Data is divided into 100 sec bins |
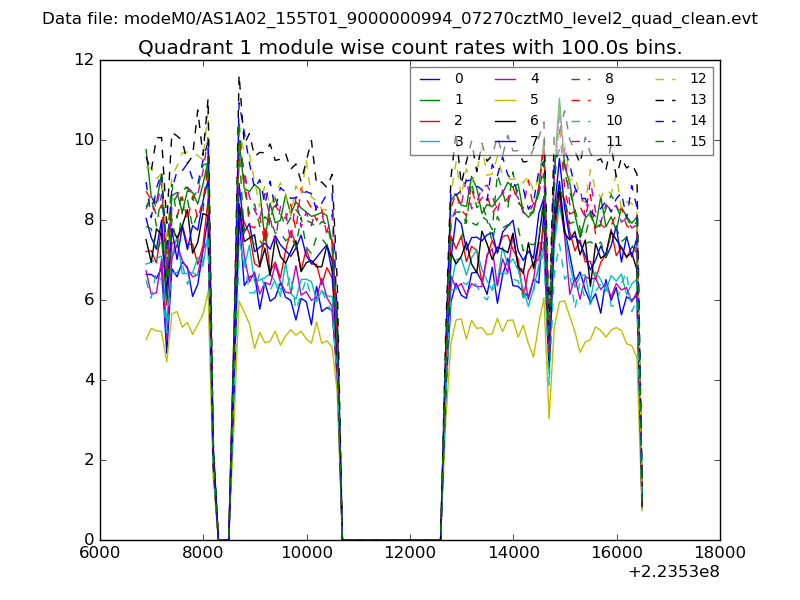 |
 |
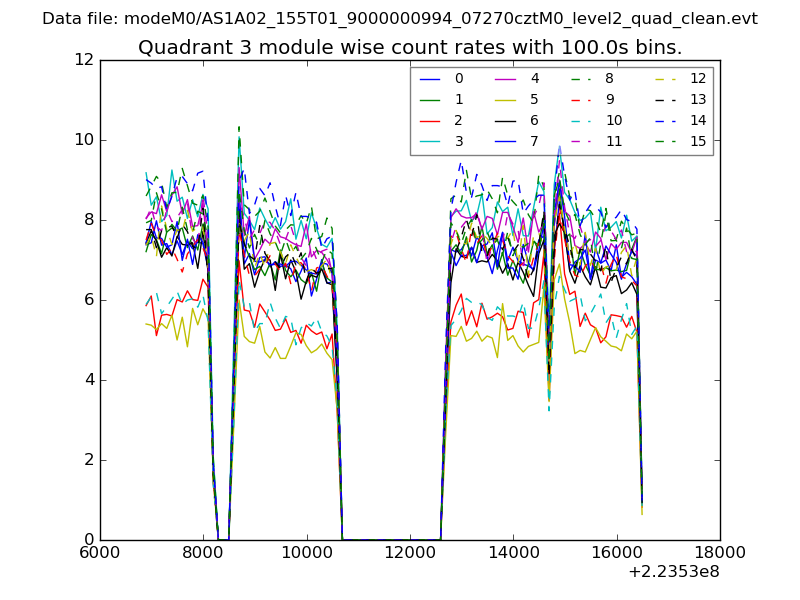
| Module-wise count rates for Quadrant C Data is divided into 100 sec bins |
 |
 |
| Module-wise count rates for Quadrant D Data is divided into 100 sec bins |
 |
 |
| Parameter | Plot |
|---|---|
| CZT HV Monitor | 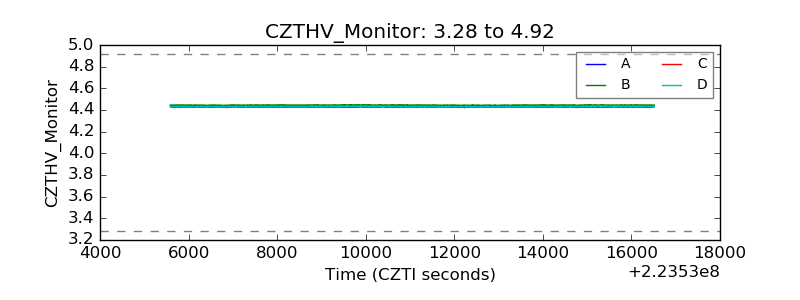 |
| D_VDD | 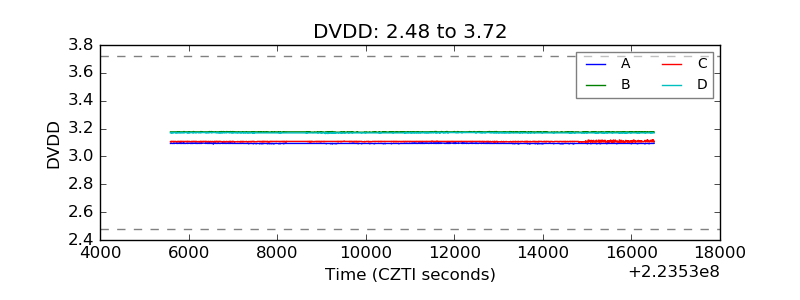 |
| Temperature 1 | 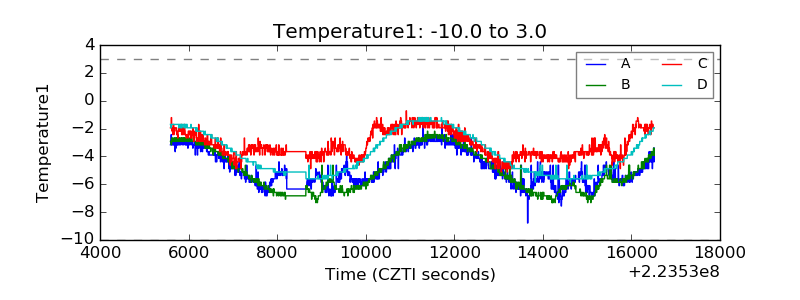 |
| Veto HV Monitor | 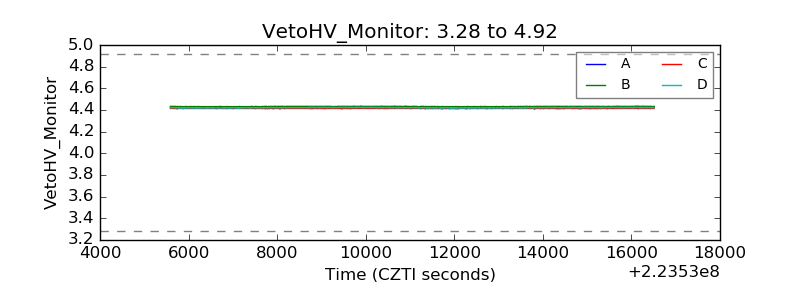 |
| Veto LLD | 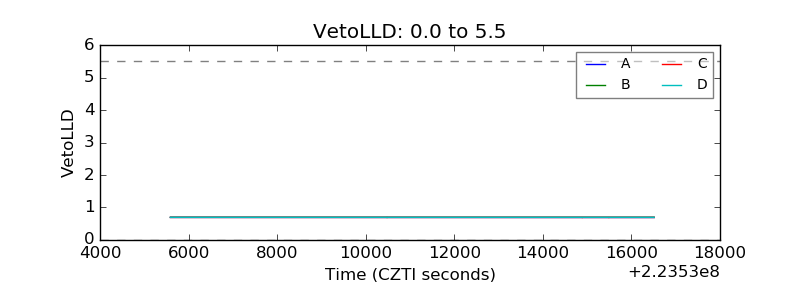 |
| Alpha Counter | 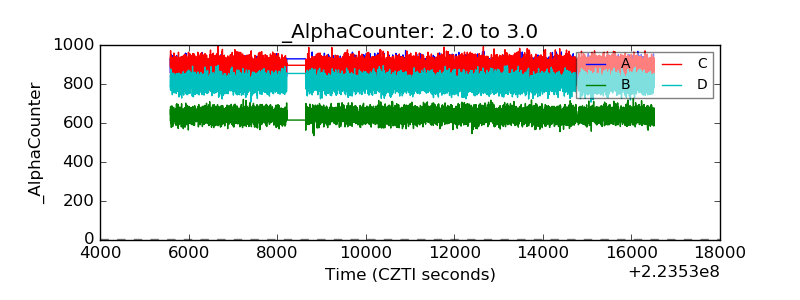 |
| _CPM_Rate | 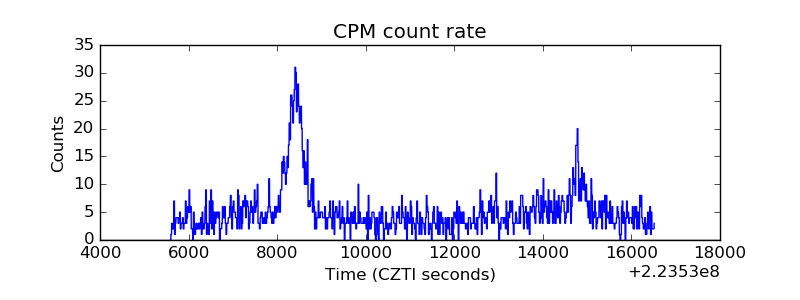 |
| CZT Counter | 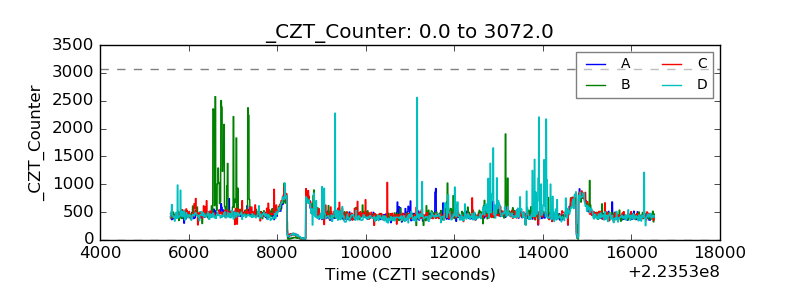 |
| +2.5 Volts monitor |  |
| +5 Volts monitor |  |
| _ROLL_ROT | 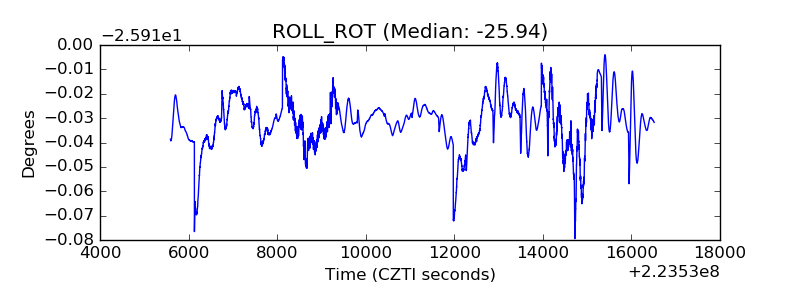 |
| _Roll_DEC | 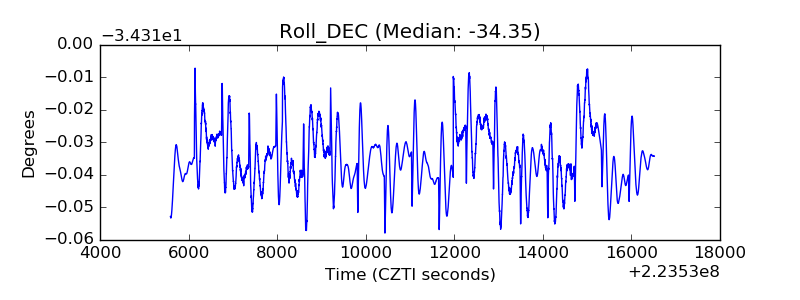 |
| _Roll_RA | 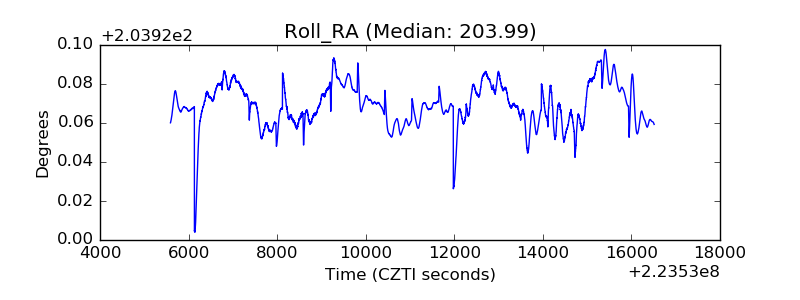 |
| Veto Counter | 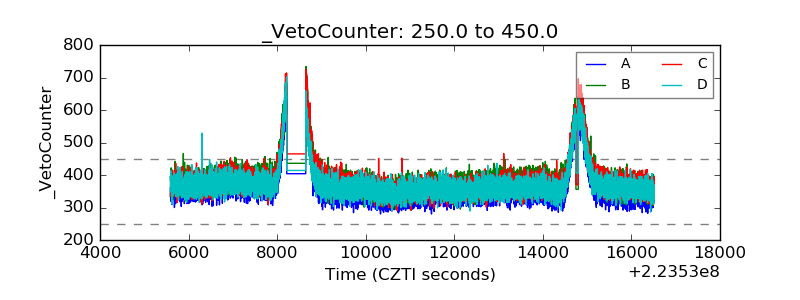 |