| Param | Original file | Final file |
|---|---|---|
| Filename | modeM0/AS1A02_155T01_9000000994_07274cztM0_level2.evt | modeM0/AS1A02_155T01_9000000994_07274cztM0_level2_quad_clean.evt |
| Size (bytes) | 1,033,464,960 | 179,660,160 |
| Size | 985.6 MB | 171.3 MB |
| Events in quadrant A | 7,230,645 | 1,100,760 |
| Events in quadrant B | 7,655,027 | 1,115,122 |
| Events in quadrant C | 6,973,995 | 1,104,182 |
| Events in quadrant D | 8,389,984 | 1,051,729 |
| Mode M9 | |||
|---|---|---|---|
| Quadrant | BADHDUFLAG | Total packets | Discarded packets |
| A | 0 | 5 | 0 |
| B | 0 | 5 | 0 |
| C | 0 | 5 | 0 |
| D | 0 | 5 | 0 |
| Mode M0 | |||
|---|---|---|---|
| Quadrant | BADHDUFLAG | Total packets | Discarded packets |
| A | 0 | 32629 | 1 |
| B | 0 | 33013 | 1 |
| C | 0 | 31909 | 1 |
| D | 0 | 36096 | 1 |
| Mode SS | |||
|---|---|---|---|
| Quadrant | BADHDUFLAG | Total packets | Discarded packets |
| A | 0 | 312 | 0 |
| B | 0 | 312 | 0 |
| C | 0 | 312 | 0 |
| D | 0 | 312 | 0 |
| Quadrant | Total seconds | Saturated seconds | Saturation percentage |
|---|---|---|---|
| A | 15495 | 372 | 2.400774% |
| B | 15495 | 418 | 2.697644% |
| C | 15495 | 300 | 1.936108% |
| D | 15495 | 524 | 3.381736% |
Noise dominated data is calculated using 1-second bins in cleaned event files. If a bin has >2000 counts, and if more than 50% of those come from <1% of pixels, then it is considered to be noise-dominated and hence unusable.
| Quadrant | # 1 sec bins | Bins with >0 counts | Bins with >2000 counts | High rate bins dominated by noise | Noise dominated (total time) | Noise dominated (detector-on time) | Marked lightcurve |
|---|---|---|---|---|---|---|---|
| A | 15910 | 15496 | 6 | 6 | 0.04% | 0.04% | 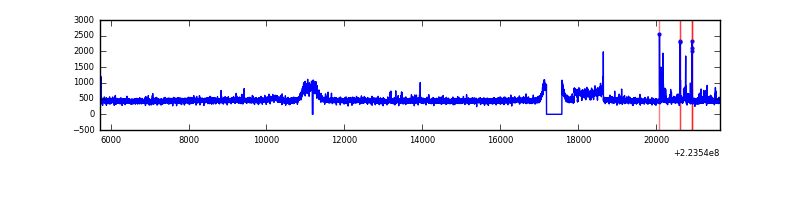 |
| B | 15910 | 15496 | 68 | 68 | 0.43% | 0.44% | 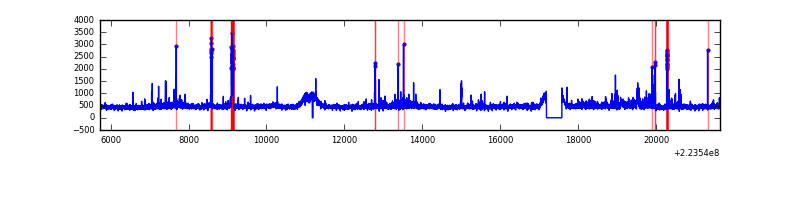 |
| C | 15910 | 15496 | 1 | 1 | 0.01% | 0.01% | 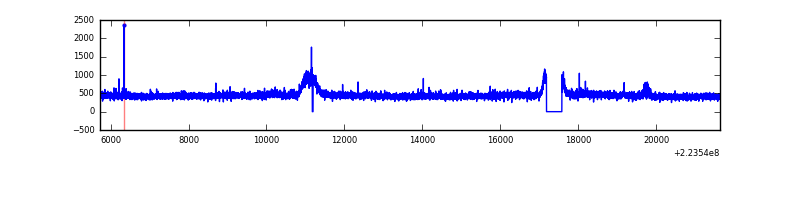 |
| D | 15910 | 15496 | 172 | 172 | 1.08% | 1.11% | 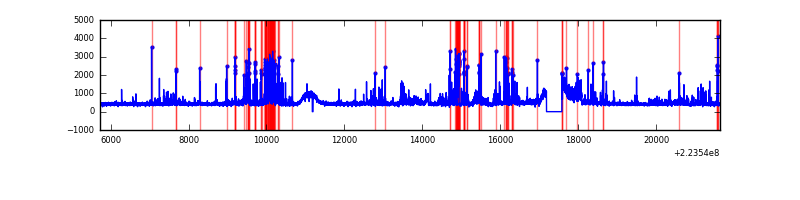 |
Top three noisy pixels from each quadrant. If the there are fewer than three noisy pixels in the level2.evt file, extra rows are filled as -1
| Pixel properties | Quadrant properties | ||||||
|---|---|---|---|---|---|---|---|
| Quadrant | DetID | PixID | Counts | Sigma | Mean | Median | Sigma |
| A | 14 | 111 | 174442 | 471.91 | 1791 | 1750 | 365.9 |
| A | 8 | 15 | 143738 | 388.0 | 1791 | 1750 | 365.9 |
| A | 0 | 226 | 17761 | 43.75 | 1791 | 1750 | 365.9 |
| B | 0 | 214 | 167657 | 474.84 | 1805 | 1759 | 349.4 |
| B | 10 | 245 | 156850 | 443.91 | 1805 | 1759 | 349.4 |
| B | 4 | 239 | 135407 | 382.53 | 1805 | 1759 | 349.4 |
| C | 14 | 38 | 52980 | 124.89 | 1758 | 1763 | 410.1 |
| C | 9 | 68 | 23763 | 53.65 | 1758 | 1763 | 410.1 |
| C | 7 | 247 | 19556 | 43.39 | 1758 | 1763 | 410.1 |
| D | 1 | 52 | 764508 | 1792.02 | 1748 | 1695 | 425.7 |
| D | 2 | 14 | 576422 | 1350.17 | 1748 | 1695 | 425.7 |
| D | 12 | 110 | 135082 | 313.36 | 1748 | 1695 | 425.7 |
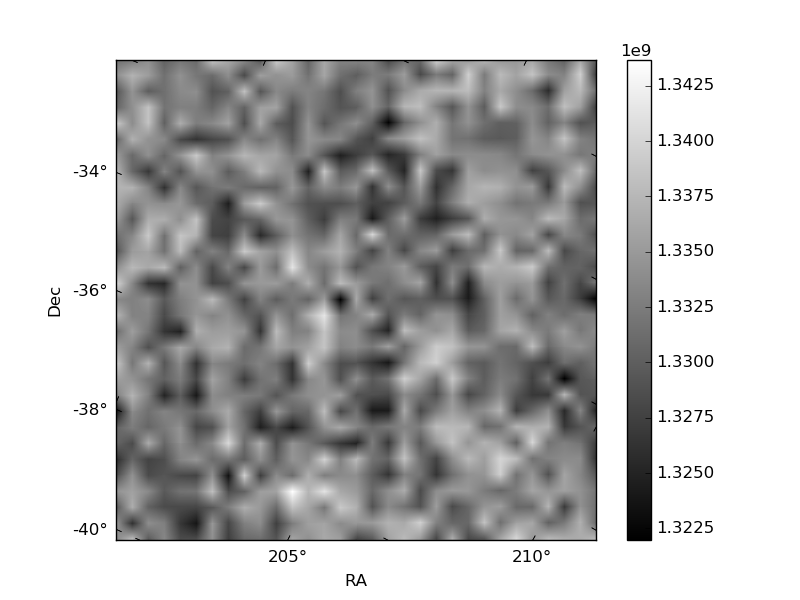
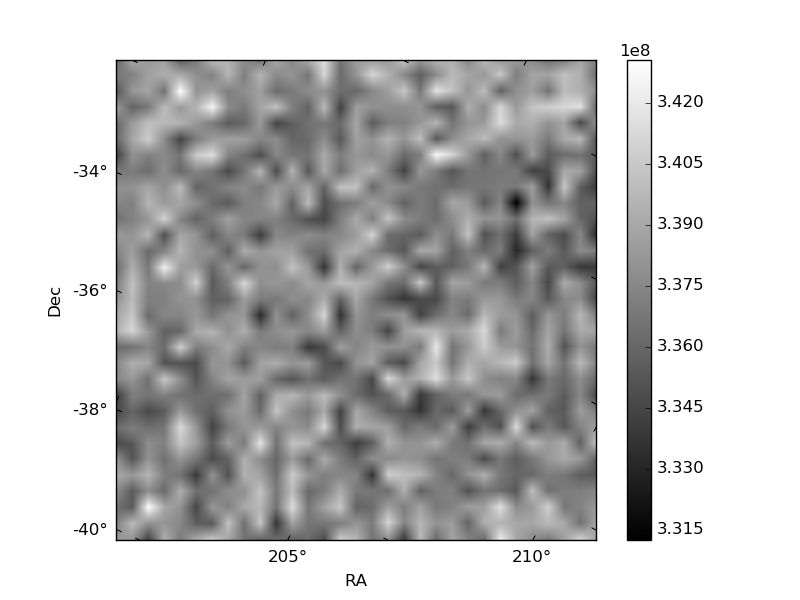
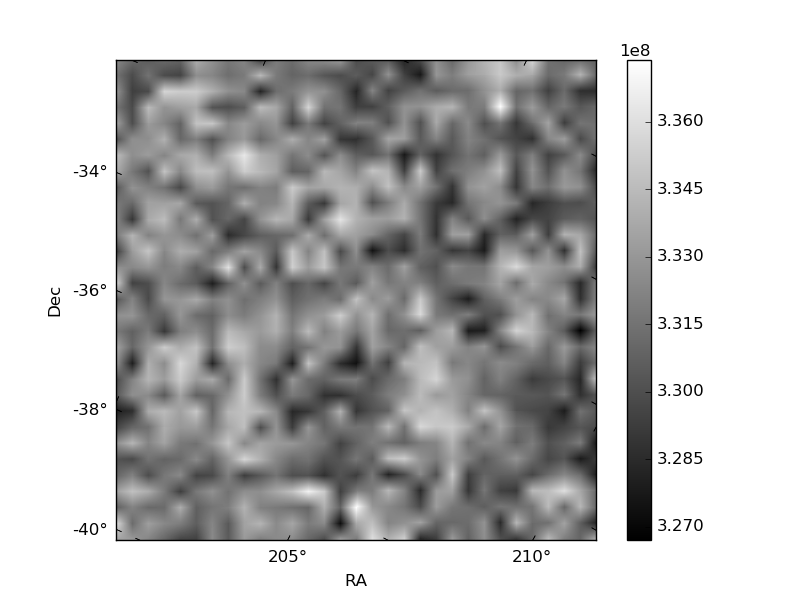
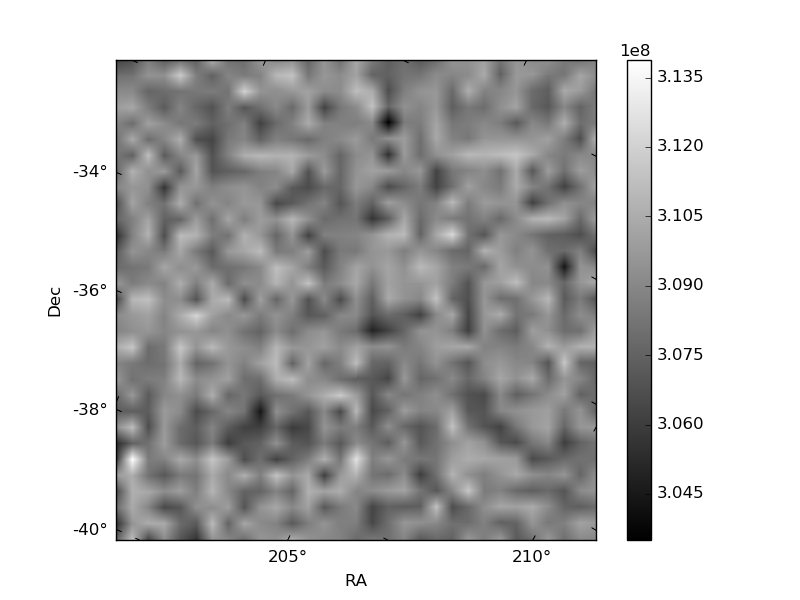
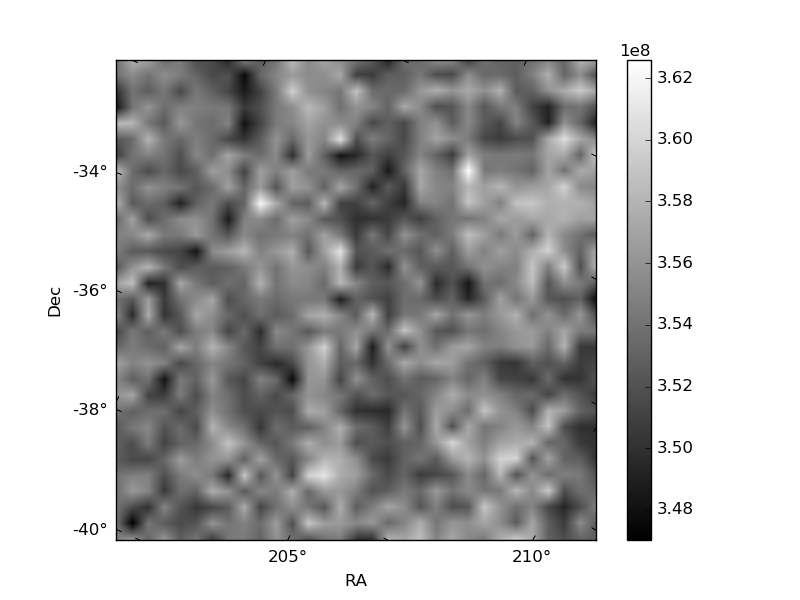
Histogram calculated using DETX and DETY for each event in the final _common_clean file
| Quadrant A | 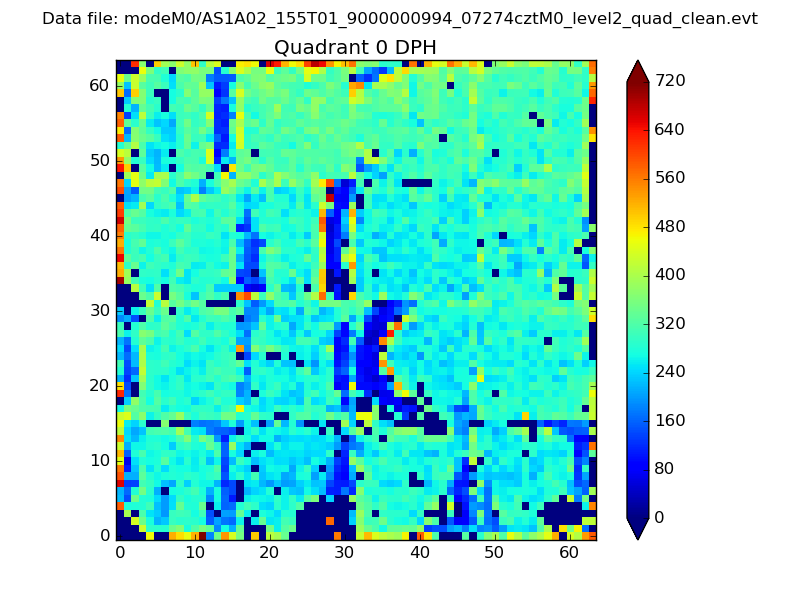 |
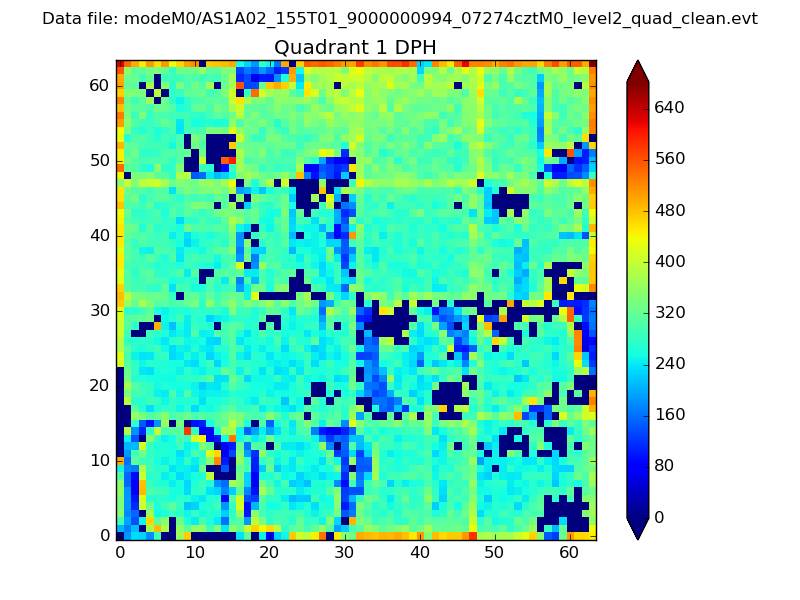 |
Quadrant B |
|---|---|---|---|
| Quadrant D | 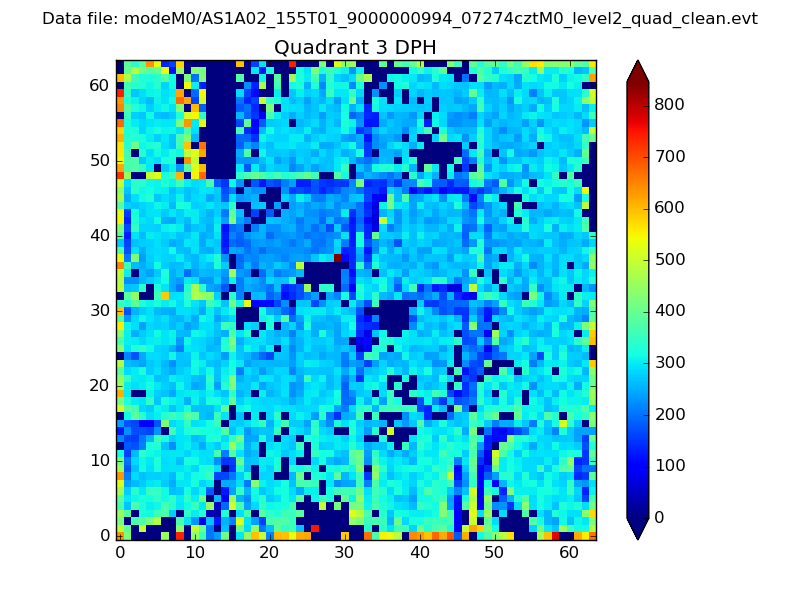 |
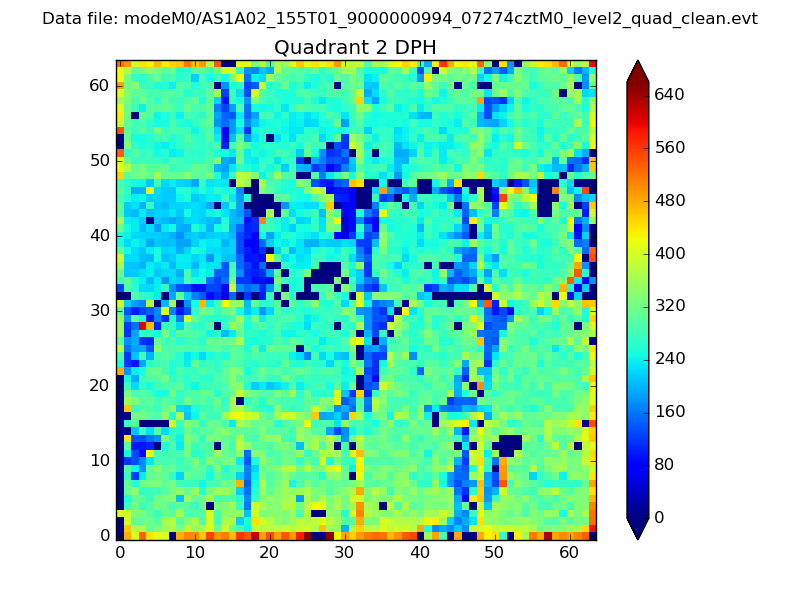 |
Quadrant C |
| Plot type | Count rate plots | Images |
|---|---|---|
| Comparison with Poisson distribution Blue bars denote a histogram of data divided into 1 sec bins. Red curve is a Poisson curve with rate = median count rate of data. |
 |
 |
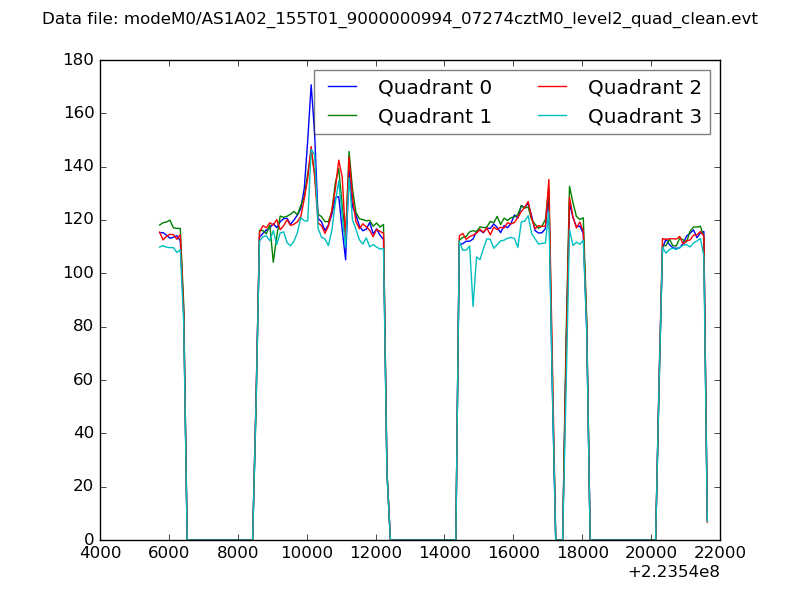
| Quadrant-wise count rates Data is divided into 100 sec bins |
 |
|
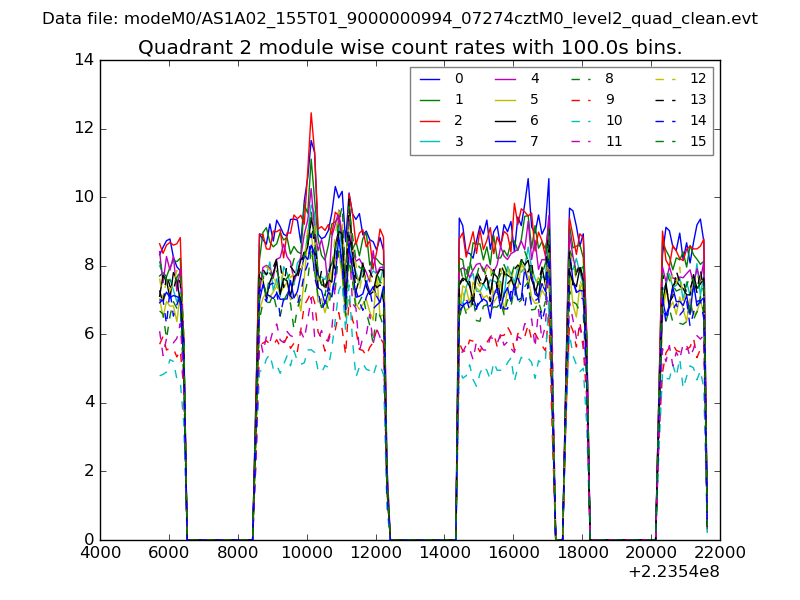
| Module-wise count rates for Quadrant A Data is divided into 100 sec bins |
 |
 |
| Module-wise count rates for Quadrant B Data is divided into 100 sec bins |
 |
 |
| Module-wise count rates for Quadrant C Data is divided into 100 sec bins |
 |
 |
| Module-wise count rates for Quadrant D Data is divided into 100 sec bins |
 |
 |
| Parameter | Plot |
|---|---|
| CZT HV Monitor | 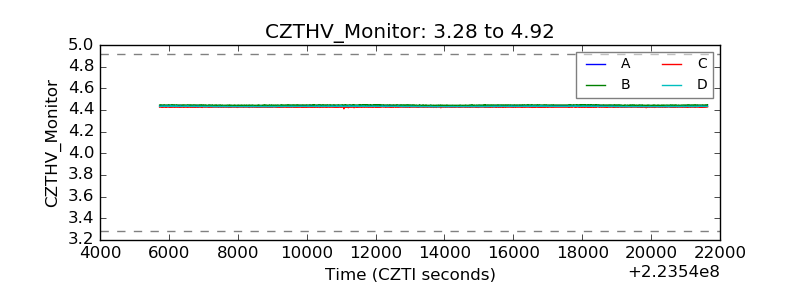 |
| D_VDD | 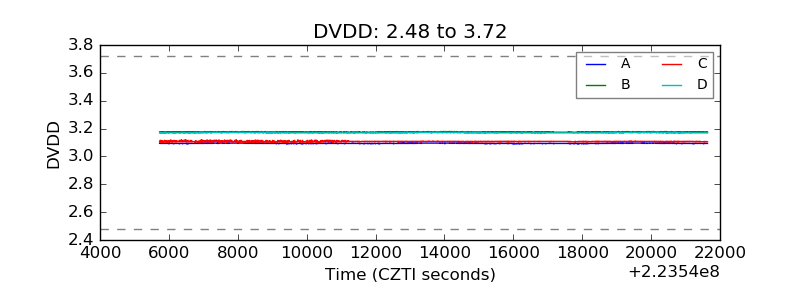 |
| Temperature 1 | 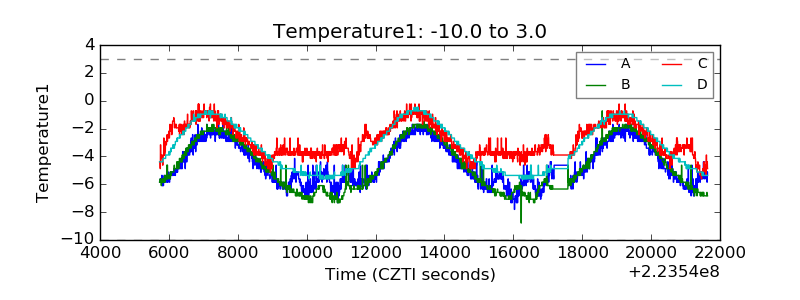 |
| Veto HV Monitor | 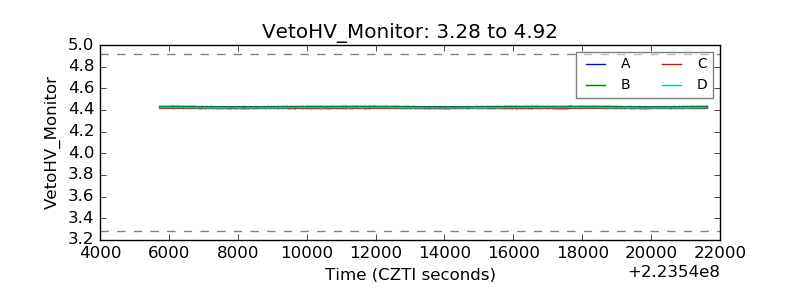 |
| Veto LLD | 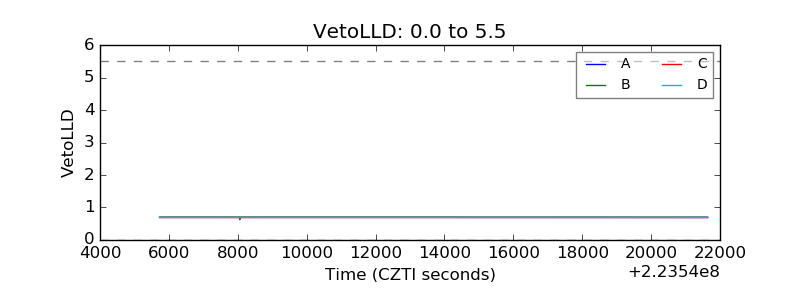 |
| Alpha Counter | 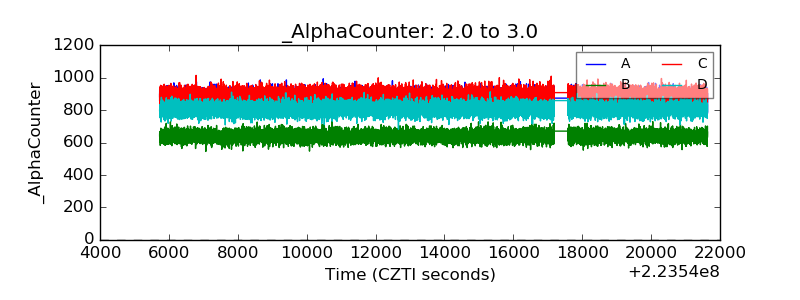 |
| _CPM_Rate | 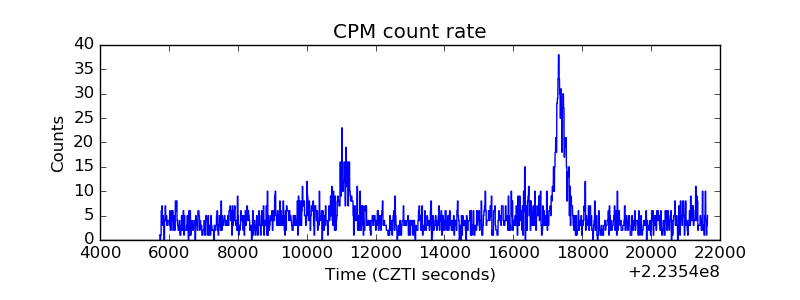 |
| CZT Counter | 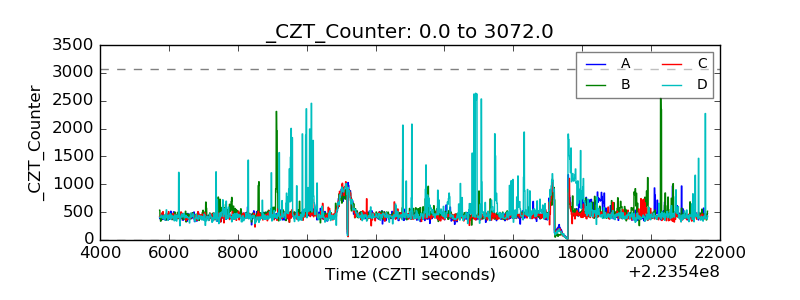 |
| +2.5 Volts monitor |  |
| +5 Volts monitor |  |
| _ROLL_ROT | 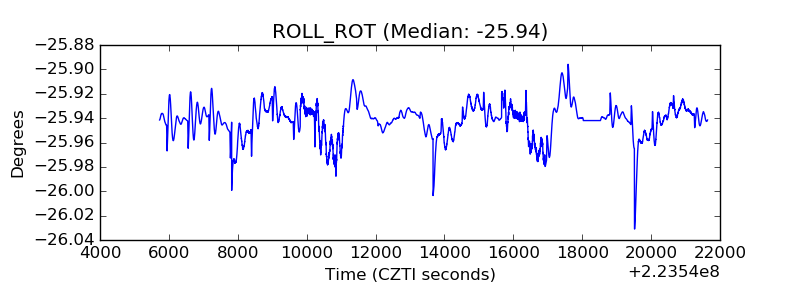 |
| _Roll_DEC | 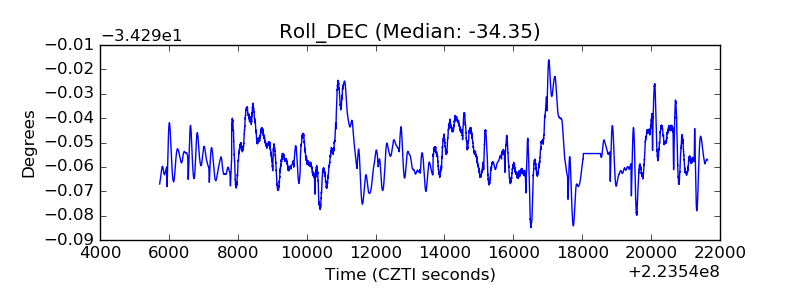 |
| _Roll_RA | 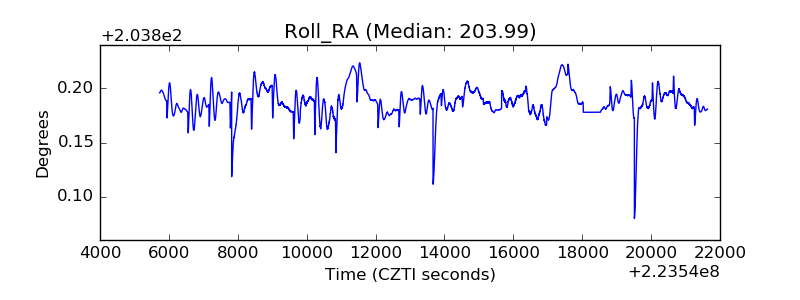 |
| Veto Counter | 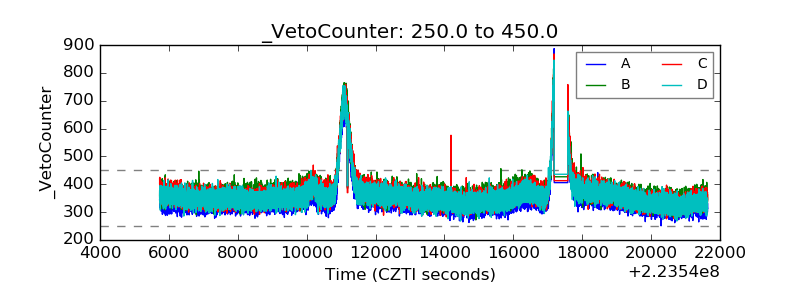 |