| Param | Original file | Final file |
|---|---|---|
| Filename | modeM0/AS1C02_016T01_9000000992cztM0_level2.fits | modeM0/AS1C02_016T01_9000000992cztM0_level2_quad_clean.evt |
| Size (bytes) | 66,237,120 | 49,550,400 |
| Size | 63.2 MB | 47.3 MB |
| Events in quadrant A | 390,086 | 256,457 |
| Events in quadrant B | 377,496 | 255,802 |
| Events in quadrant C | 385,500 | 239,965 |
| Events in quadrant D | 330,256 | 224,471 |
| Mode SS | |||
|---|---|---|---|
| Quadrant | BADHDUFLAG | Total packets | Discarded packets |
| A | 0 | 154 | 0 |
| B | 0 | 154 | 0 |
| C | 0 | 152 | 0 |
| D | 0 | 154 | 0 |
| Mode M9 | |||
|---|---|---|---|
| Quadrant | BADHDUFLAG | Total packets | Discarded packets |
| A | 1 | 140005276940328 | 140003048947758 |
| B | 1 | 140005276940328 | 140003048947758 |
| C | 1 | 140005276940328 | 140003048947758 |
| D | 1 | 140005276940328 | 140003048947758 |
| Mode M0 | |||
|---|---|---|---|
| Quadrant | BADHDUFLAG | Total packets | Discarded packets |
| A | 0 | 15354 | 0 |
| B | 0 | 16012 | 0 |
| C | 0 | 15172 | 0 |
| D | 0 | 17197 | 0 |
| Quadrant | Total seconds | Saturated seconds | Saturation percentage |
|---|---|---|---|
| A | 7513 | 74 | 0.984959% |
| B | 7513 | 85 | 1.131372% |
| C | 7520 | 44 | 0.585106% |
| D | 7492 | 88 | 1.174586% |
Noise dominated data is calculated using 1-second bins in cleaned event files. If a bin has >2000 counts, and if more than 50% of those come from <1% of pixels, then it is considered to be noise-dominated and hence unusable.
| Quadrant | # 1 sec bins | Bins with >0 counts | Bins with >2000 counts | High rate bins dominated by noise | Noise dominated (total time) | Noise dominated (detector-on time) | Marked lightcurve |
|---|---|---|---|---|---|---|---|
| A | 8131 | 7540 | 0 | 0 | 0.00% | 0.00% |  |
| B | 8130 | 7546 | 0 | 0 | 0.00% | 0.00% |  |
| C | 8131 | 7541 | 0 | 0 | 0.00% | 0.00% |  |
| D | 8100 | 7517 | 0 | 0 | 0.00% | 0.00% |  |
Top three noisy pixels from each quadrant. If the there are fewer than three noisy pixels in the level2.evt file, extra rows are filled as -1
| Pixel properties | Quadrant properties | ||||||
|---|---|---|---|---|---|---|---|
| Quadrant | DetID | PixID | Counts | Sigma | Mean | Median | Sigma |
| A | 14 | 188 | 406 | 11.14 | 101 | 94 | 28.0 |
| A | 0 | 29 | 363 | 9.61 | 101 | 94 | 28.0 |
| A | 14 | 204 | 345 | 8.96 | 101 | 94 | 28.0 |
| B | 2 | 9 | 327 | 10.27 | 99 | 94 | 22.7 |
| B | 14 | 254 | 285 | 8.42 | 99 | 94 | 22.7 |
| B | 12 | 226 | 281 | 8.24 | 99 | 94 | 22.7 |
| C | 12 | 241 | 297 | 6.99 | 101 | 94 | 29.1 |
| C | 3 | 158 | 265 | 5.88 | 101 | 94 | 29.1 |
| C | 7 | 111 | 260 | 5.71 | 101 | 94 | 29.1 |
| D | 4 | 246 | 278 | 7.18 | 94 | 85 | 26.9 |
| D | 1 | 31 | 253 | 6.25 | 94 | 85 | 26.9 |
| D | 11 | 82 | 236 | 5.61 | 94 | 85 | 26.9 |
Histogram calculated using DETX and DETY for each event in the final _common_clean file
| Quadrant A |  |
 |
Quadrant B |
|---|---|---|---|
| Quadrant D |  |
 |
Quadrant C |
| Plot type | Count rate plots | Images |
|---|---|---|
| Comparison with Poisson distribution Blue bars denote a histogram of data divided into 1 sec bins. Red curve is a Poisson curve with rate = median count rate of data. |
 |
 |
| Quadrant-wise count rates Data is divided into 100 sec bins |
 |
|
| Module-wise count rates for Quadrant A Data is divided into 100 sec bins |
 |
 |
| Module-wise count rates for Quadrant B Data is divided into 100 sec bins |
 |
 |
| Module-wise count rates for Quadrant C Data is divided into 100 sec bins |
 |
 |
| Module-wise count rates for Quadrant D Data is divided into 100 sec bins |
 |
 |
| Parameter | Plot |
|---|---|
| CZT HV Monitor |  |
| D_VDD |  |
| Temperature 1 |  |
| Veto HV Monitor |  |
| Veto LLD |  |
| Alpha Counter |  |
| _CPM_Rate |  |
| CZT Counter |  |
| +2.5 Volts monitor |  |
| +5 Volts monitor |  |
| _ROLL_ROT | 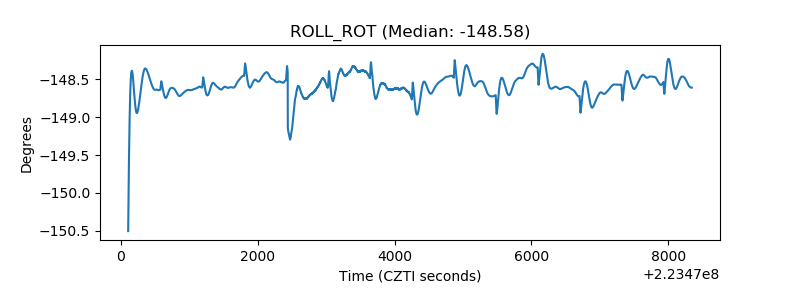 |
| _Roll_DEC |  |
| _Roll_RA |  |
| Veto Counter |  |