| Param | Original file | Final file |
|---|---|---|
| Filename | modeM0/AS1G06_154T03_9000000996cztM0_level2.fits | modeM0/AS1G06_154T03_9000000996cztM0_level2_quad_clean.evt |
| Size (bytes) | 542,563,200 | 527,025,600 |
| Size | 517.4 MB | 502.6 MB |
| Events in quadrant A | 3,248,982 | 3,099,904 |
| Events in quadrant B | 3,179,804 | 3,135,582 |
| Events in quadrant C | 3,248,450 | 3,002,475 |
| Events in quadrant D | 2,778,550 | 2,747,318 |
| Mode M0 | |||
|---|---|---|---|
| Quadrant | BADHDUFLAG | Total packets | Discarded packets |
| A | 0 | 121749 | 0 |
| B | 0 | 123161 | 0 |
| C | 0 | 119949 | 0 |
| D | 0 | 132850 | 0 |
| Mode SS | |||
|---|---|---|---|
| Quadrant | BADHDUFLAG | Total packets | Discarded packets |
| A | 0 | 1180 | 0 |
| B | 0 | 1180 | 0 |
| C | 0 | 1180 | 0 |
| D | 0 | 1180 | 0 |
| Mode M9 | |||
|---|---|---|---|
| Quadrant | BADHDUFLAG | Total packets | Discarded packets |
| A | 0 | 104 | 0 |
| B | 0 | 104 | 0 |
| C | 0 | 104 | 0 |
| D | 0 | 104 | 0 |
| Quadrant | Total seconds | Saturated seconds | Saturation percentage |
|---|---|---|---|
| A | 57950 | 696 | 1.201035% |
| B | 57950 | 814 | 1.404659% |
| C | 57950 | 427 | 0.736842% |
| D | 57950 | 1282 | 2.212252% |
Noise dominated data is calculated using 1-second bins in cleaned event files. If a bin has >2000 counts, and if more than 50% of those come from <1% of pixels, then it is considered to be noise-dominated and hence unusable.
| Quadrant | # 1 sec bins | Bins with >0 counts | Bins with >2000 counts | High rate bins dominated by noise | Noise dominated (total time) | Noise dominated (detector-on time) | Marked lightcurve |
|---|---|---|---|---|---|---|---|
| A | 68402 | 57940 | 0 | 0 | 0.00% | 0.00% |  |
| B | 68402 | 57945 | 0 | 0 | 0.00% | 0.00% |  |
| C | 68402 | 57947 | 0 | 0 | 0.00% | 0.00% |  |
| D | 68402 | 57907 | 0 | 0 | 0.00% | 0.00% |  |
Top three noisy pixels from each quadrant. If the there are fewer than three noisy pixels in the level2.evt file, extra rows are filled as -1
| Pixel properties | Quadrant properties | ||||||
|---|---|---|---|---|---|---|---|
| Quadrant | DetID | PixID | Counts | Sigma | Mean | Median | Sigma |
| A | 0 | 29 | 3163 | 11.06 | 844 | 785 | 215.1 |
| A | 7 | 110 | 2769 | 9.23 | 844 | 785 | 215.1 |
| A | 0 | 30 | 2498 | 7.97 | 844 | 785 | 215.1 |
| B | 2 | 9 | 2760 | 11.67 | 837 | 794 | 168.4 |
| B | 5 | 225 | 2123 | 7.89 | 837 | 794 | 168.4 |
| B | 5 | 128 | 2122 | 7.89 | 837 | 794 | 168.4 |
| C | 1 | 81 | 2403 | 7.11 | 856 | 790 | 226.9 |
| C | 1 | 80 | 2356 | 6.9 | 856 | 790 | 226.9 |
| C | 12 | 241 | 2219 | 6.3 | 856 | 790 | 226.9 |
| D | 6 | 231 | 2086 | 6.32 | 791 | 716 | 216.8 |
| D | 3 | 14 | 2032 | 6.07 | 791 | 716 | 216.8 |
| D | 11 | 82 | 1995 | 5.9 | 791 | 716 | 216.8 |
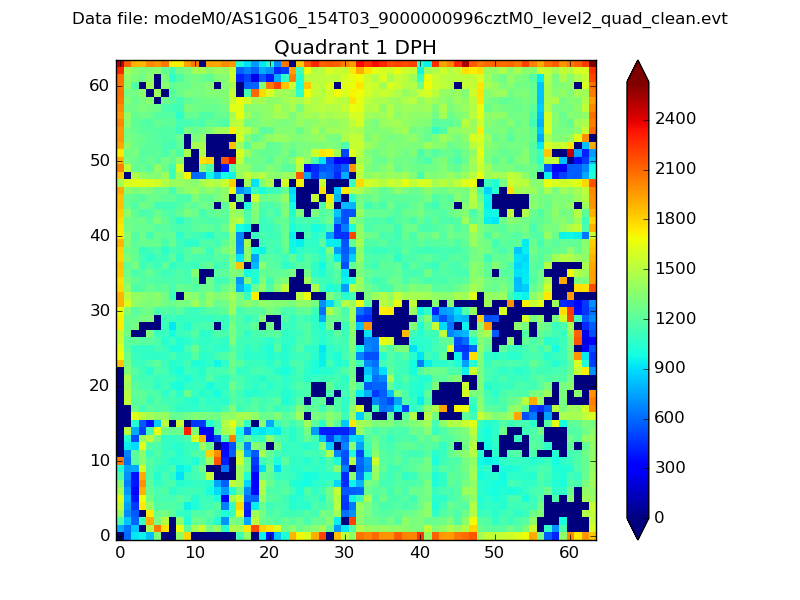
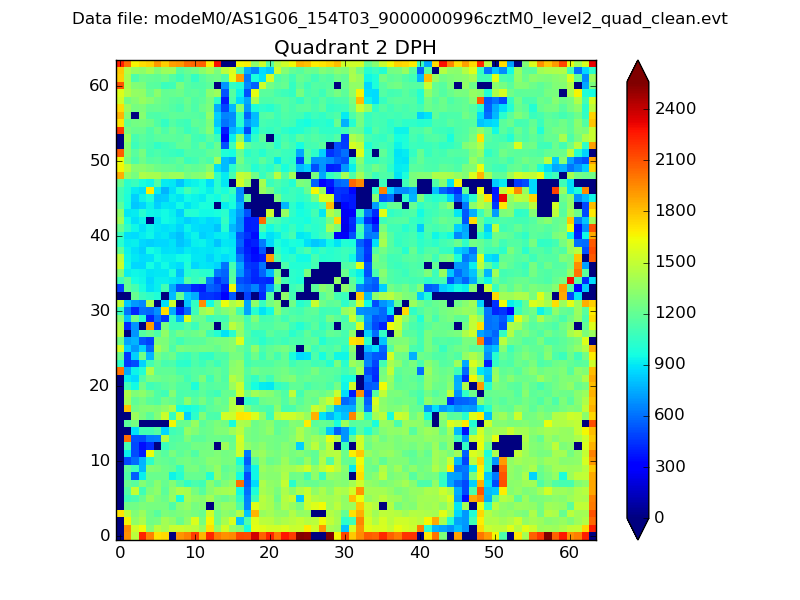
Histogram calculated using DETX and DETY for each event in the final _common_clean file
| Quadrant A |  |
 |
Quadrant B |
|---|---|---|---|
| Quadrant D |  |
 |
Quadrant C |
| Plot type | Count rate plots | Images |
|---|---|---|
| Comparison with Poisson distribution Blue bars denote a histogram of data divided into 1 sec bins. Red curve is a Poisson curve with rate = median count rate of data. |
 |
 |
| Quadrant-wise count rates Data is divided into 100 sec bins |
 |
|
| Module-wise count rates for Quadrant A Data is divided into 100 sec bins |
 |
 |
| Module-wise count rates for Quadrant B Data is divided into 100 sec bins |
 |
 |
| Module-wise count rates for Quadrant C Data is divided into 100 sec bins |
 |
 |
| Module-wise count rates for Quadrant D Data is divided into 100 sec bins |
 |
 |
| Parameter | Plot |
|---|---|
| CZT HV Monitor |  |
| D_VDD |  |
| Temperature 1 |  |
| Veto HV Monitor |  |
| Veto LLD |  |
| Alpha Counter |  |
| _CPM_Rate | 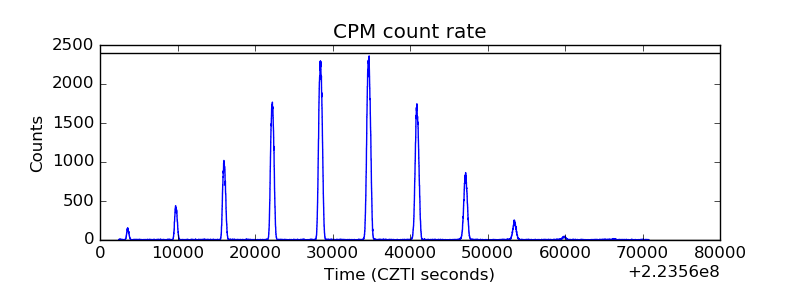 |
| CZT Counter |  |
| +2.5 Volts monitor |  |
| +5 Volts monitor |  |
| _ROLL_ROT |  |
| _Roll_DEC |  |
| _Roll_RA | 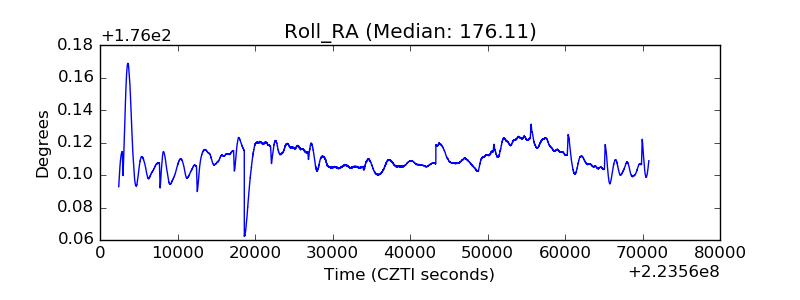 |
| Veto Counter |  |