| Param | Original file | Final file |
|---|---|---|
| Filename | modeM0/AS1G06_154T03_9000000996_07274cztM0_level2.evt | modeM0/AS1G06_154T03_9000000996_07274cztM0_level2_quad_clean.evt |
| Size (bytes) | 269,265,600 | 42,333,120 |
| Size | 256.8 MB | 40.4 MB |
| Events in quadrant A | 2,019,386 | 248,860 |
| Events in quadrant B | 1,951,247 | 252,409 |
| Events in quadrant C | 1,934,521 | 250,689 |
| Events in quadrant D | 1,971,512 | 242,601 |
| Mode M0 | |||
|---|---|---|---|
| Quadrant | BADHDUFLAG | Total packets | Discarded packets |
| A | 0 | 8603 | 1 |
| B | 0 | 8461 | 0 |
| C | 0 | 8530 | 0 |
| D | 0 | 8760 | 0 |
| Mode SS | |||
|---|---|---|---|
| Quadrant | BADHDUFLAG | Total packets | Discarded packets |
| A | 0 | 82 | 0 |
| B | 0 | 82 | 0 |
| C | 0 | 82 | 0 |
| D | 0 | 82 | 0 |
| Mode M9 | |||
|---|---|---|---|
| Quadrant | BADHDUFLAG | Total packets | Discarded packets |
| A | 0 | 6 | 0 |
| B | 0 | 6 | 0 |
| C | 0 | 6 | 0 |
| D | 0 | 6 | 0 |
| Quadrant | Total seconds | Saturated seconds | Saturation percentage |
|---|---|---|---|
| A | 4072 | 61 | 1.498035% |
| B | 4072 | 68 | 1.669941% |
| C | 4072 | 59 | 1.448919% |
| D | 4072 | 61 | 1.498035% |
Noise dominated data is calculated using 1-second bins in cleaned event files. If a bin has >2000 counts, and if more than 50% of those come from <1% of pixels, then it is considered to be noise-dominated and hence unusable.
| Quadrant | # 1 sec bins | Bins with >0 counts | Bins with >2000 counts | High rate bins dominated by noise | Noise dominated (total time) | Noise dominated (detector-on time) | Marked lightcurve |
|---|---|---|---|---|---|---|---|
| A | 4662 | 4072 | 1 | 1 | 0.02% | 0.02% | 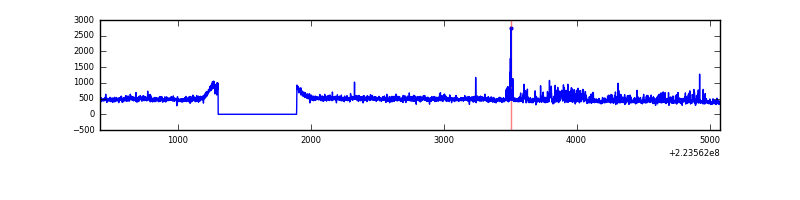 |
| B | 4662 | 4072 | 0 | 0 | 0.00% | 0.00% |  |
| C | 4662 | 4072 | 2 | 2 | 0.04% | 0.05% | 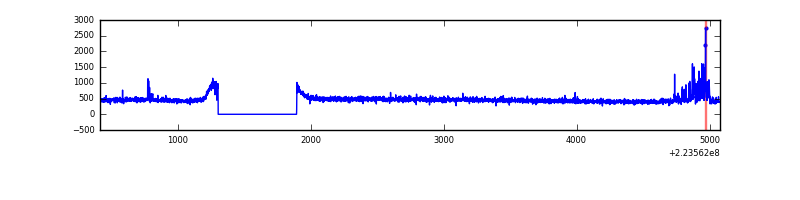 |
| D | 4662 | 4072 | 2 | 2 | 0.04% | 0.05% | 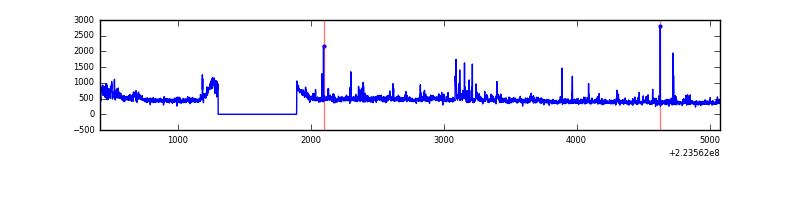 |
Top three noisy pixels from each quadrant. If the there are fewer than three noisy pixels in the level2.evt file, extra rows are filled as -1
| Pixel properties | Quadrant properties | ||||||
|---|---|---|---|---|---|---|---|
| Quadrant | DetID | PixID | Counts | Sigma | Mean | Median | Sigma |
| A | 8 | 15 | 142740 | 1404.09 | 486 | 474 | 101.3 |
| A | 0 | 226 | 4572 | 40.45 | 486 | 474 | 101.3 |
| A | 12 | 194 | 4407 | 38.82 | 486 | 474 | 101.3 |
| B | 0 | 214 | 20583 | 206.49 | 490 | 477 | 97.4 |
| B | 12 | 111 | 9835 | 96.11 | 490 | 477 | 97.4 |
| B | 11 | 111 | 8109 | 78.38 | 490 | 477 | 97.4 |
| C | 7 | 247 | 82171 | 725.63 | 474 | 475 | 112.6 |
| C | 14 | 67 | 3877 | 30.22 | 474 | 475 | 112.6 |
| C | 13 | 61 | 3595 | 27.71 | 474 | 475 | 112.6 |
| D | 1 | 52 | 76828 | 644.64 | 476 | 460 | 118.5 |
| D | 2 | 216 | 28233 | 234.44 | 476 | 460 | 118.5 |
| D | 12 | 110 | 24154 | 200.01 | 476 | 460 | 118.5 |
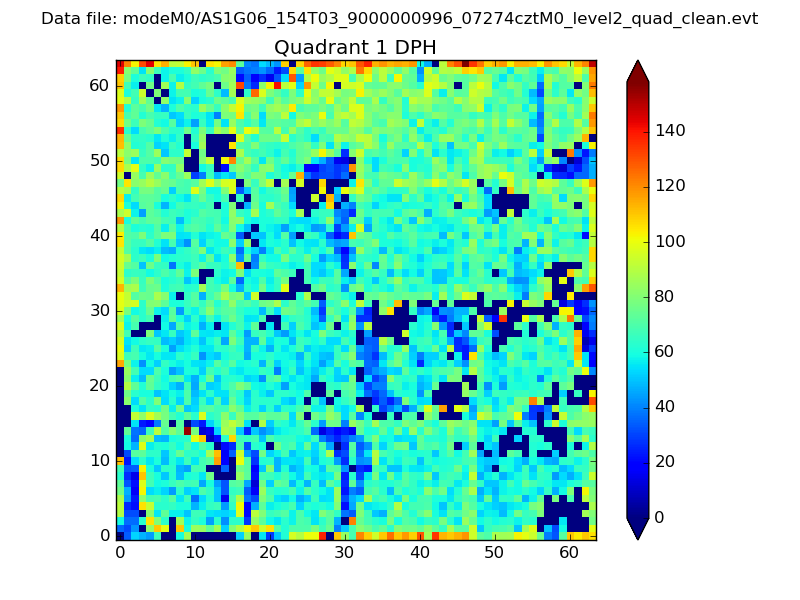
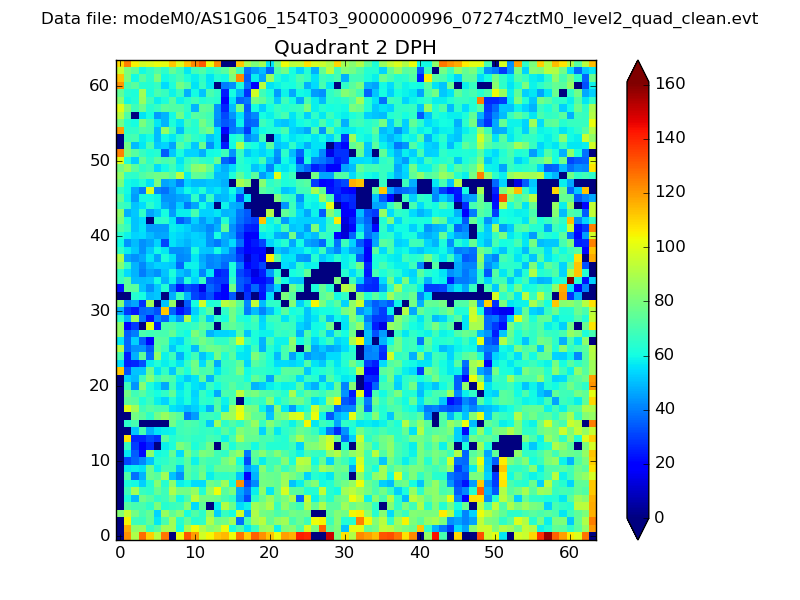
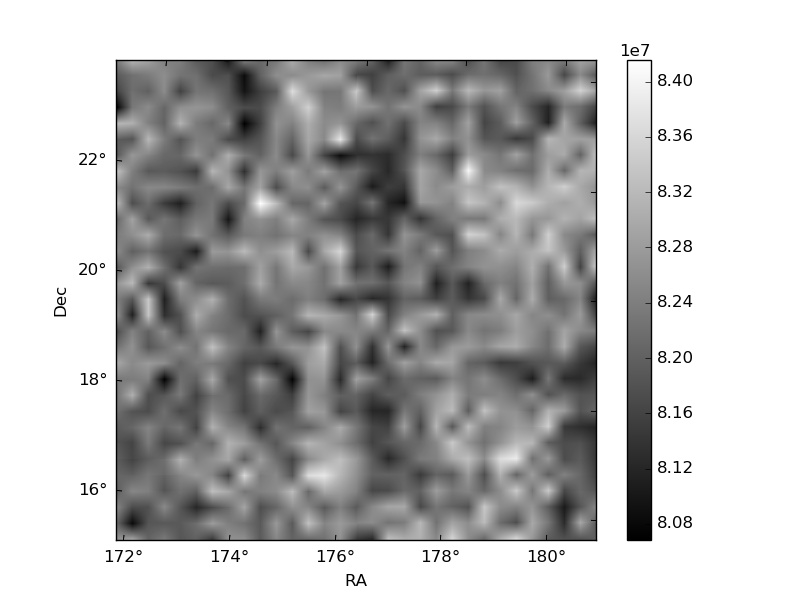
Histogram calculated using DETX and DETY for each event in the final _common_clean file
| Quadrant A | 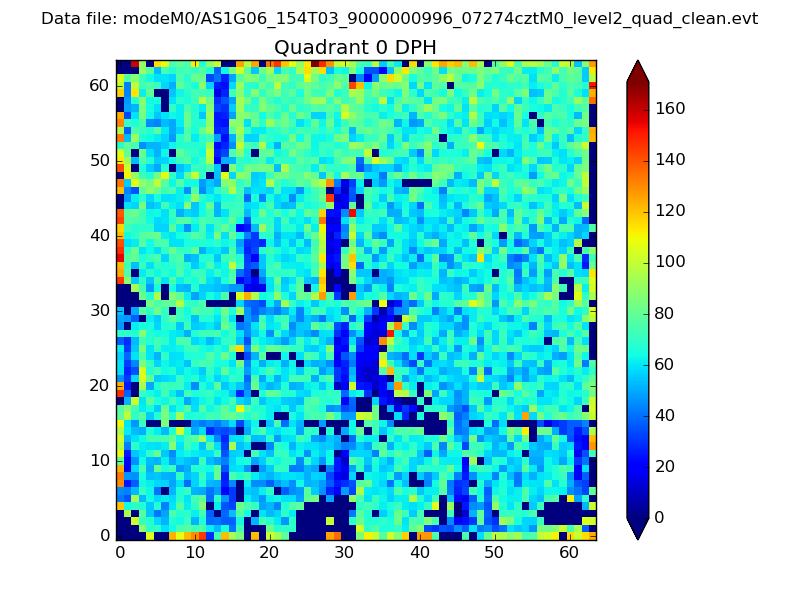 |
 |
Quadrant B |
|---|---|---|---|
| Quadrant D | 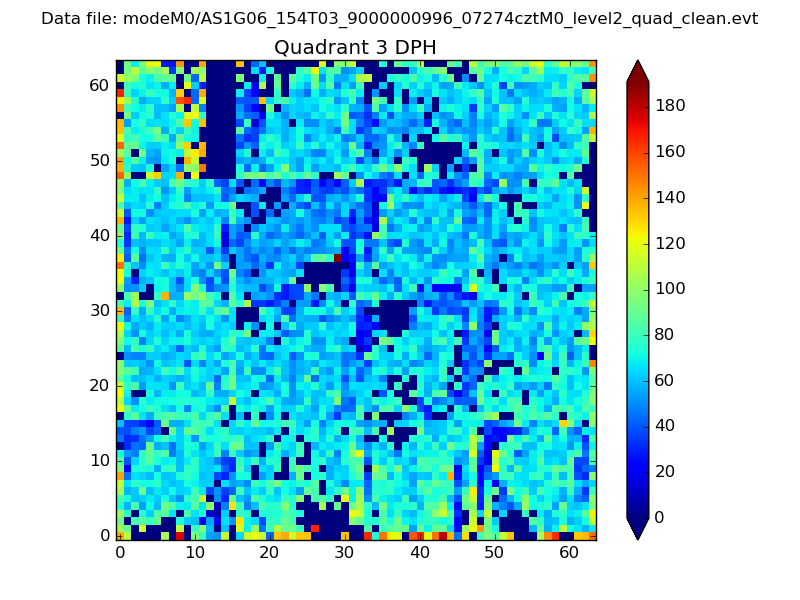 |
 |
Quadrant C |
| Plot type | Count rate plots | Images |
|---|---|---|
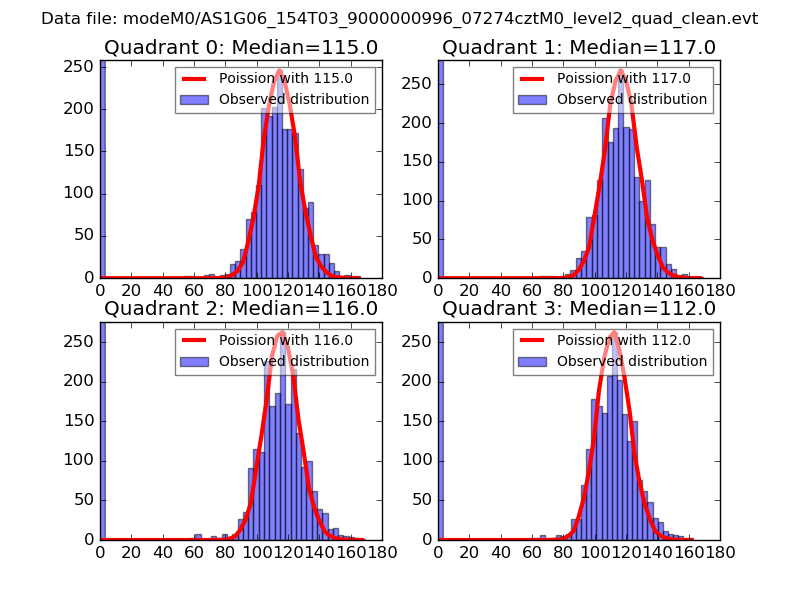
| Comparison with Poisson distribution Blue bars denote a histogram of data divided into 1 sec bins. Red curve is a Poisson curve with rate = median count rate of data. |
 |
 |
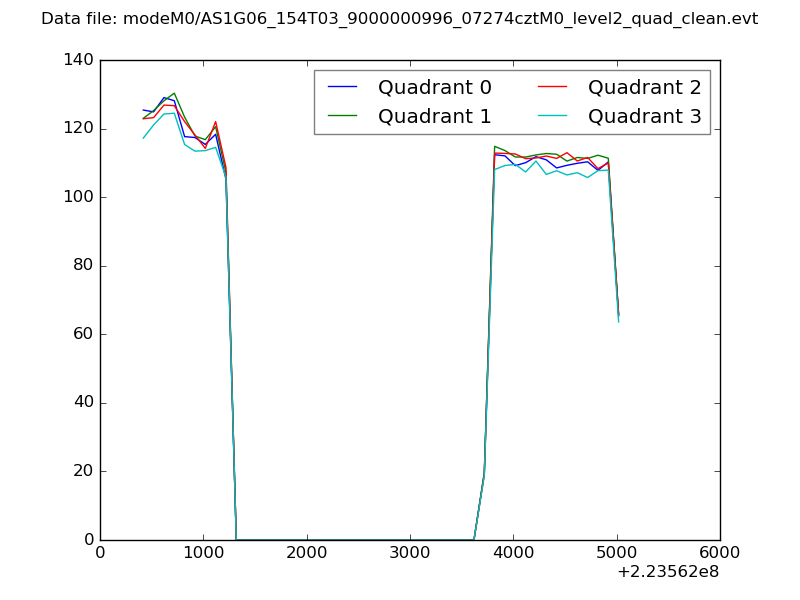
| Quadrant-wise count rates Data is divided into 100 sec bins |
 |
|
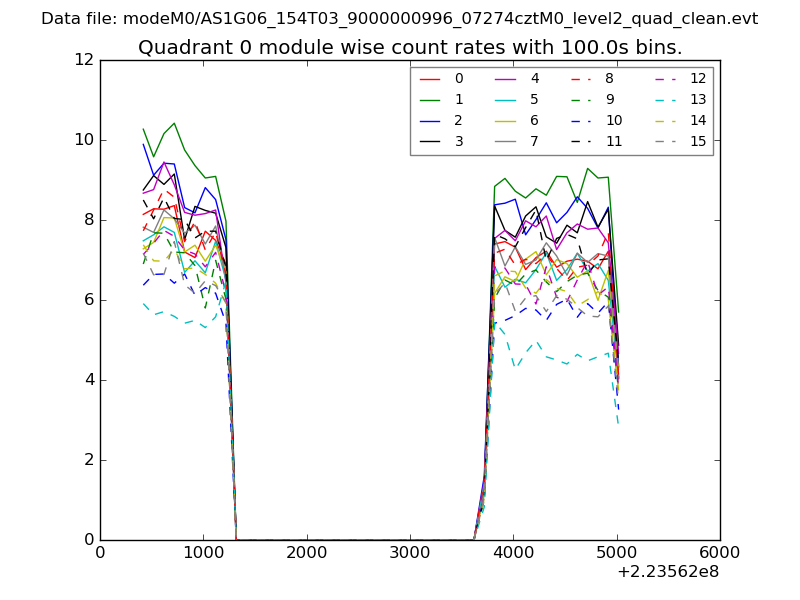
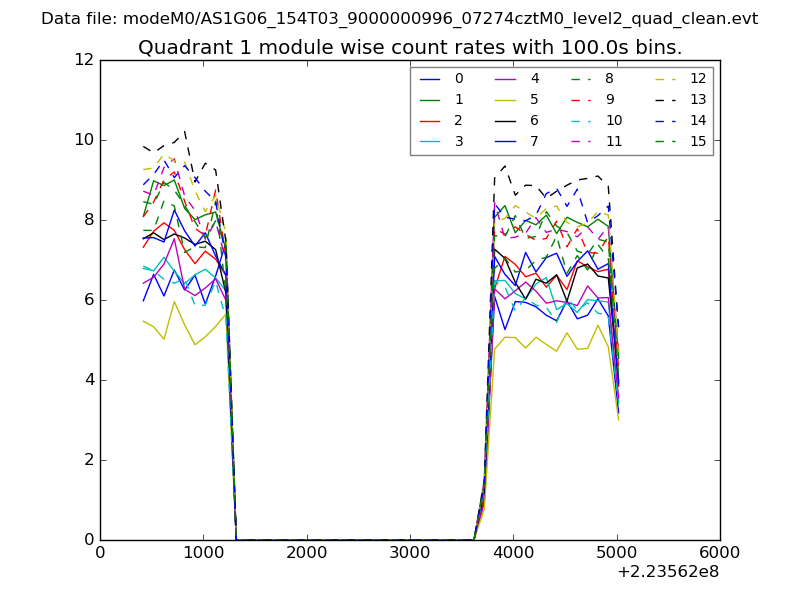
| Module-wise count rates for Quadrant A Data is divided into 100 sec bins |
 |
 |
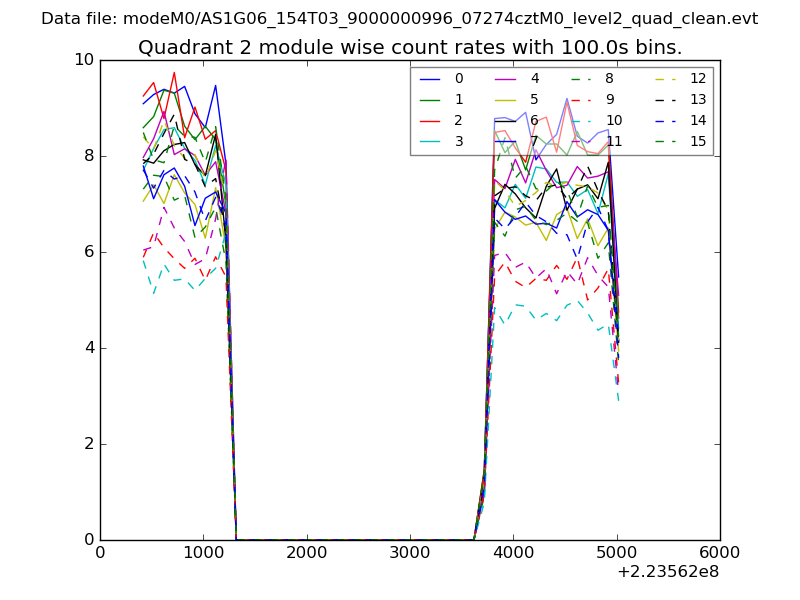
| Module-wise count rates for Quadrant B Data is divided into 100 sec bins |
 |
 |
| Module-wise count rates for Quadrant C Data is divided into 100 sec bins |
 |
 |
| Module-wise count rates for Quadrant D Data is divided into 100 sec bins |
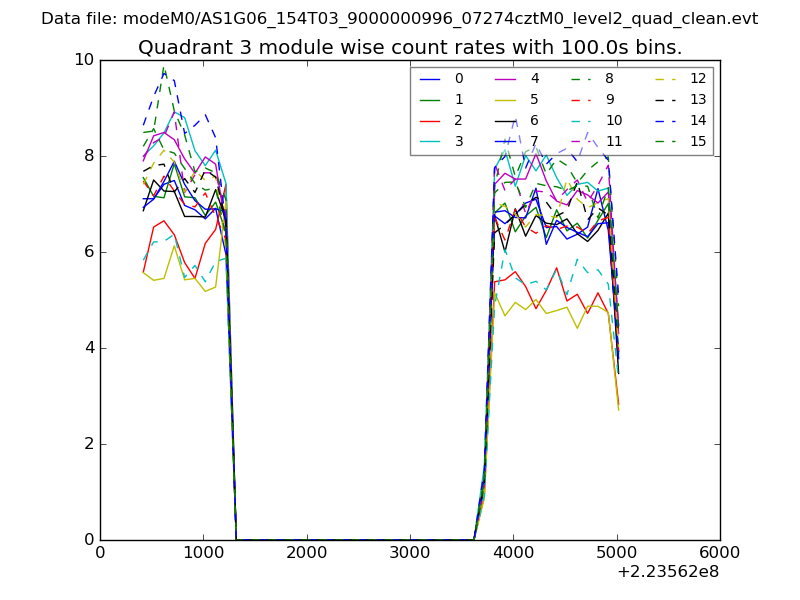 |
 |
| Parameter | Plot |
|---|---|
| CZT HV Monitor | 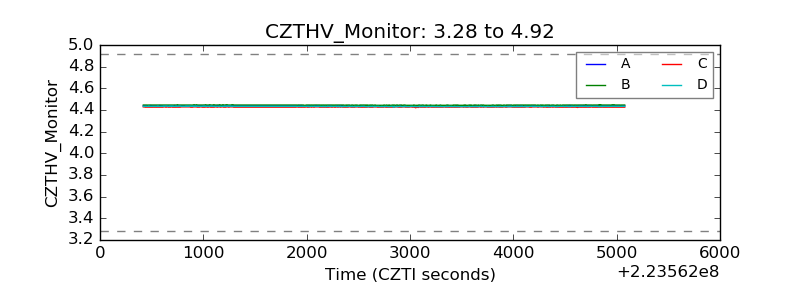 |
| D_VDD | 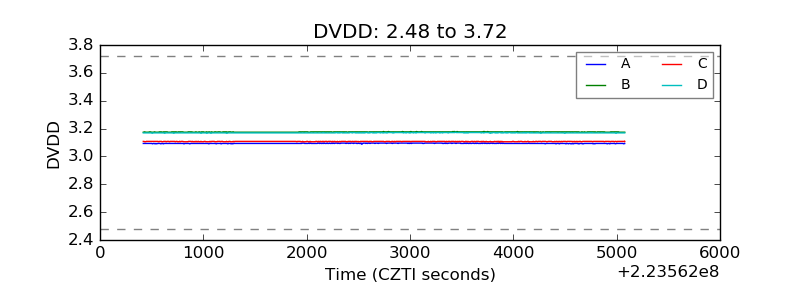 |
| Temperature 1 | 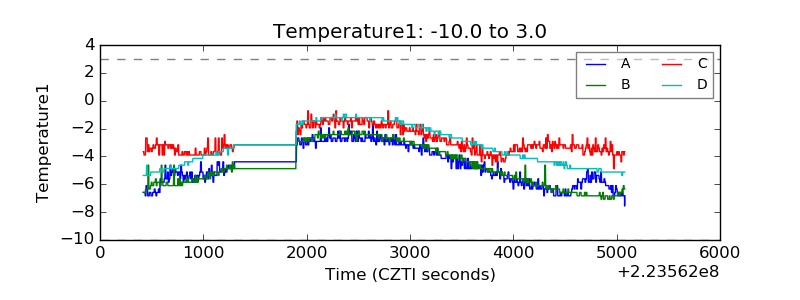 |
| Veto HV Monitor | 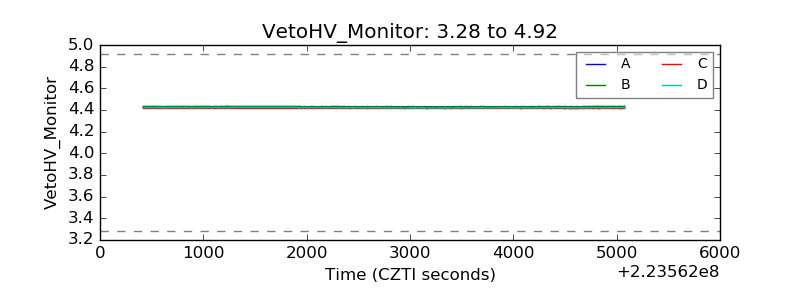 |
| Veto LLD | 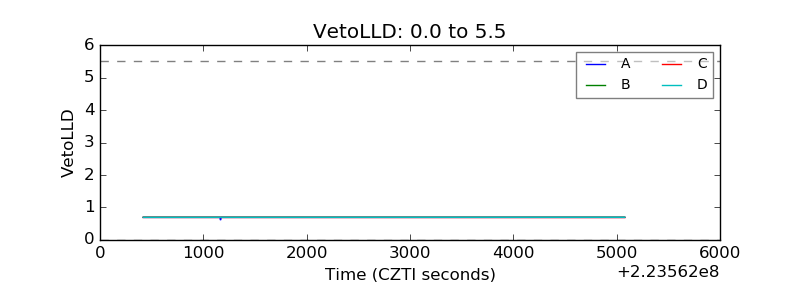 |
| Alpha Counter | 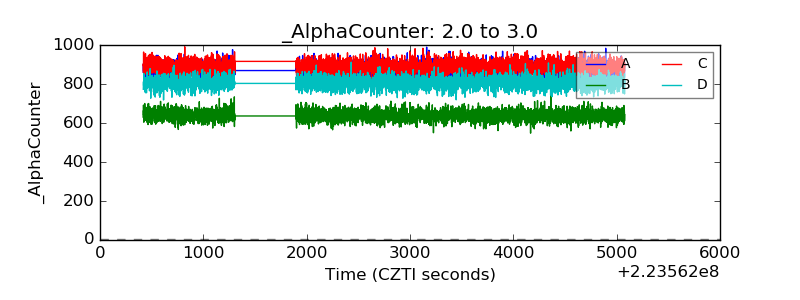 |
| _CPM_Rate | 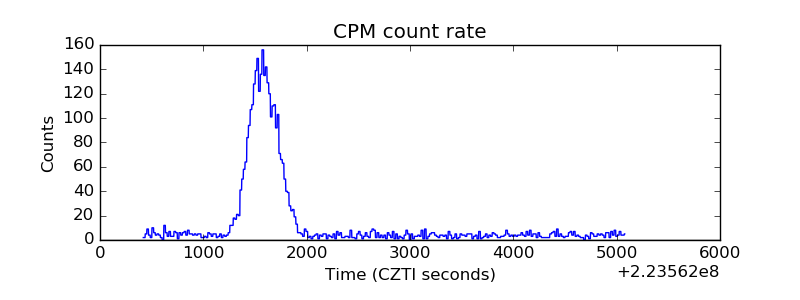 |
| CZT Counter | 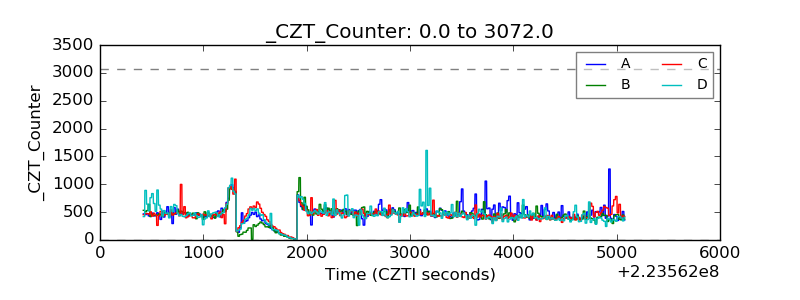 |
| +2.5 Volts monitor | 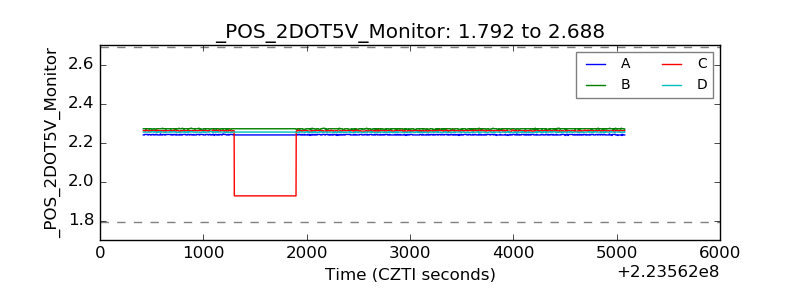 |
| +5 Volts monitor | 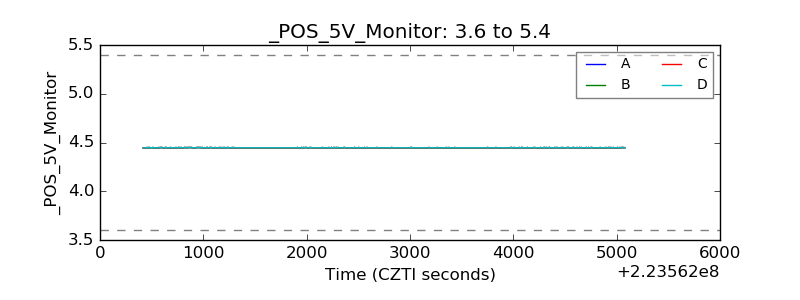 |
| _ROLL_ROT | 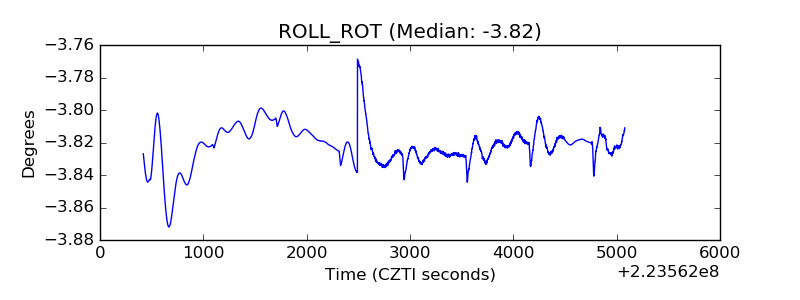 |
| _Roll_DEC | 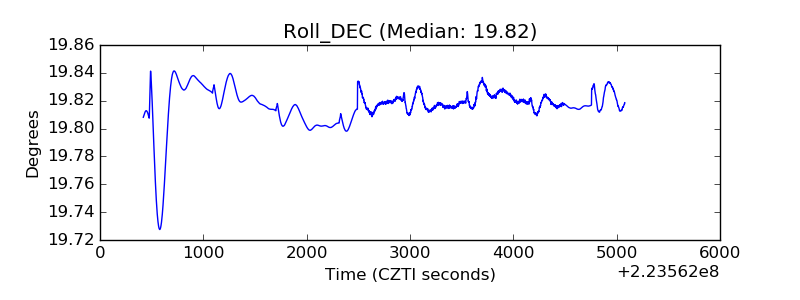 |
| _Roll_RA |  |
| Veto Counter | 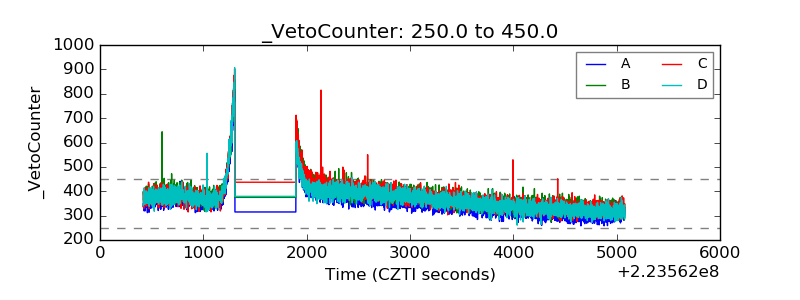 |