| Param | Original file | Final file |
|---|---|---|
| Filename | modeM0/AS1G06_154T03_9000000996_07275cztM0_level2.evt | modeM0/AS1G06_154T03_9000000996_07275cztM0_level2_quad_clean.evt |
| Size (bytes) | 659,214,720 | 137,646,720 |
| Size | 628.7 MB | 131.3 MB |
| Events in quadrant A | 4,990,128 | 866,918 |
| Events in quadrant B | 4,907,190 | 876,299 |
| Events in quadrant C | 4,673,071 | 872,402 |
| Events in quadrant D | 4,697,404 | 842,065 |
| Mode M0 | |||
|---|---|---|---|
| Quadrant | BADHDUFLAG | Total packets | Discarded packets |
| A | 0 | 21770 | 3 |
| B | 0 | 21664 | 2 |
| C | 0 | 21121 | 2 |
| D | 0 | 21530 | 2 |
| Mode SS | |||
|---|---|---|---|
| Quadrant | BADHDUFLAG | Total packets | Discarded packets |
| A | 0 | 208 | 0 |
| B | 0 | 208 | 0 |
| C | 0 | 208 | 0 |
| D | 0 | 208 | 0 |
| Mode M9 | |||
|---|---|---|---|
| Quadrant | BADHDUFLAG | Total packets | Discarded packets |
| A | 0 | 18 | 0 |
| B | 0 | 18 | 0 |
| C | 0 | 18 | 0 |
| D | 0 | 18 | 0 |
| Quadrant | Total seconds | Saturated seconds | Saturation percentage |
|---|---|---|---|
| A | 10271 | 85 | 0.827573% |
| B | 10271 | 100 | 0.973615% |
| C | 10271 | 59 | 0.574433% |
| D | 10271 | 83 | 0.808100% |
Noise dominated data is calculated using 1-second bins in cleaned event files. If a bin has >2000 counts, and if more than 50% of those come from <1% of pixels, then it is considered to be noise-dominated and hence unusable.
| Quadrant | # 1 sec bins | Bins with >0 counts | Bins with >2000 counts | High rate bins dominated by noise | Noise dominated (total time) | Noise dominated (detector-on time) | Marked lightcurve |
|---|---|---|---|---|---|---|---|
| A | 12031 | 10271 | 5 | 5 | 0.04% | 0.05% | 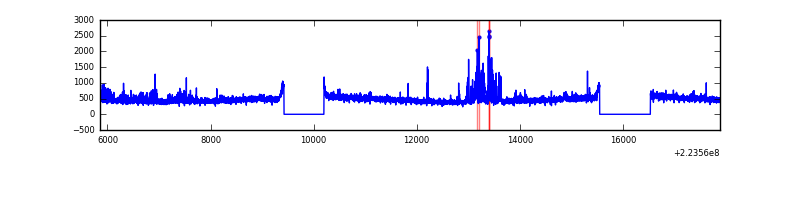 |
| B | 12031 | 10271 | 15 | 15 | 0.12% | 0.15% | 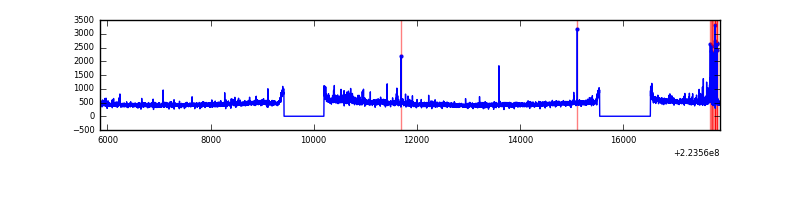 |
| C | 12031 | 10271 | 2 | 2 | 0.02% | 0.02% | 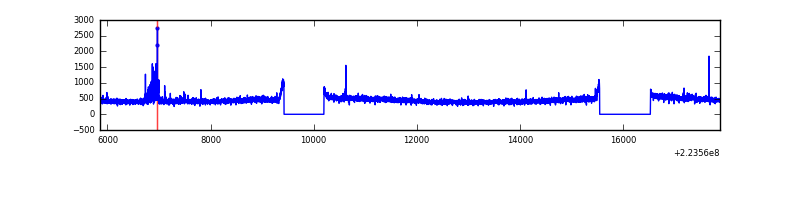 |
| D | 12031 | 10271 | 12 | 12 | 0.10% | 0.12% | 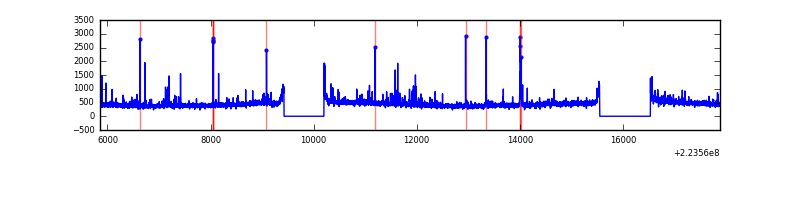 |
Top three noisy pixels from each quadrant. If the there are fewer than three noisy pixels in the level2.evt file, extra rows are filled as -1
| Pixel properties | Quadrant properties | ||||||
|---|---|---|---|---|---|---|---|
| Quadrant | DetID | PixID | Counts | Sigma | Mean | Median | Sigma |
| A | 8 | 15 | 365253 | 1488.36 | 1196 | 1169 | 244.6 |
| A | 0 | 23 | 14039 | 52.61 | 1196 | 1169 | 244.6 |
| A | 0 | 226 | 12168 | 44.96 | 1196 | 1169 | 244.6 |
| B | 0 | 228 | 73584 | 312.49 | 1205 | 1175 | 231.7 |
| B | 0 | 214 | 70437 | 298.91 | 1205 | 1175 | 231.7 |
| B | 4 | 81 | 29527 | 122.36 | 1205 | 1175 | 231.7 |
| C | 7 | 247 | 91825 | 332.14 | 1170 | 1176 | 272.9 |
| C | 9 | 68 | 12512 | 41.54 | 1170 | 1176 | 272.9 |
| C | 13 | 61 | 9103 | 29.04 | 1170 | 1176 | 272.9 |
| D | 2 | 216 | 64601 | 218.58 | 1169 | 1134 | 290.4 |
| D | 1 | 52 | 60328 | 203.86 | 1169 | 1134 | 290.4 |
| D | 2 | 14 | 59903 | 202.4 | 1169 | 1134 | 290.4 |
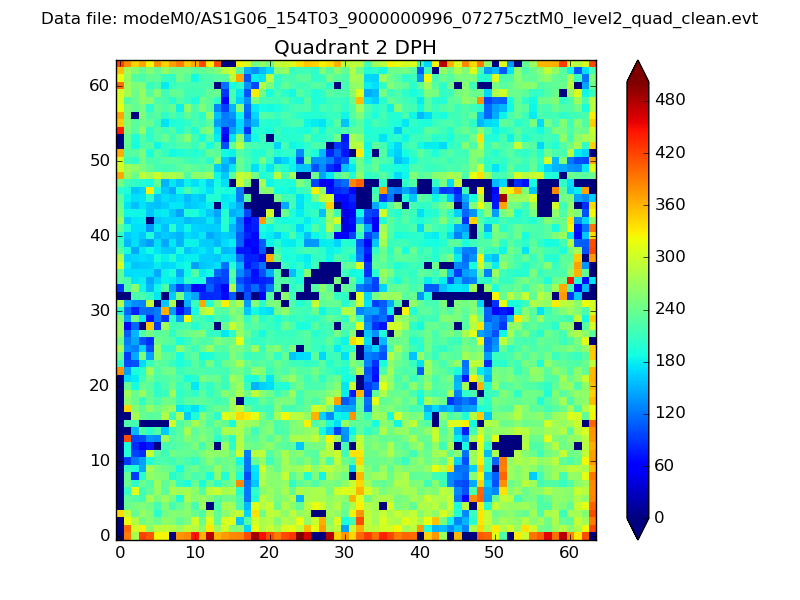
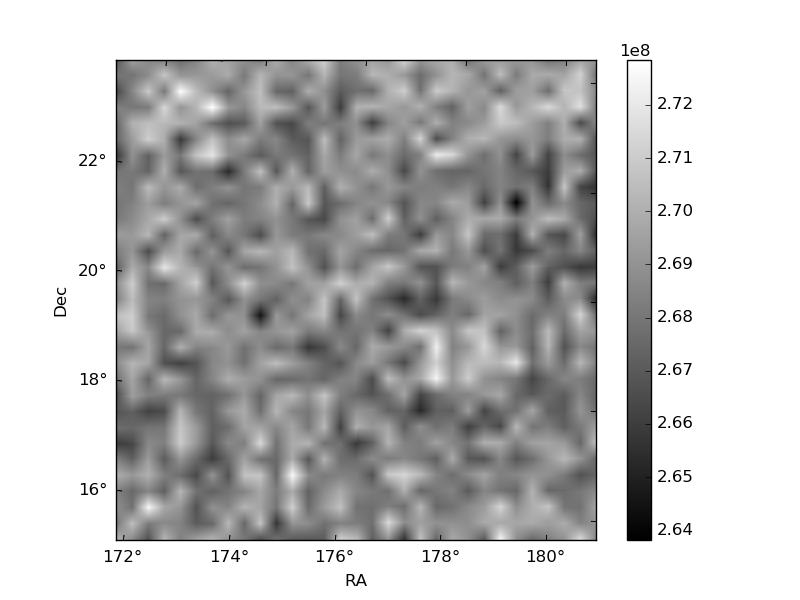
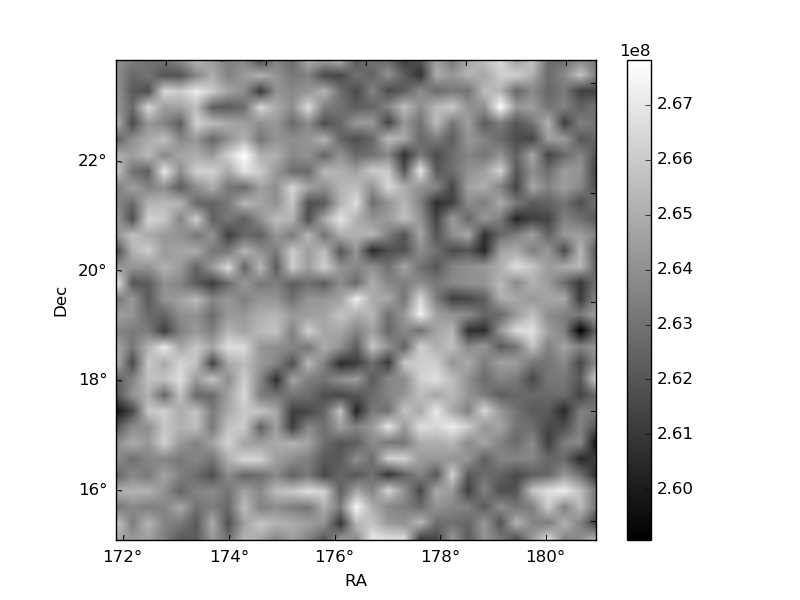
Histogram calculated using DETX and DETY for each event in the final _common_clean file
| Quadrant A | 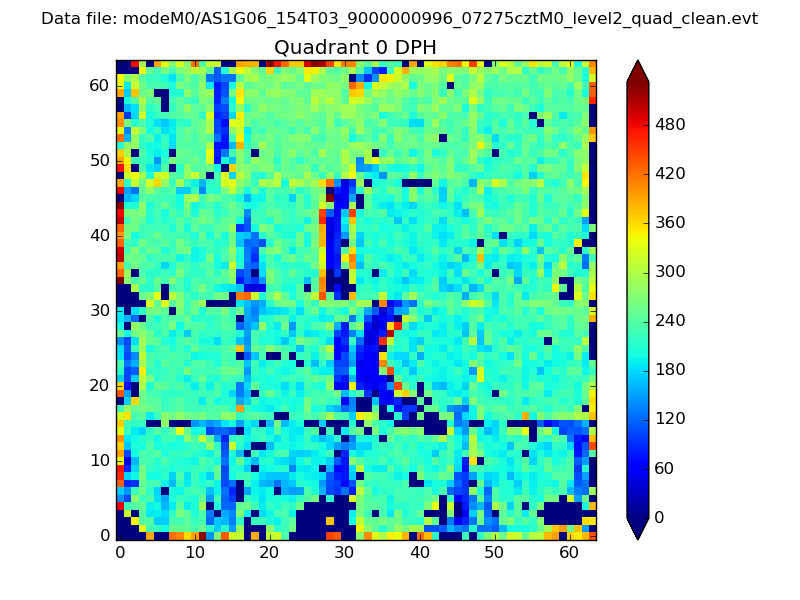 |
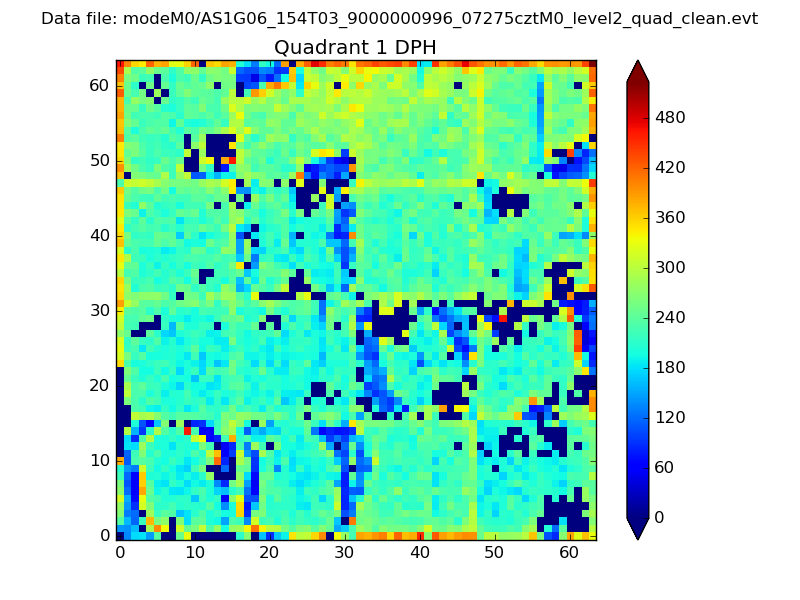 |
Quadrant B |
|---|---|---|---|
| Quadrant D | 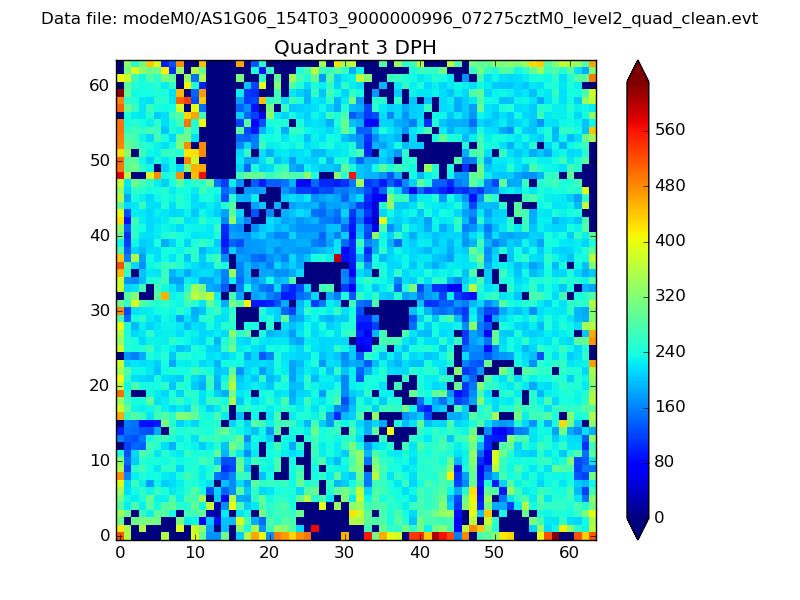 |
 |
Quadrant C |
| Plot type | Count rate plots | Images |
|---|---|---|
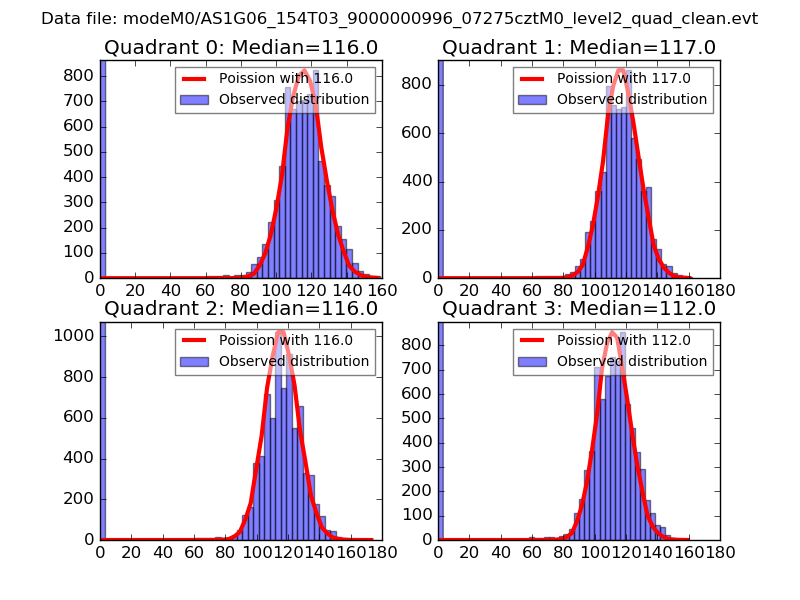
| Comparison with Poisson distribution Blue bars denote a histogram of data divided into 1 sec bins. Red curve is a Poisson curve with rate = median count rate of data. |
 |
 |
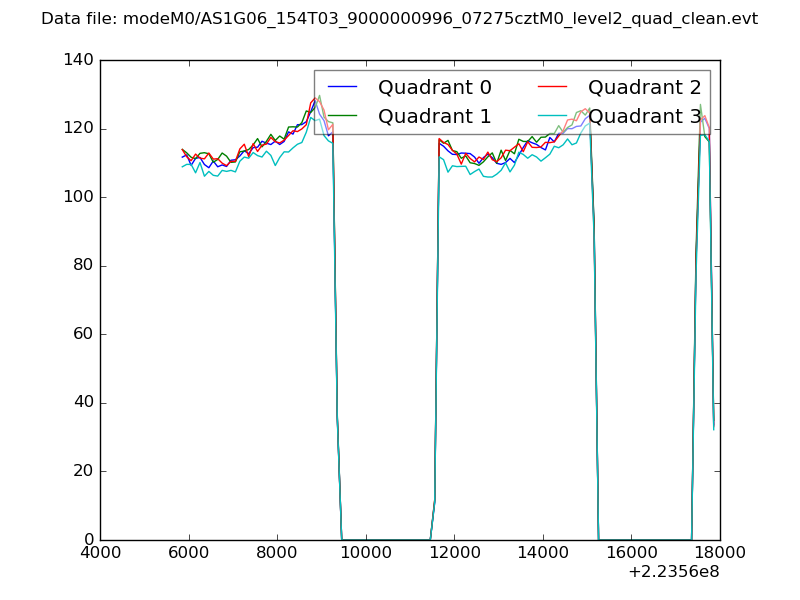
| Quadrant-wise count rates Data is divided into 100 sec bins |
 |
|
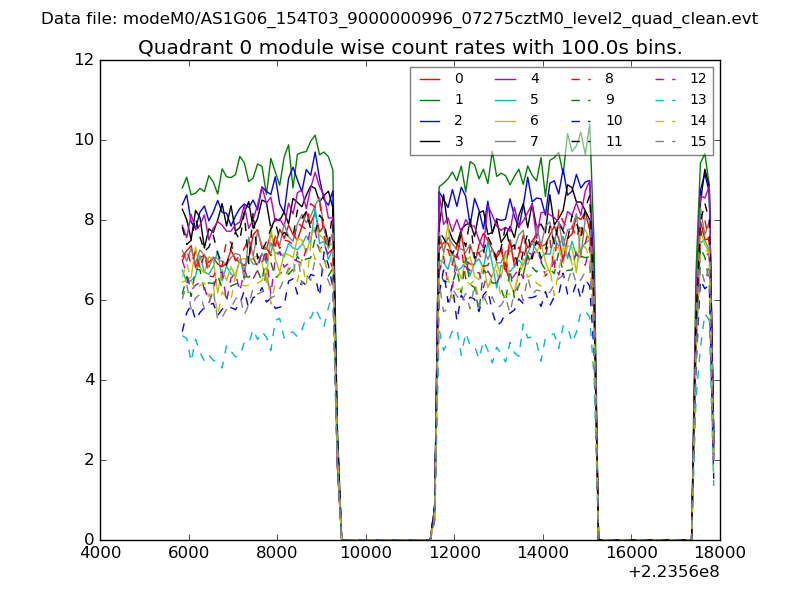
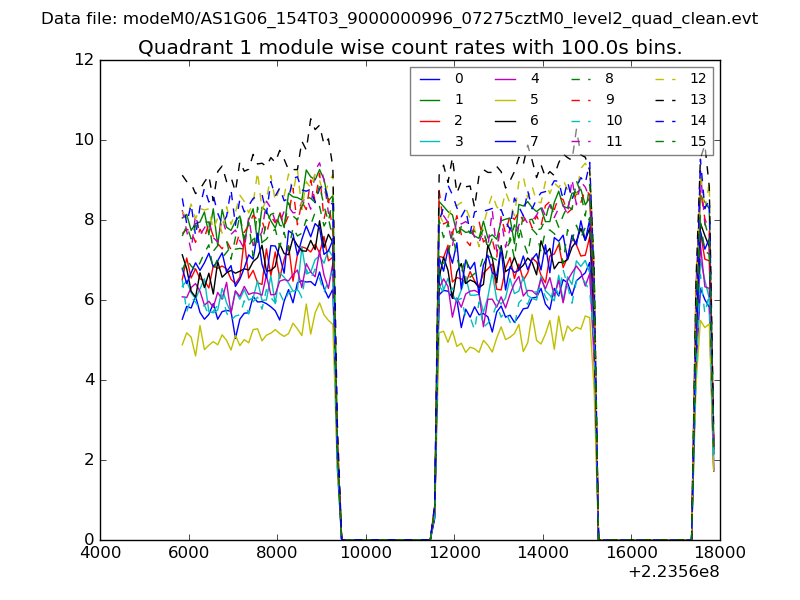
| Module-wise count rates for Quadrant A Data is divided into 100 sec bins |
 |
 |
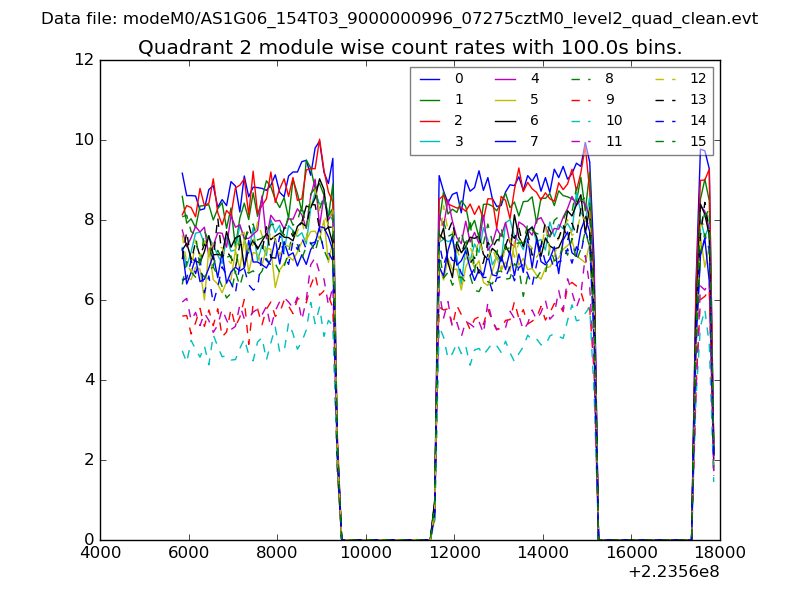
| Module-wise count rates for Quadrant B Data is divided into 100 sec bins |
 |
 |
| Module-wise count rates for Quadrant C Data is divided into 100 sec bins |
 |
 |
| Module-wise count rates for Quadrant D Data is divided into 100 sec bins |
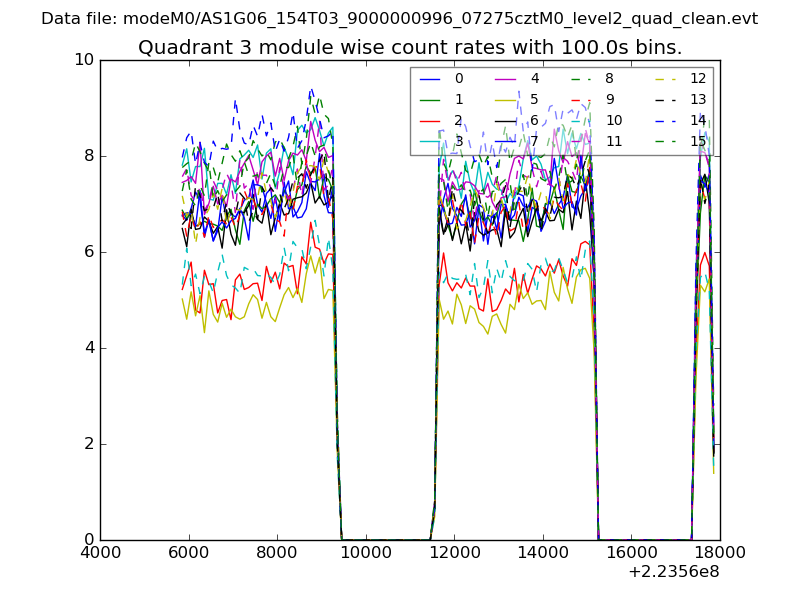 |
 |
| Parameter | Plot |
|---|---|
| CZT HV Monitor | 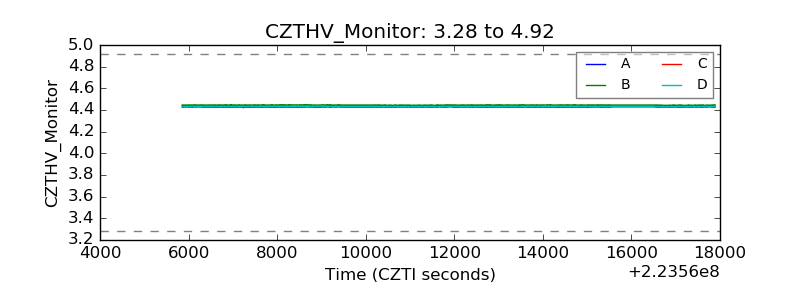 |
| D_VDD | 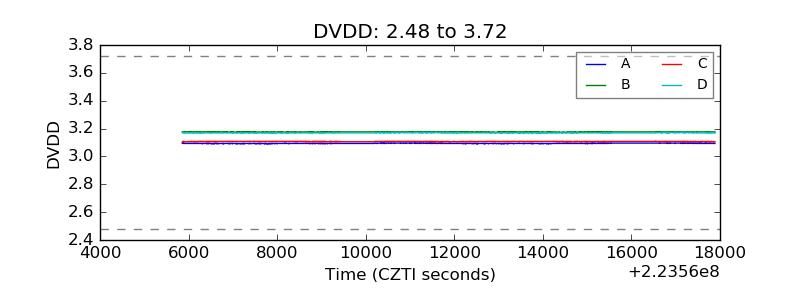 |
| Temperature 1 | 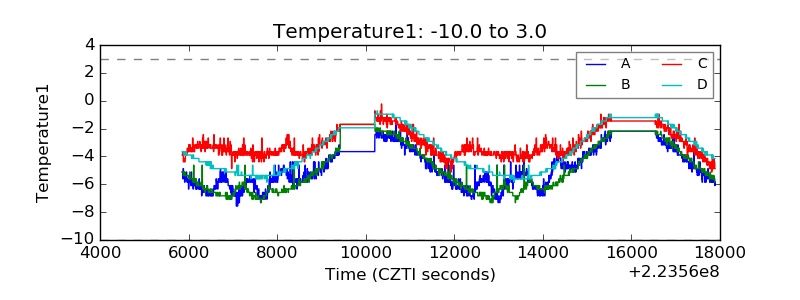 |
| Veto HV Monitor | 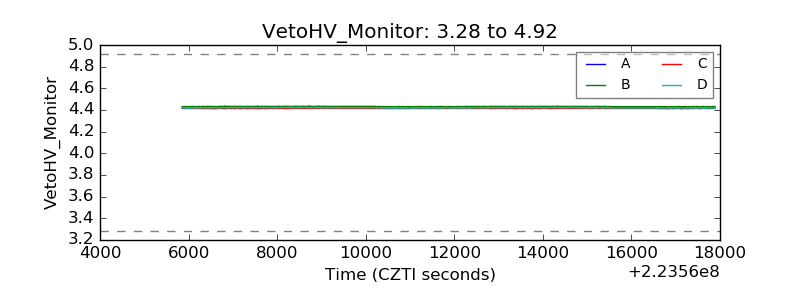 |
| Veto LLD | 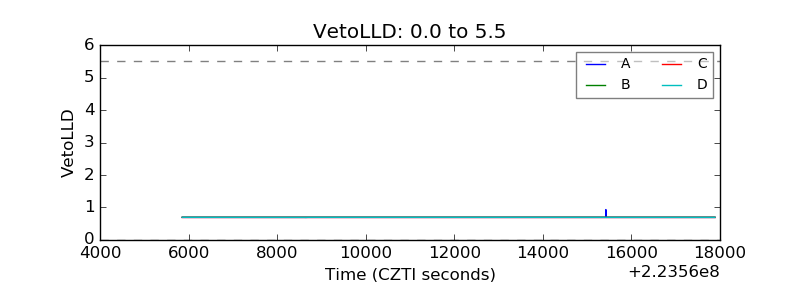 |
| Alpha Counter | 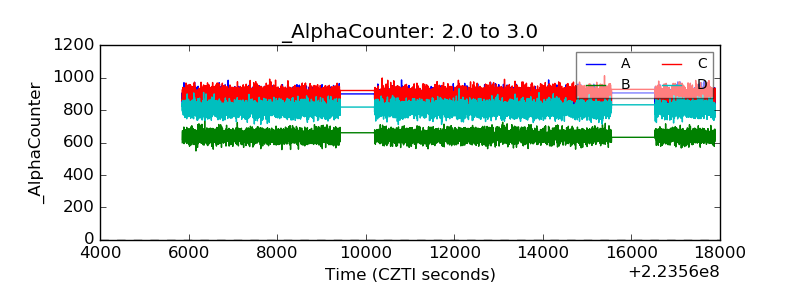 |
| _CPM_Rate | 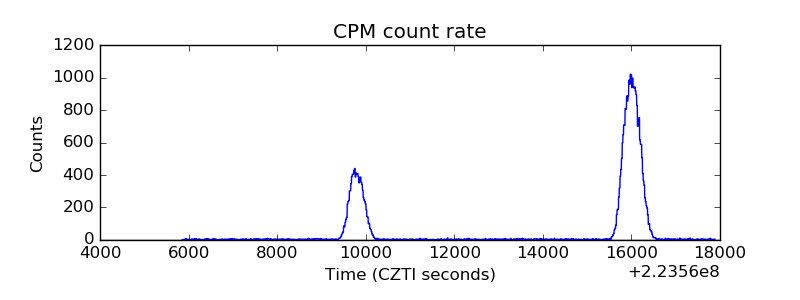 |
| CZT Counter | 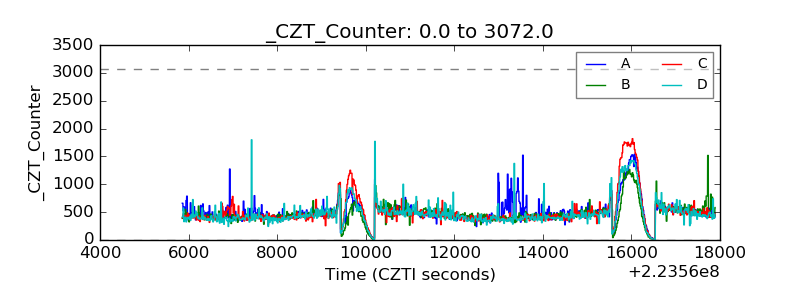 |
| +2.5 Volts monitor | 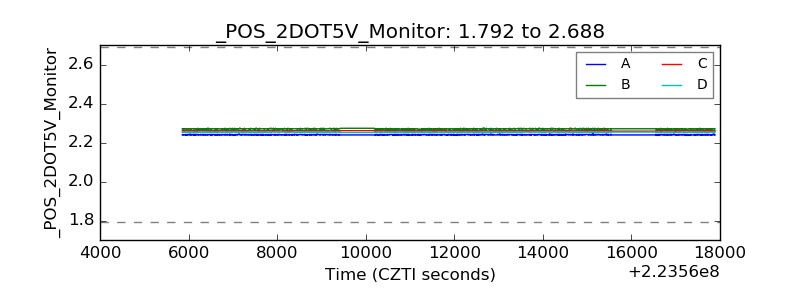 |
| +5 Volts monitor | 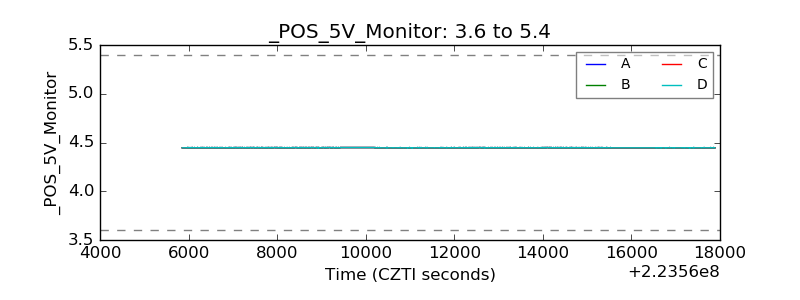 |
| _ROLL_ROT | 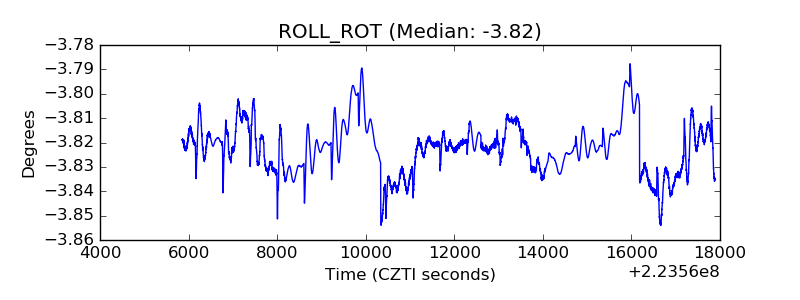 |
| _Roll_DEC | 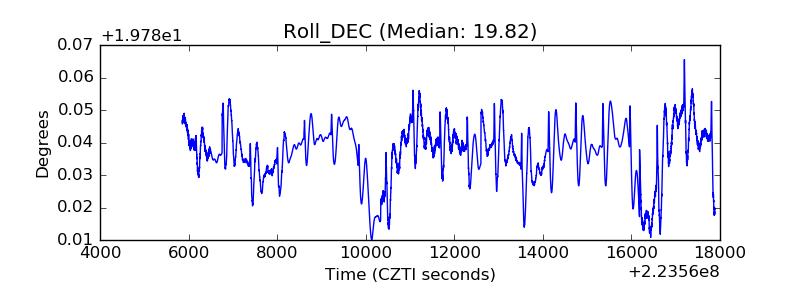 |
| _Roll_RA | 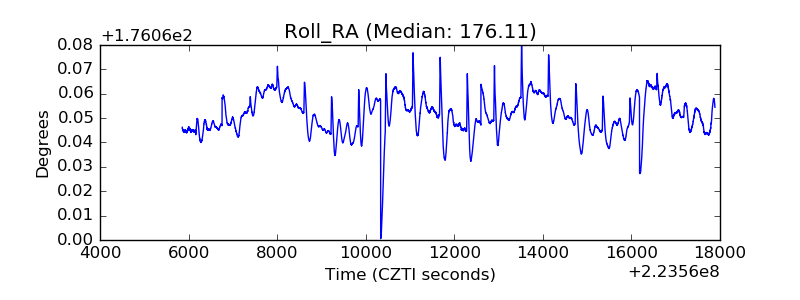 |
| Veto Counter | 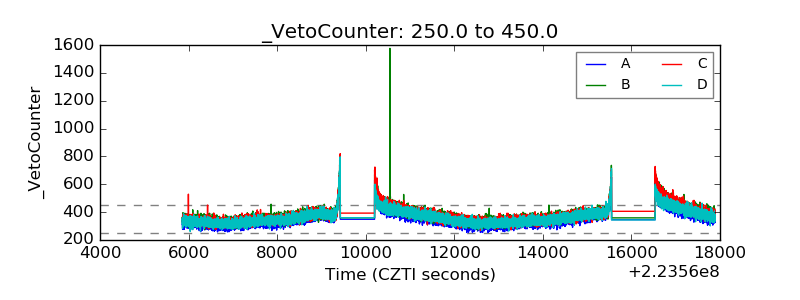 |