| Param | Original file | Final file |
|---|---|---|
| Filename | modeM0/AS1G06_154T03_9000000996_07278cztM0_level2.evt | modeM0/AS1G06_154T03_9000000996_07278cztM0_level2_quad_clean.evt |
| Size (bytes) | 435,579,840 | 91,877,760 |
| Size | 415.4 MB | 87.6 MB |
| Events in quadrant A | 3,045,568 | 586,996 |
| Events in quadrant B | 3,227,881 | 605,704 |
| Events in quadrant C | 3,195,461 | 590,840 |
| Events in quadrant D | 3,298,326 | 563,132 |
| Mode M0 | |||
|---|---|---|---|
| Quadrant | BADHDUFLAG | Total packets | Discarded packets |
| A | 0 | 13338 | 3 |
| B | 0 | 13892 | 2 |
| C | 0 | 13401 | 2 |
| D | 0 | 14199 | 2 |
| Mode SS | |||
|---|---|---|---|
| Quadrant | BADHDUFLAG | Total packets | Discarded packets |
| A | 0 | 126 | 0 |
| B | 0 | 126 | 0 |
| C | 0 | 126 | 0 |
| D | 0 | 126 | 0 |
| Mode M9 | |||
|---|---|---|---|
| Quadrant | BADHDUFLAG | Total packets | Discarded packets |
| A | 0 | 23 | 0 |
| B | 0 | 23 | 0 |
| C | 0 | 23 | 0 |
| D | 0 | 23 | 0 |
| Quadrant | Total seconds | Saturated seconds | Saturation percentage |
|---|---|---|---|
| A | 6247 | 24 | 0.384184% |
| B | 6247 | 41 | 0.656315% |
| C | 6247 | 10 | 0.160077% |
| D | 6247 | 47 | 0.752361% |
Noise dominated data is calculated using 1-second bins in cleaned event files. If a bin has >2000 counts, and if more than 50% of those come from <1% of pixels, then it is considered to be noise-dominated and hence unusable.
| Quadrant | # 1 sec bins | Bins with >0 counts | Bins with >2000 counts | High rate bins dominated by noise | Noise dominated (total time) | Noise dominated (detector-on time) | Marked lightcurve |
|---|---|---|---|---|---|---|---|
| A | 7477 | 6248 | 0 | 0 | 0.00% | 0.00% | 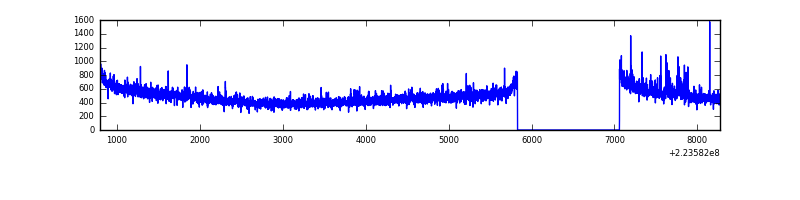 |
| B | 7477 | 6248 | 8 | 8 | 0.11% | 0.13% | 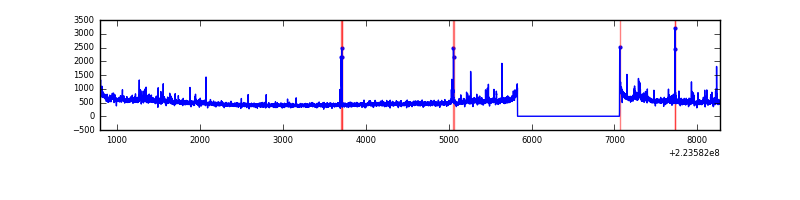 |
| C | 7477 | 6248 | 3 | 3 | 0.04% | 0.05% | 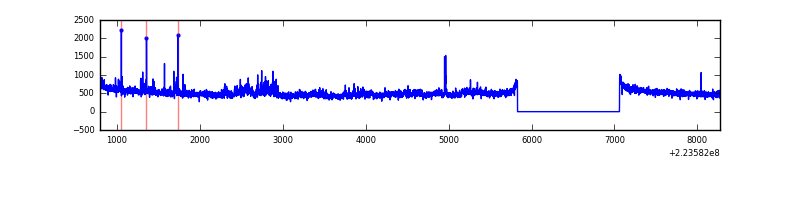 |
| D | 7477 | 6248 | 14 | 14 | 0.19% | 0.22% | 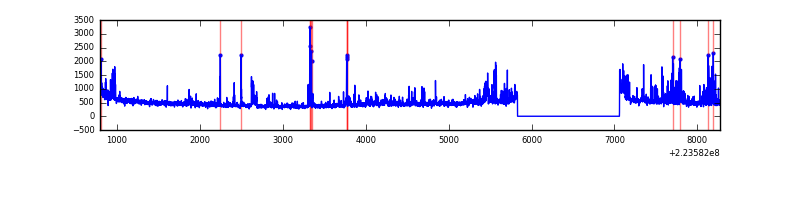 |
Top three noisy pixels from each quadrant. If the there are fewer than three noisy pixels in the level2.evt file, extra rows are filled as -1
| Pixel properties | Quadrant properties | ||||||
|---|---|---|---|---|---|---|---|
| Quadrant | DetID | PixID | Counts | Sigma | Mean | Median | Sigma |
| A | 8 | 15 | 109847 | 698.22 | 762 | 746 | 156.3 |
| A | 0 | 226 | 7322 | 42.08 | 762 | 746 | 156.3 |
| A | 12 | 194 | 6881 | 39.26 | 762 | 746 | 156.3 |
| B | 0 | 214 | 87298 | 585.57 | 775 | 757 | 147.8 |
| B | 4 | 81 | 61460 | 410.74 | 775 | 757 | 147.8 |
| B | 0 | 228 | 22470 | 146.92 | 775 | 757 | 147.8 |
| C | 7 | 247 | 118864 | 678.99 | 748 | 753 | 174.0 |
| C | 14 | 67 | 118280 | 675.63 | 748 | 753 | 174.0 |
| C | 1 | 16 | 29536 | 165.47 | 748 | 753 | 174.0 |
| D | 2 | 216 | 280748 | 1545.13 | 739 | 718 | 181.2 |
| D | 2 | 14 | 73362 | 400.83 | 739 | 718 | 181.2 |
| D | 2 | 33 | 55975 | 304.89 | 739 | 718 | 181.2 |
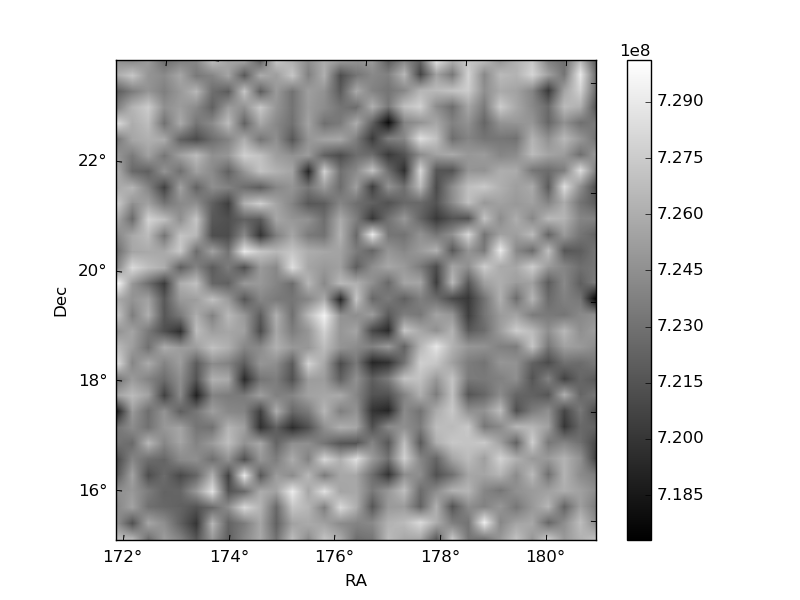
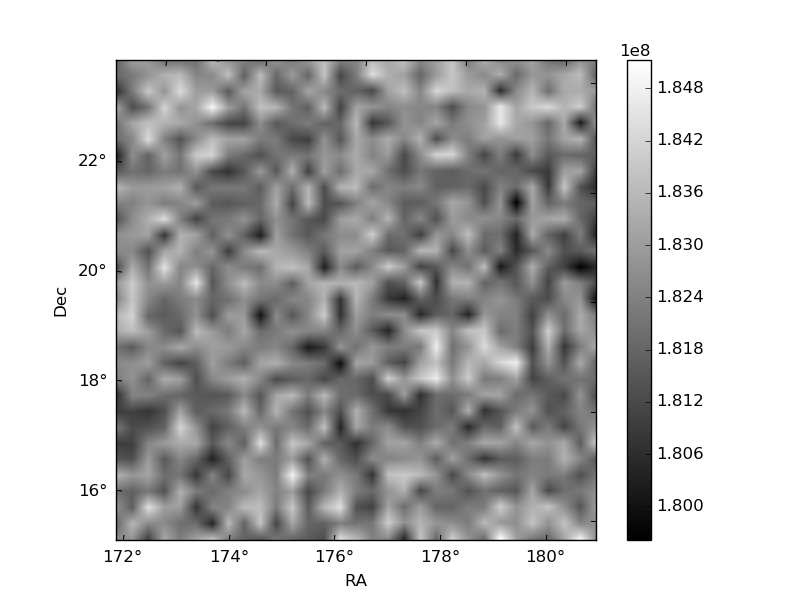
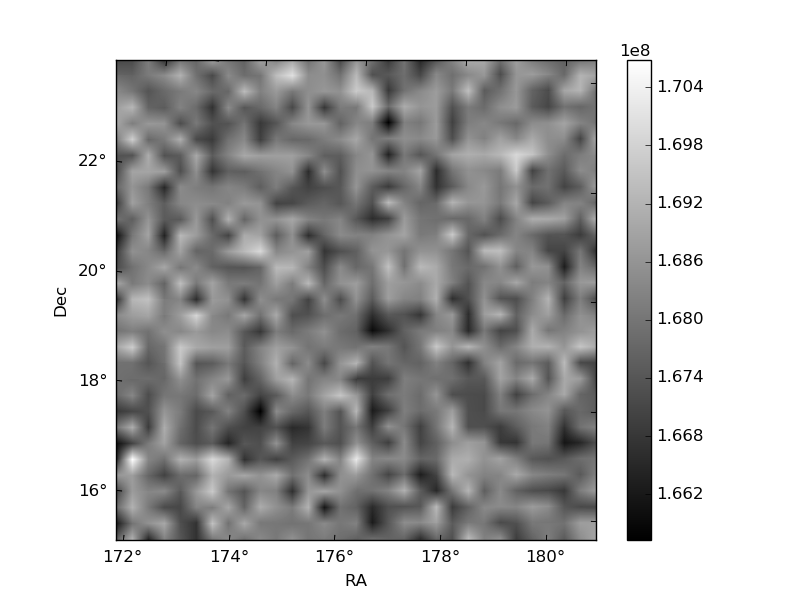
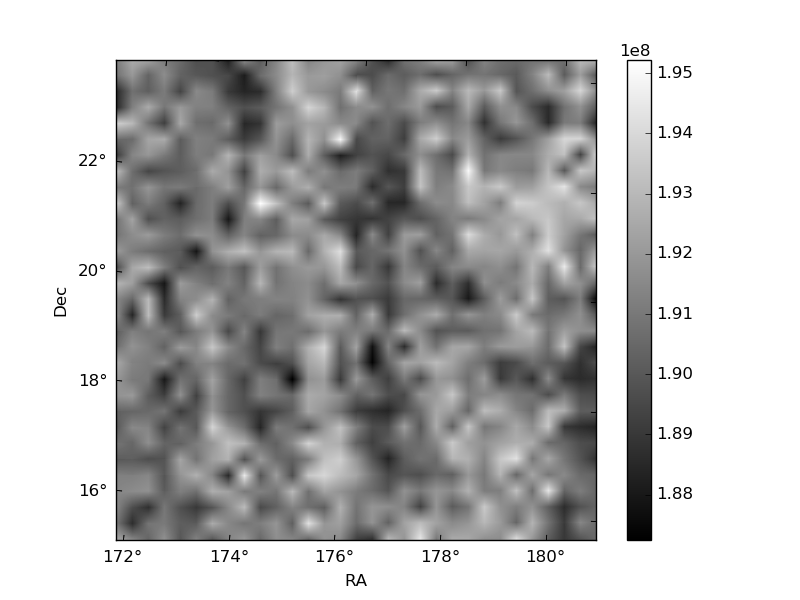
Histogram calculated using DETX and DETY for each event in the final _common_clean file
| Quadrant A | 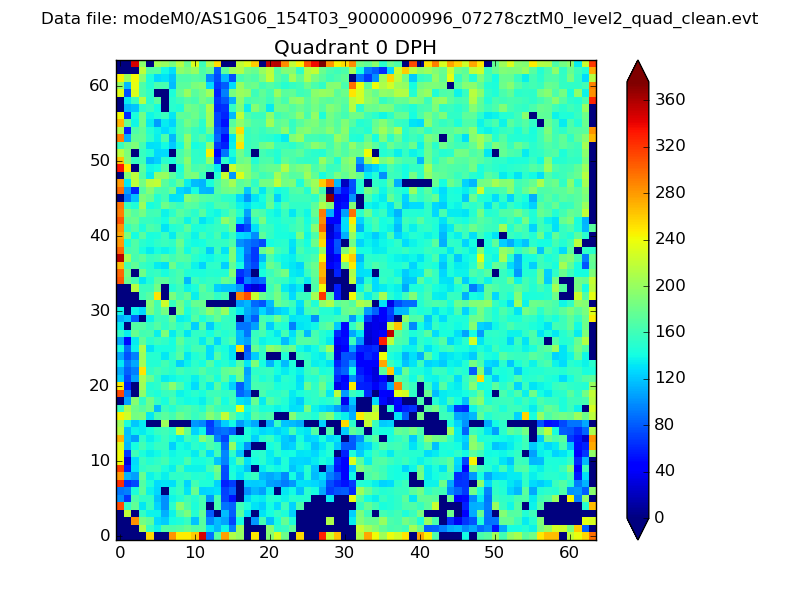 |
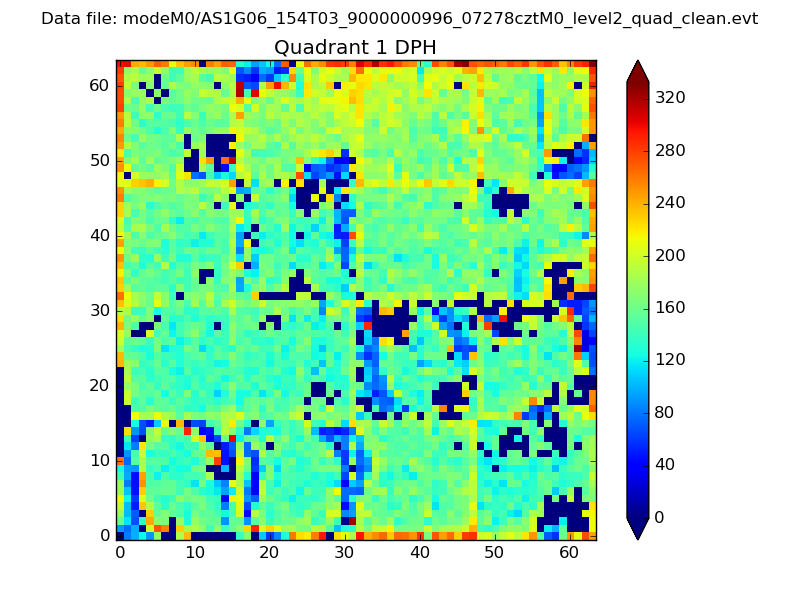 |
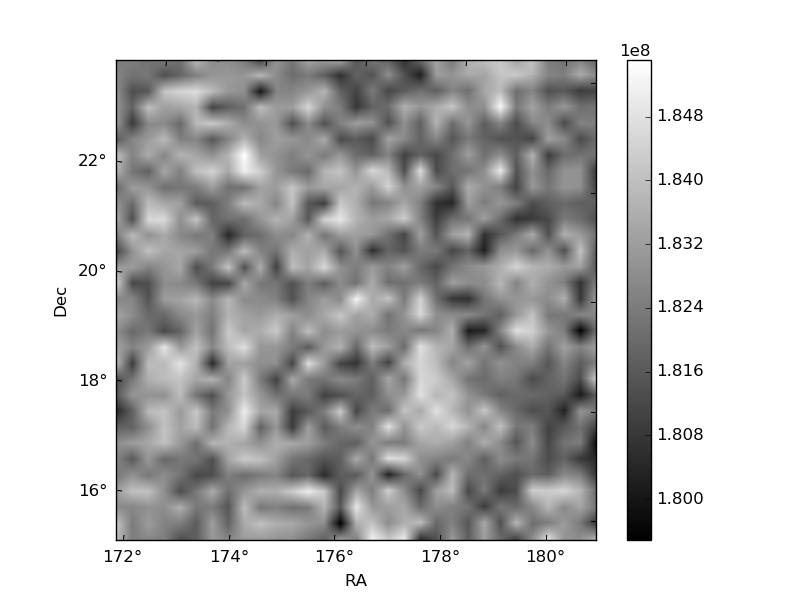
Quadrant B |
|---|---|---|---|
| Quadrant D | 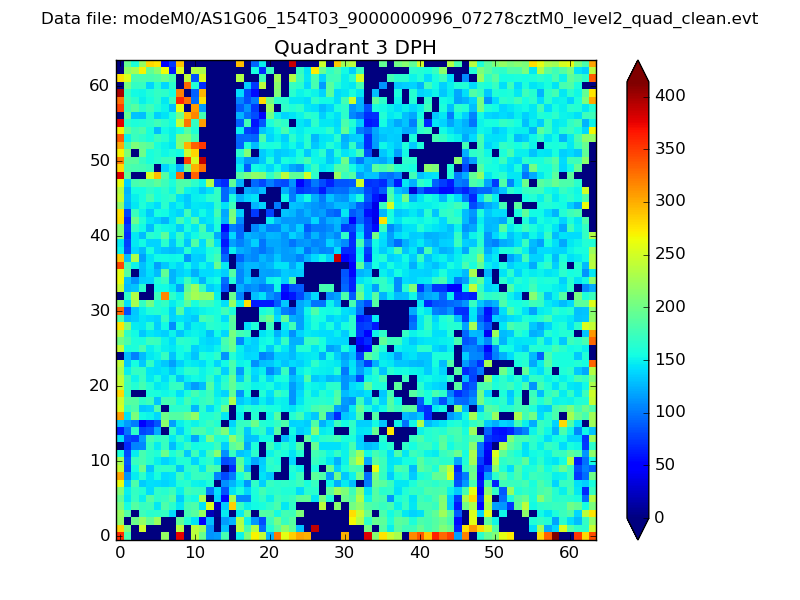 |
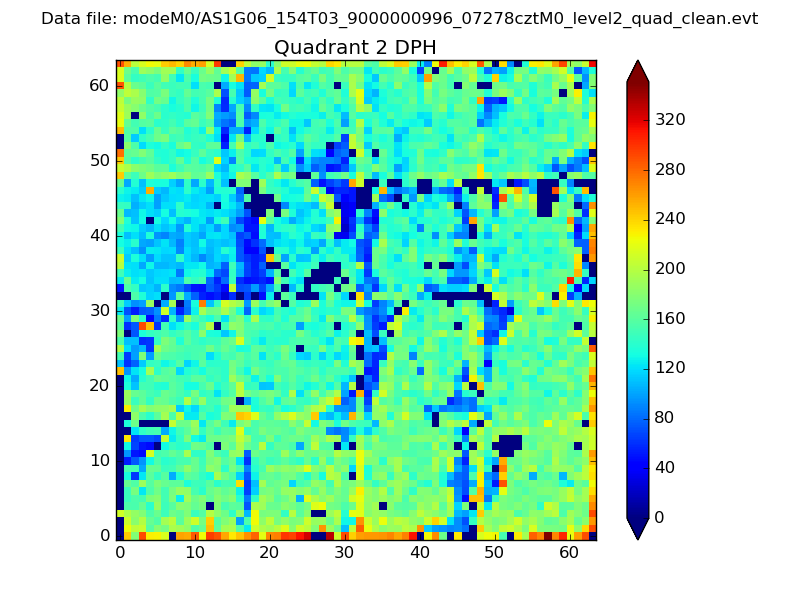 |
Quadrant C |
| Plot type | Count rate plots | Images |
|---|---|---|
| Comparison with Poisson distribution Blue bars denote a histogram of data divided into 1 sec bins. Red curve is a Poisson curve with rate = median count rate of data. |
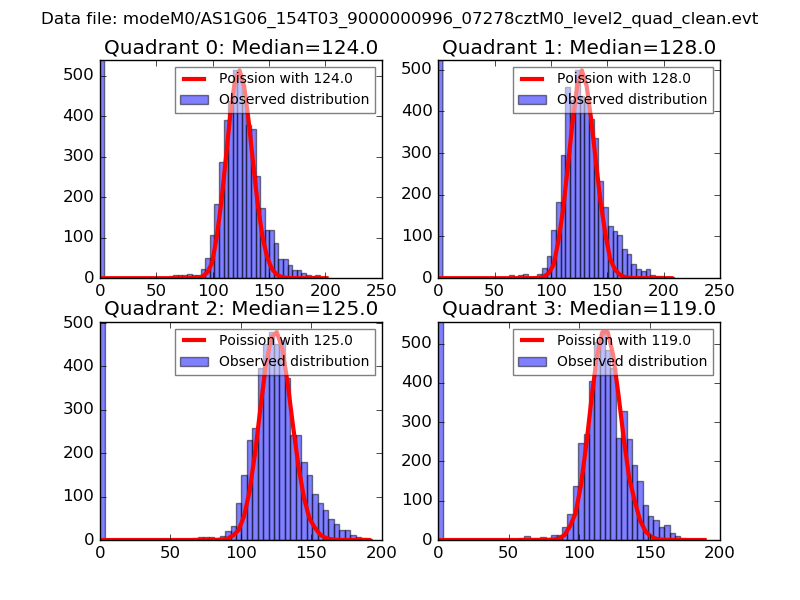 |
 |
| Quadrant-wise count rates Data is divided into 100 sec bins |
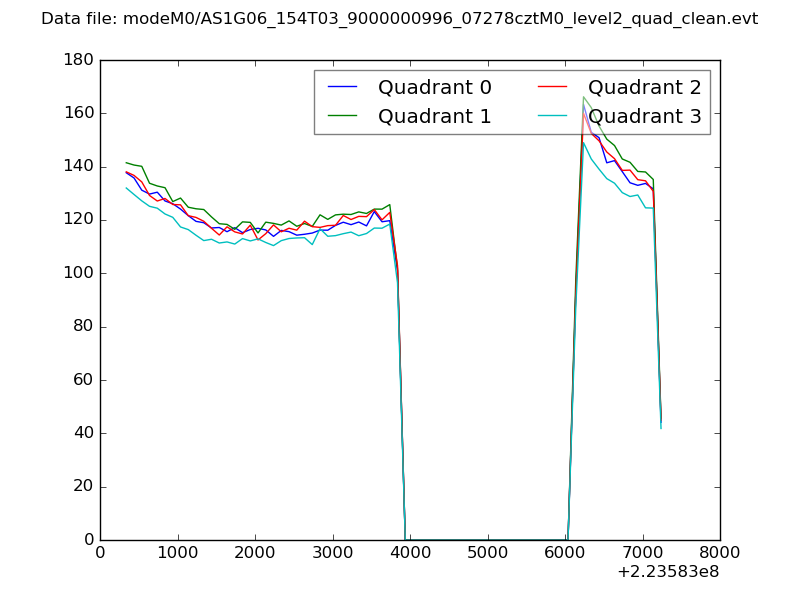 |
|
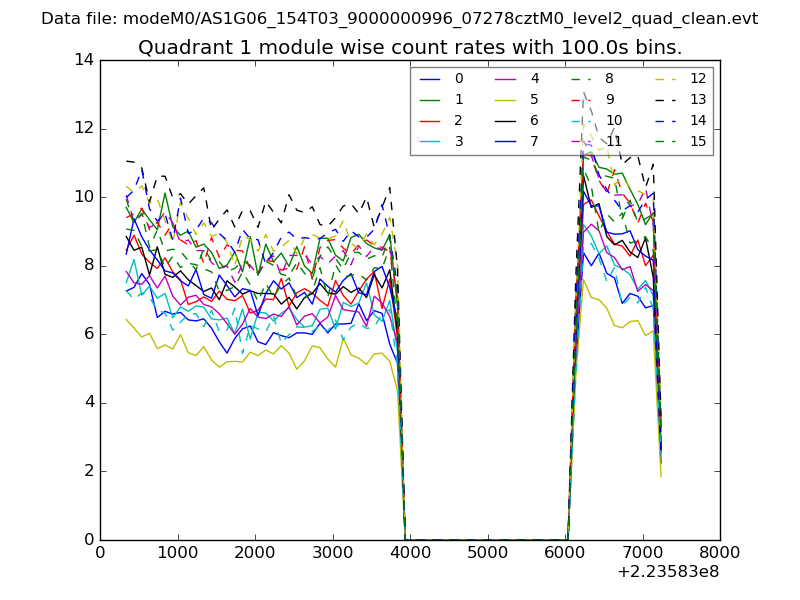
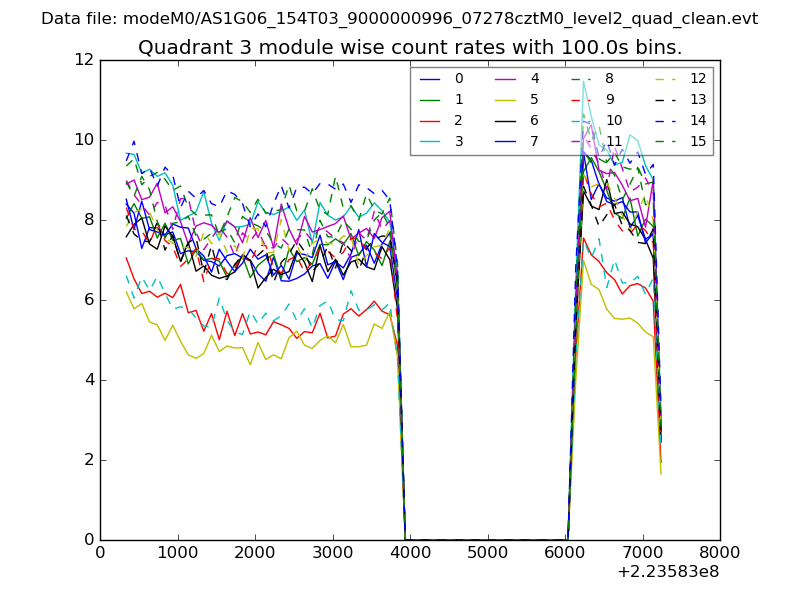
| Module-wise count rates for Quadrant A Data is divided into 100 sec bins |
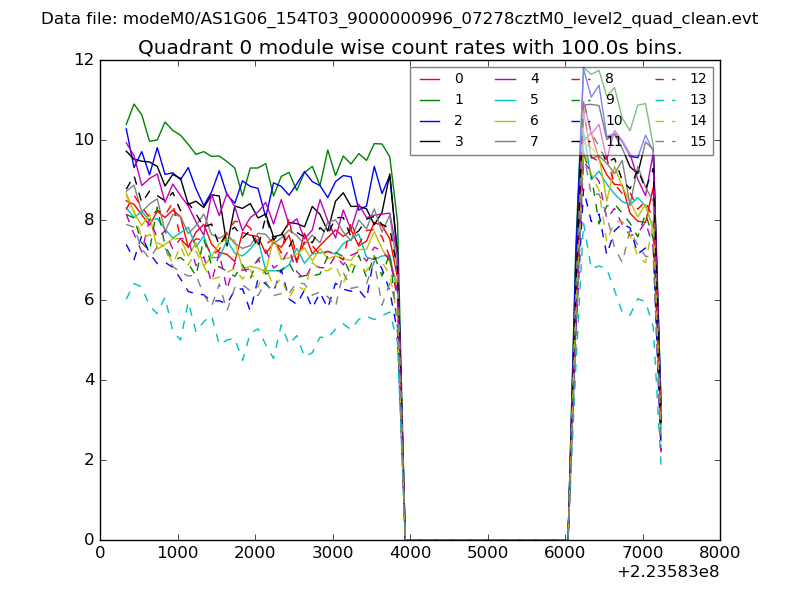 |
 |
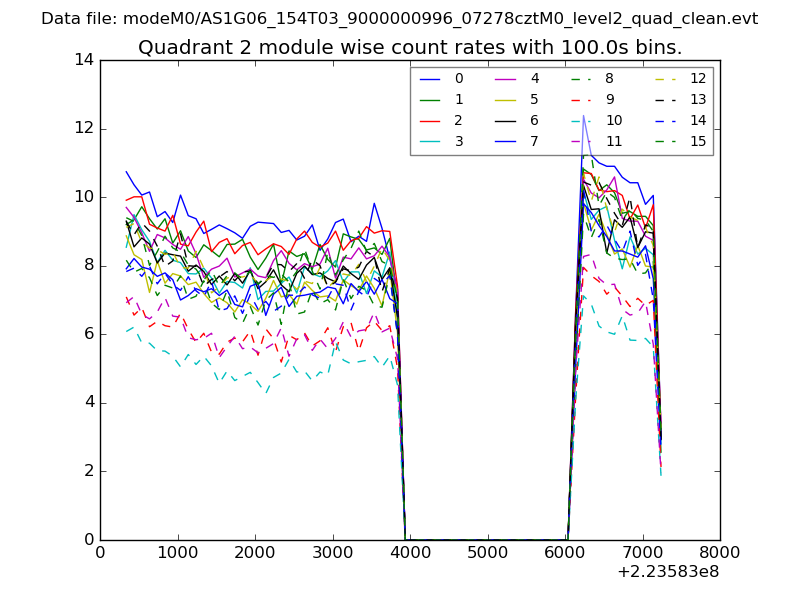
| Module-wise count rates for Quadrant B Data is divided into 100 sec bins |
 |
 |
| Module-wise count rates for Quadrant C Data is divided into 100 sec bins |
 |
 |
| Module-wise count rates for Quadrant D Data is divided into 100 sec bins |
 |
 |
| Parameter | Plot |
|---|---|
| CZT HV Monitor | 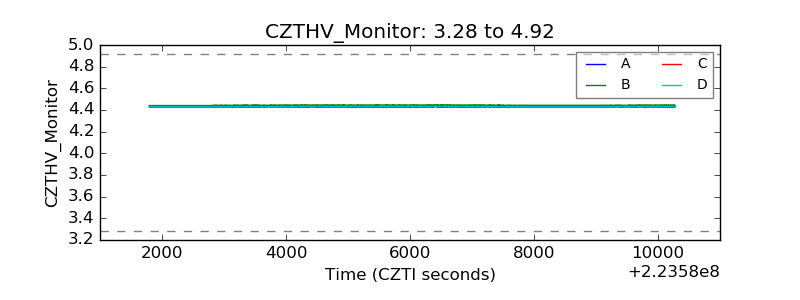 |
| D_VDD | 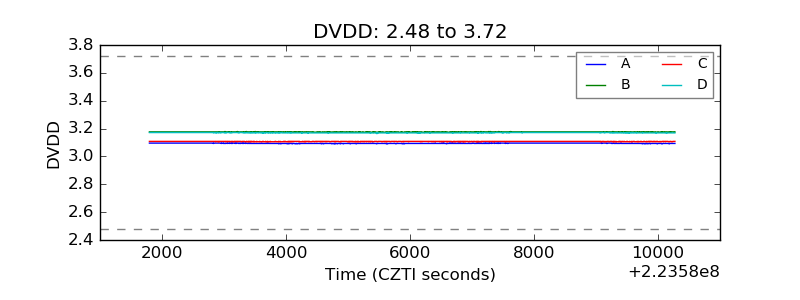 |
| Temperature 1 | 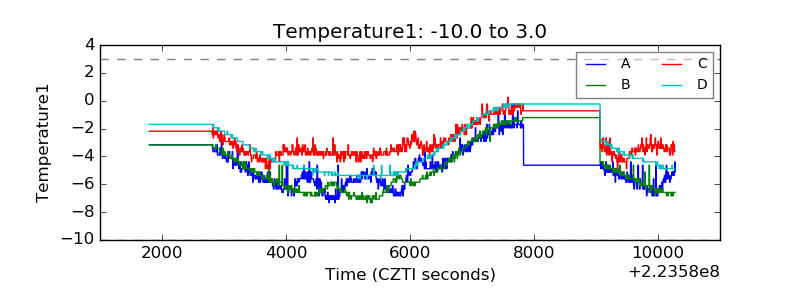 |
| Veto HV Monitor | 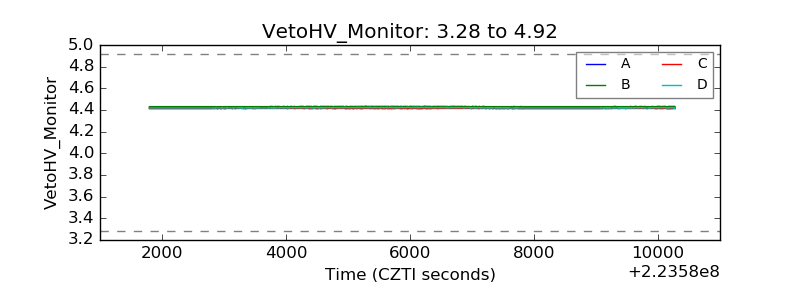 |
| Veto LLD | 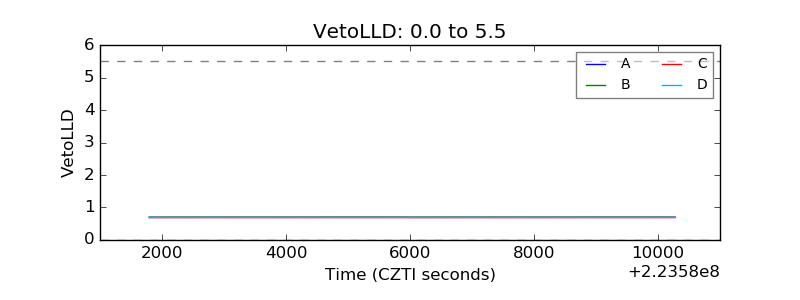 |
| Alpha Counter | 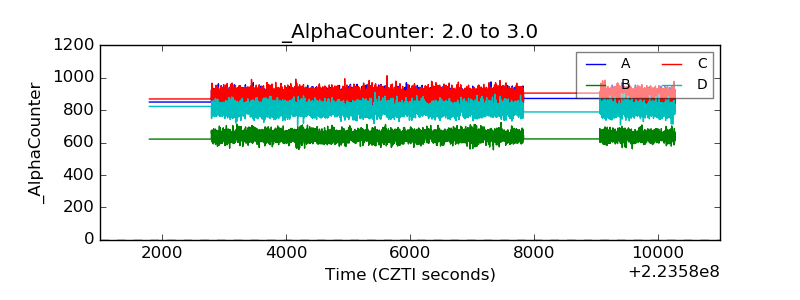 |
| _CPM_Rate | 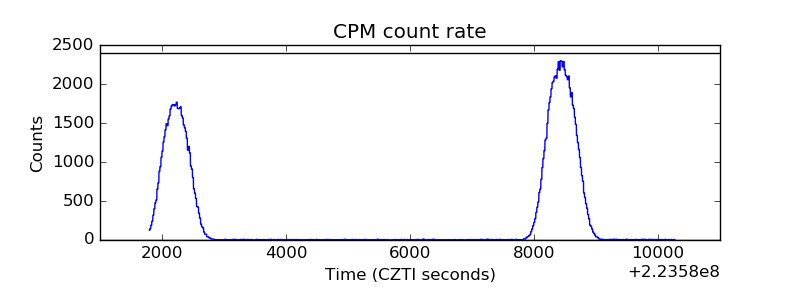 |
| CZT Counter | 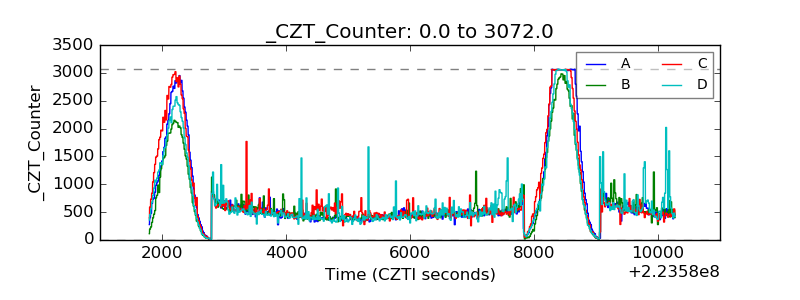 |
| +2.5 Volts monitor |  |
| +5 Volts monitor |  |
| _ROLL_ROT | 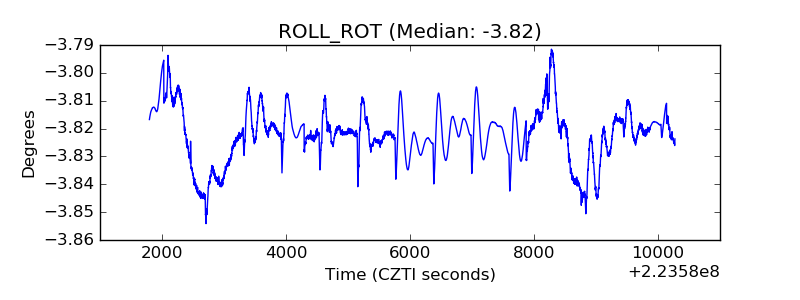 |
| _Roll_DEC | 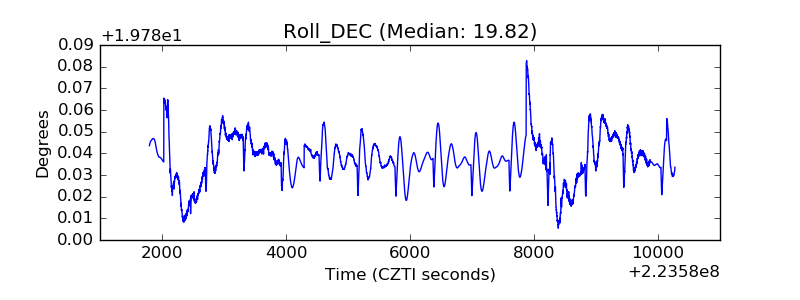 |
| _Roll_RA | 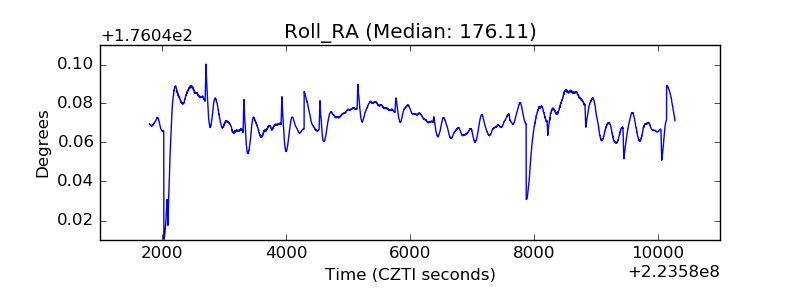 |
| Veto Counter | 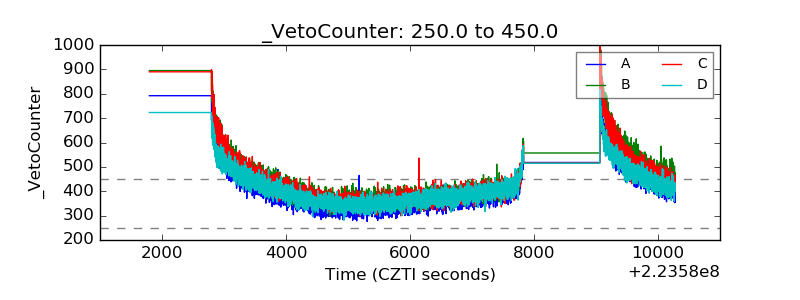 |