| Param | Original file | Final file |
|---|---|---|
| Filename | modeM0/AS1G06_154T03_9000000996_07281cztM0_level2.evt | modeM0/AS1G06_154T03_9000000996_07281cztM0_level2_quad_clean.evt |
| Size (bytes) | 841,014,720 | 163,146,240 |
| Size | 802.1 MB | 155.6 MB |
| Events in quadrant A | 5,812,278 | 1,032,361 |
| Events in quadrant B | 6,093,735 | 1,071,454 |
| Events in quadrant C | 5,708,446 | 1,036,817 |
| Events in quadrant D | 7,036,773 | 964,018 |
| Mode M0 | |||
|---|---|---|---|
| Quadrant | BADHDUFLAG | Total packets | Discarded packets |
| A | 0 | 25302 | 4 |
| B | 0 | 25965 | 3 |
| C | 0 | 25117 | 3 |
| D | 0 | 29498 | 3 |
| Mode SS | |||
|---|---|---|---|
| Quadrant | BADHDUFLAG | Total packets | Discarded packets |
| A | 0 | 250 | 0 |
| B | 0 | 250 | 0 |
| C | 0 | 250 | 0 |
| D | 0 | 250 | 0 |
| Mode M9 | |||
|---|---|---|---|
| Quadrant | BADHDUFLAG | Total packets | Discarded packets |
| A | 0 | 38 | 0 |
| B | 0 | 38 | 0 |
| C | 0 | 38 | 0 |
| D | 0 | 38 | 0 |
| Quadrant | Total seconds | Saturated seconds | Saturation percentage |
|---|---|---|---|
| A | 12089 | 74 | 0.612127% |
| B | 12089 | 140 | 1.158078% |
| C | 12089 | 55 | 0.454959% |
| D | 12089 | 234 | 1.935644% |
Noise dominated data is calculated using 1-second bins in cleaned event files. If a bin has >2000 counts, and if more than 50% of those come from <1% of pixels, then it is considered to be noise-dominated and hence unusable.
| Quadrant | # 1 sec bins | Bins with >0 counts | Bins with >2000 counts | High rate bins dominated by noise | Noise dominated (total time) | Noise dominated (detector-on time) | Marked lightcurve |
|---|---|---|---|---|---|---|---|
| A | 16024 | 12092 | 0 | 0 | 0.00% | 0.00% | 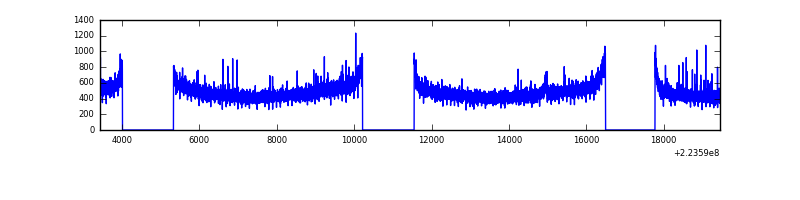 |
| B | 16024 | 12091 | 5 | 5 | 0.03% | 0.04% | 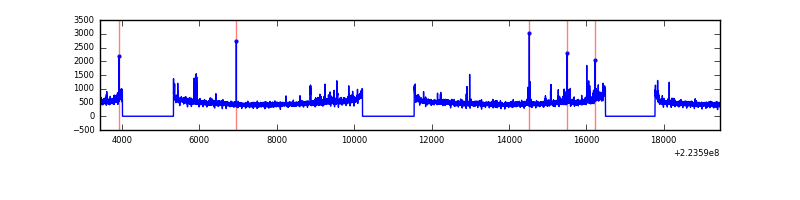 |
| C | 16024 | 12092 | 1 | 1 | 0.01% | 0.01% | 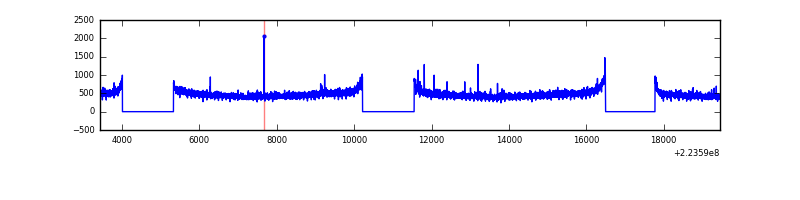 |
| D | 16024 | 12092 | 182 | 182 | 1.14% | 1.51% | 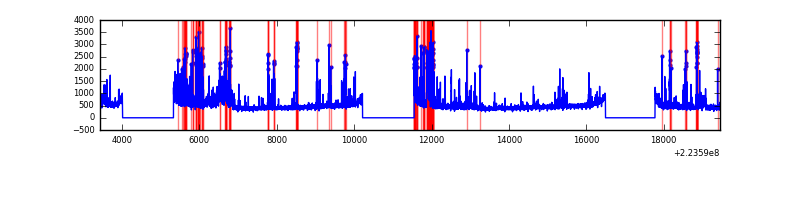 |
Top three noisy pixels from each quadrant. If the there are fewer than three noisy pixels in the level2.evt file, extra rows are filled as -1
| Pixel properties | Quadrant properties | ||||||
|---|---|---|---|---|---|---|---|
| Quadrant | DetID | PixID | Counts | Sigma | Mean | Median | Sigma |
| A | 8 | 15 | 57563 | 185.45 | 1488 | 1462 | 302.5 |
| A | 0 | 226 | 14207 | 42.13 | 1488 | 1462 | 302.5 |
| A | 15 | 234 | 14148 | 41.94 | 1488 | 1462 | 302.5 |
| B | 0 | 214 | 73361 | 252.51 | 1512 | 1476 | 284.7 |
| B | 4 | 173 | 50793 | 173.23 | 1512 | 1476 | 284.7 |
| B | 4 | 81 | 41883 | 141.94 | 1512 | 1476 | 284.7 |
| C | 9 | 68 | 19970 | 55.7 | 1452 | 1461 | 332.3 |
| C | 1 | 16 | 14612 | 39.58 | 1452 | 1461 | 332.3 |
| C | 13 | 61 | 11519 | 30.27 | 1452 | 1461 | 332.3 |
| D | 2 | 33 | 662642 | 1902.42 | 1428 | 1384 | 347.6 |
| D | 2 | 216 | 377708 | 1082.67 | 1428 | 1384 | 347.6 |
| D | 13 | 105 | 180525 | 515.38 | 1428 | 1384 | 347.6 |
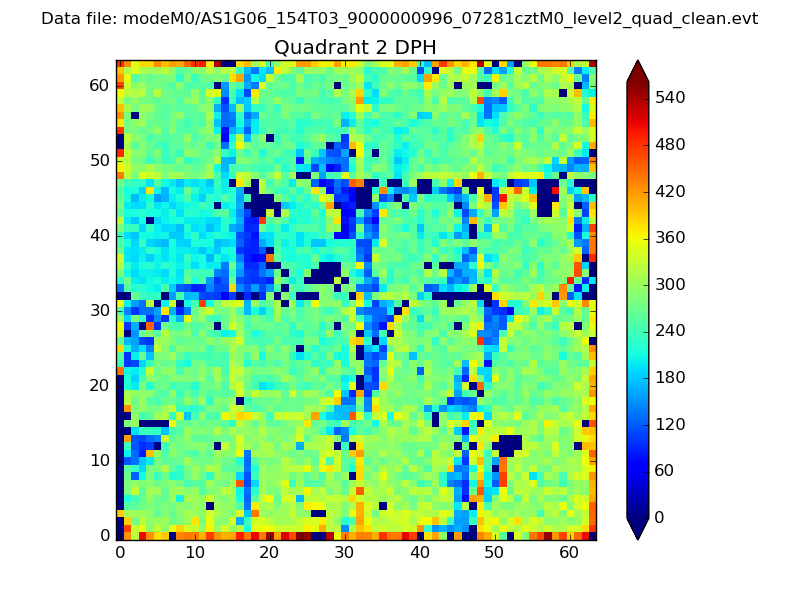
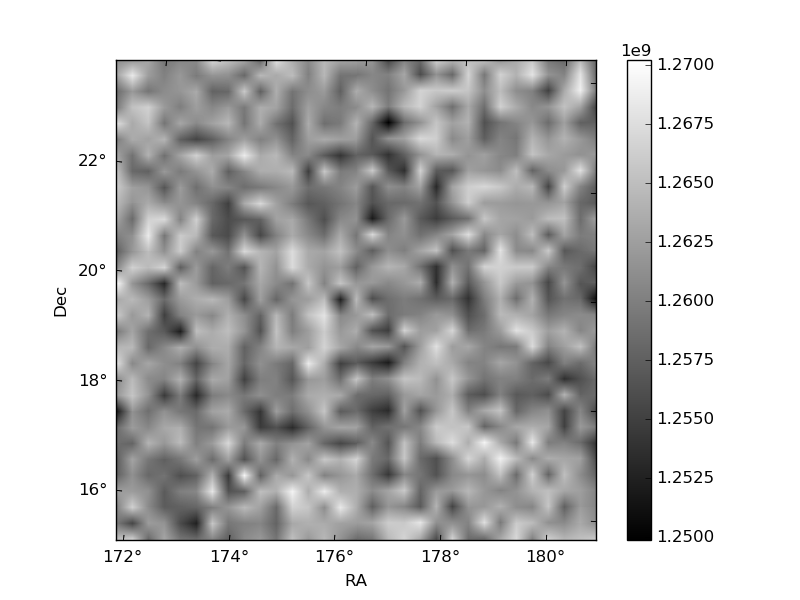
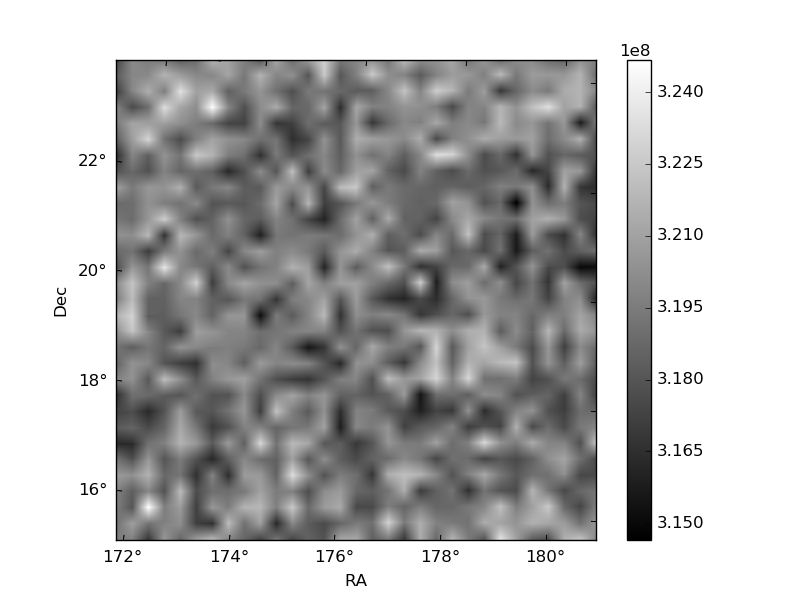
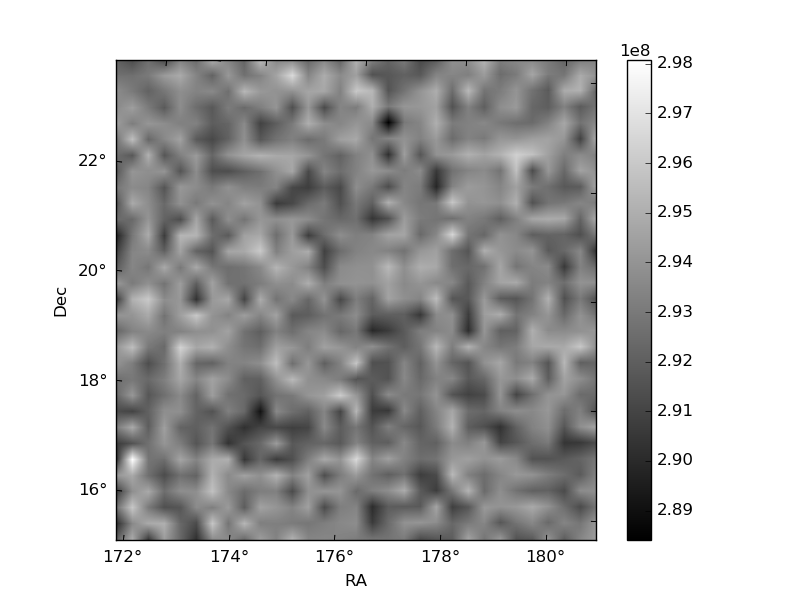
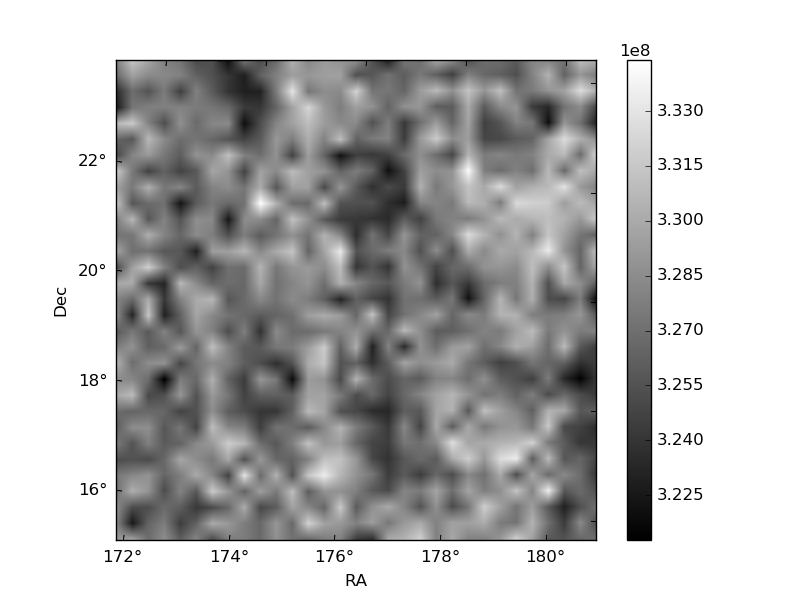
Histogram calculated using DETX and DETY for each event in the final _common_clean file
| Quadrant A | 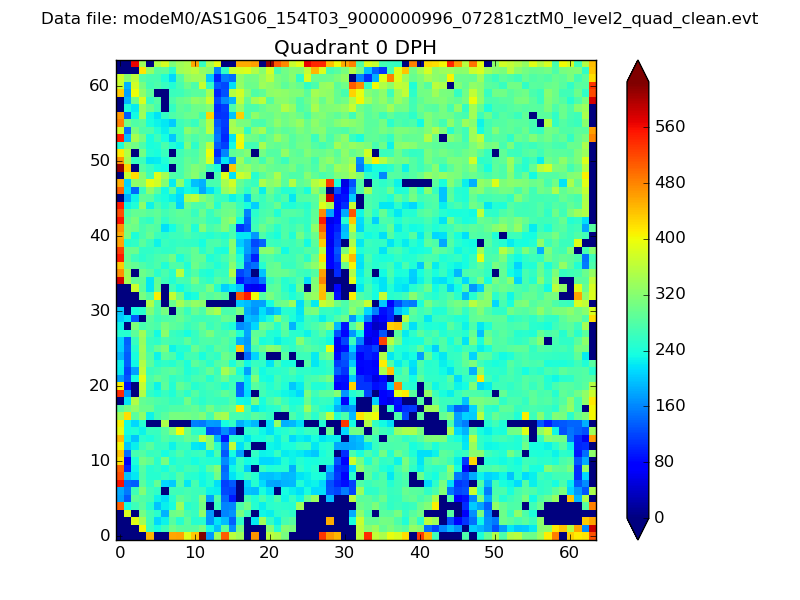 |
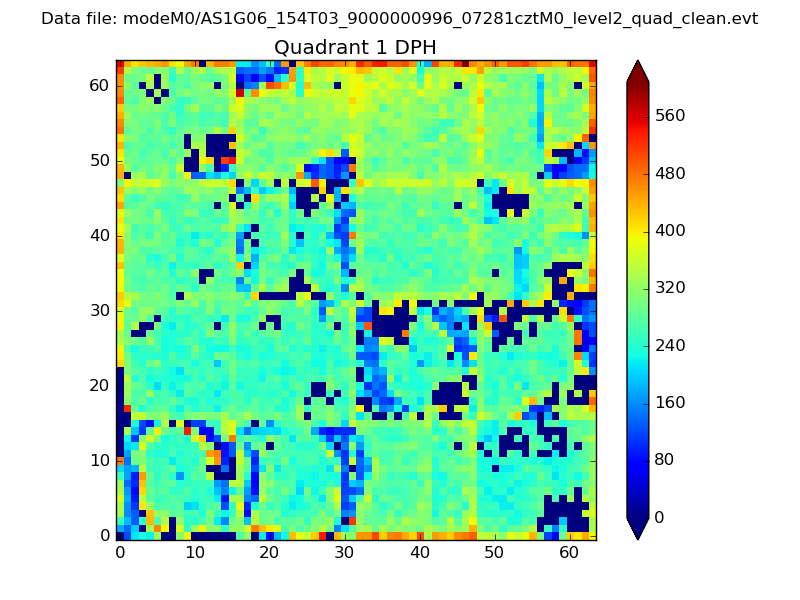 |
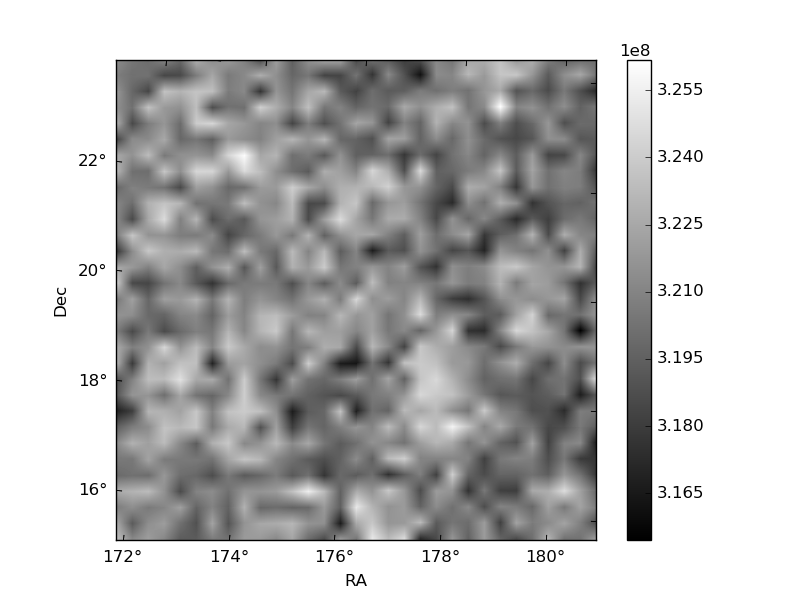
Quadrant B |
|---|---|---|---|
| Quadrant D | 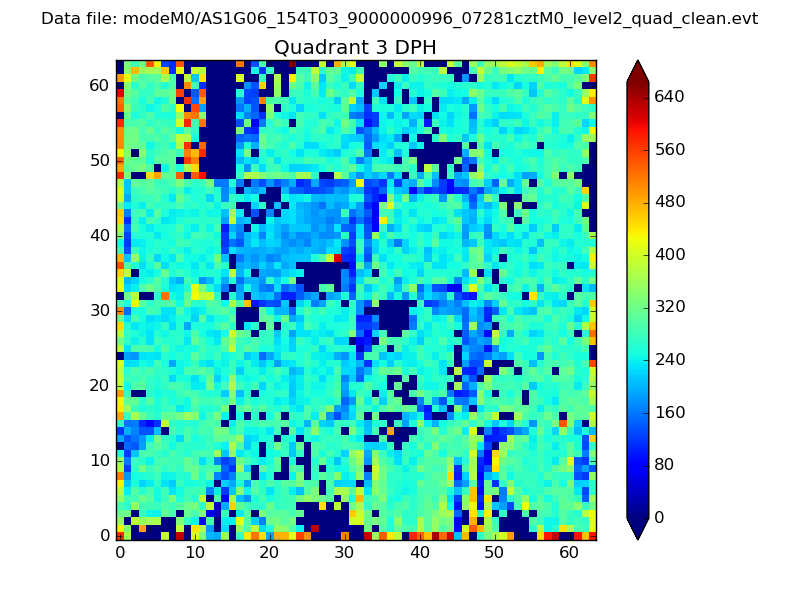 |
 |
Quadrant C |
| Plot type | Count rate plots | Images |
|---|---|---|
| Comparison with Poisson distribution Blue bars denote a histogram of data divided into 1 sec bins. Red curve is a Poisson curve with rate = median count rate of data. |
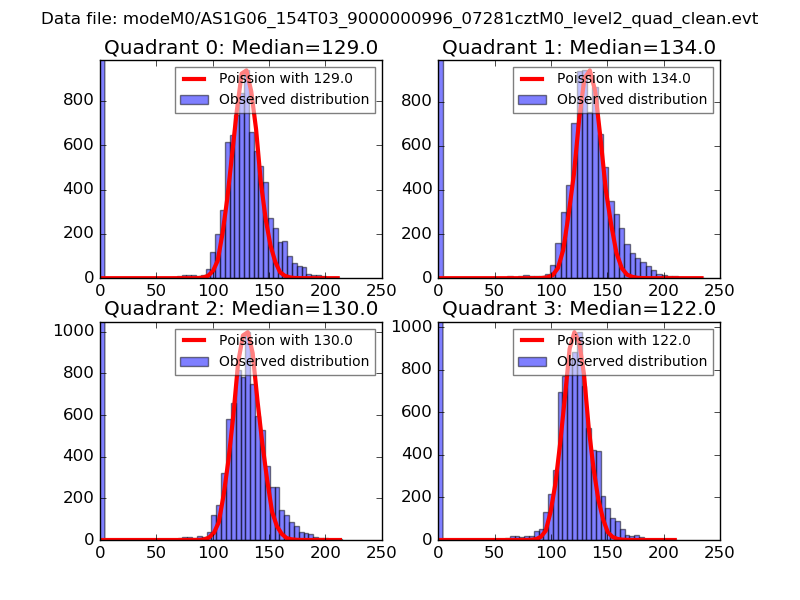 |
 |
| Quadrant-wise count rates Data is divided into 100 sec bins |
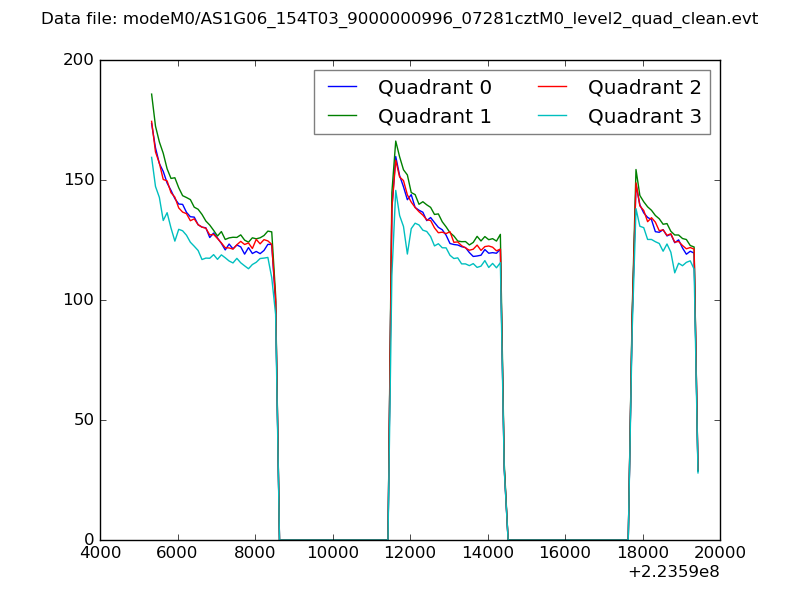 |
|
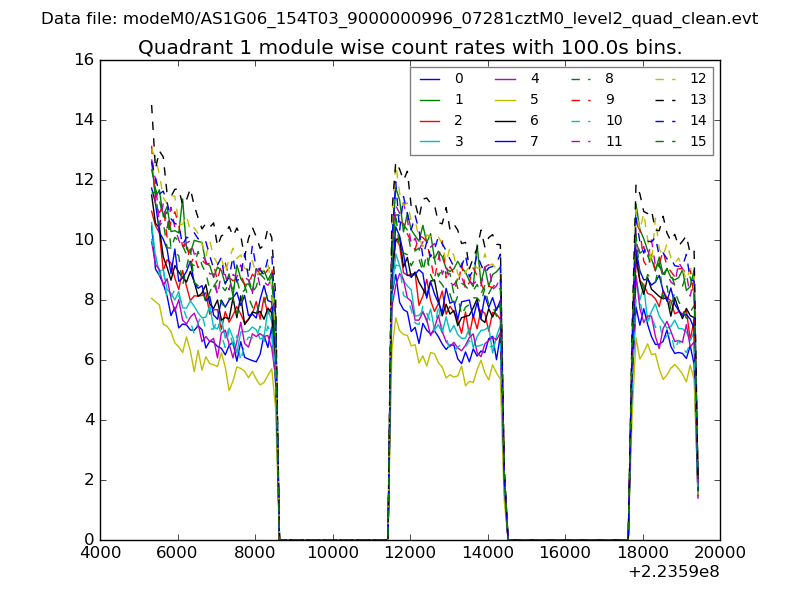
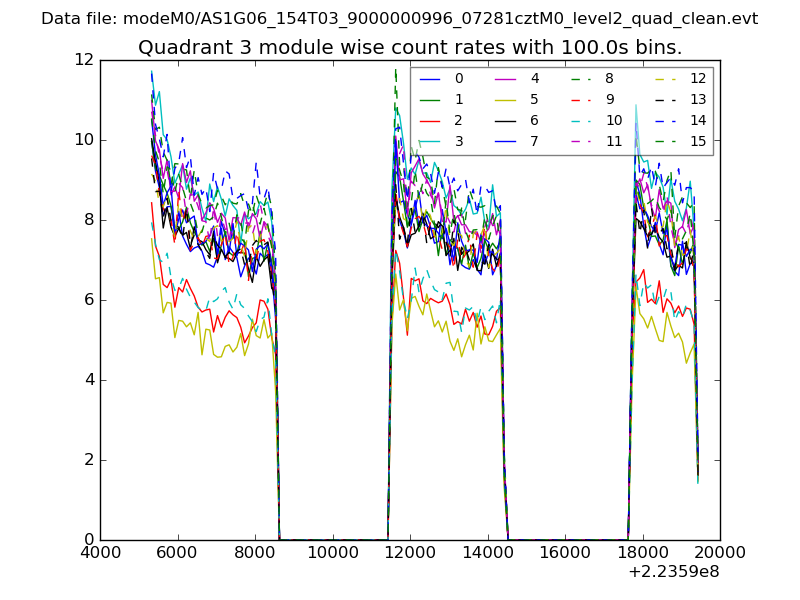
| Module-wise count rates for Quadrant A Data is divided into 100 sec bins |
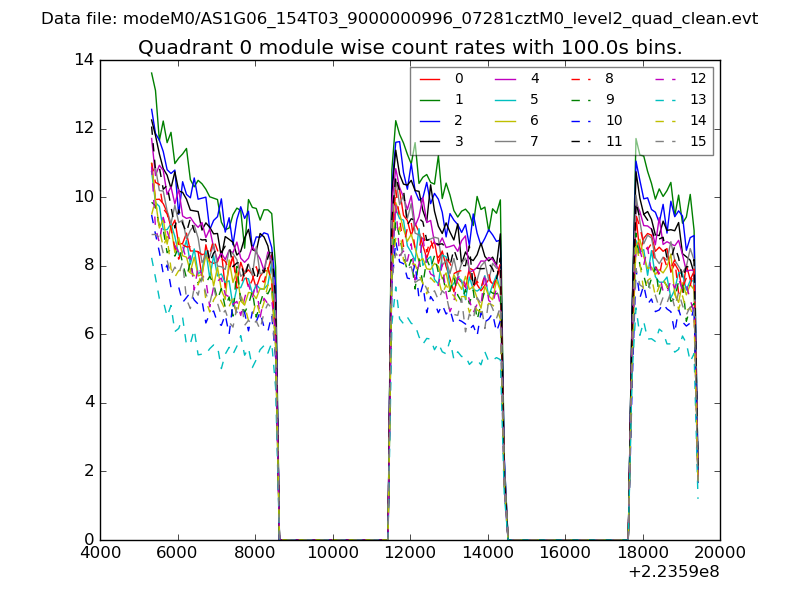 |
 |
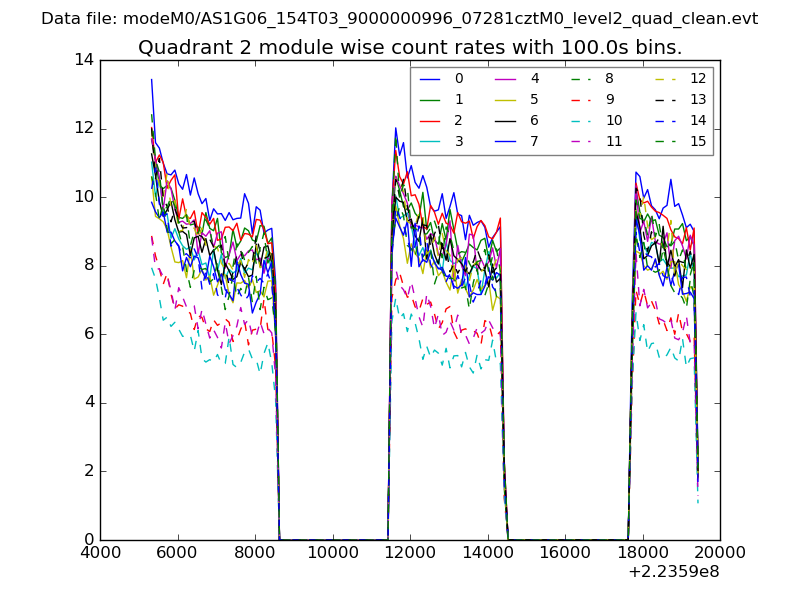
| Module-wise count rates for Quadrant B Data is divided into 100 sec bins |
 |
 |
| Module-wise count rates for Quadrant C Data is divided into 100 sec bins |
 |
 |
| Module-wise count rates for Quadrant D Data is divided into 100 sec bins |
 |
 |
| Parameter | Plot |
|---|---|
| CZT HV Monitor | 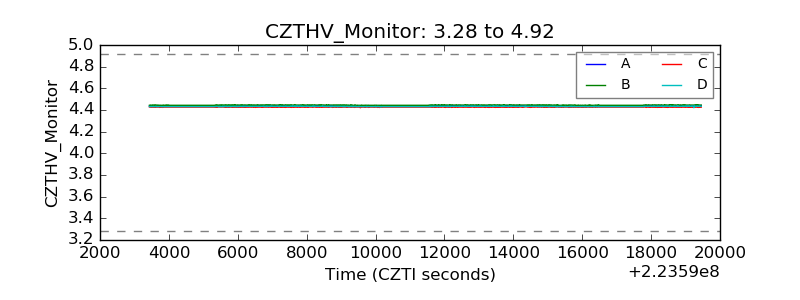 |
| D_VDD | 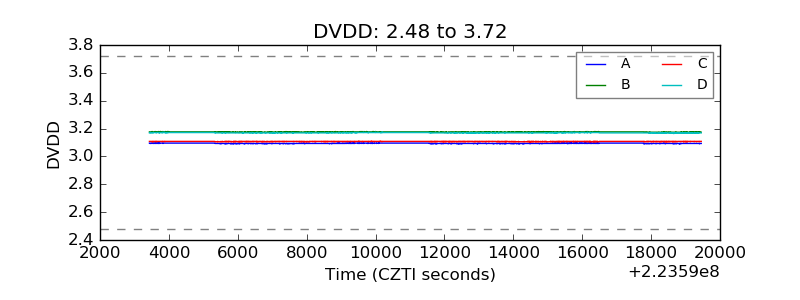 |
| Temperature 1 | 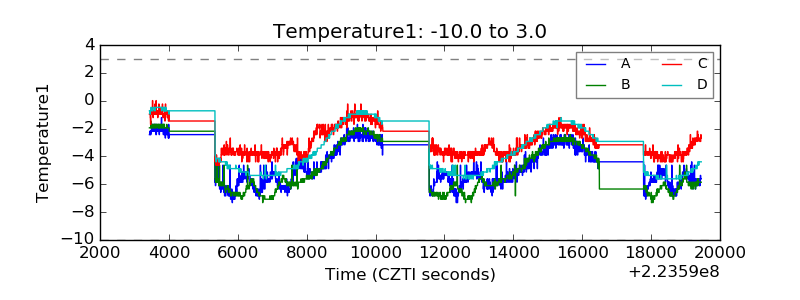 |
| Veto HV Monitor | 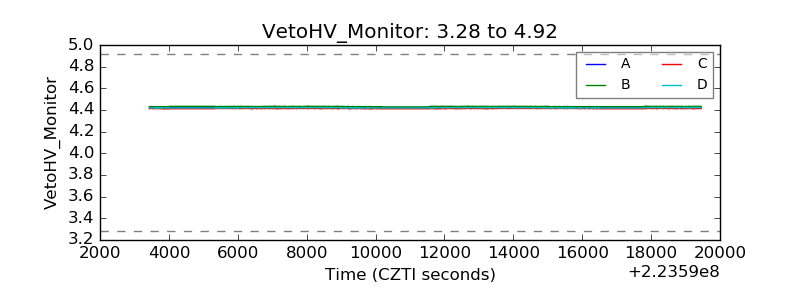 |
| Veto LLD | 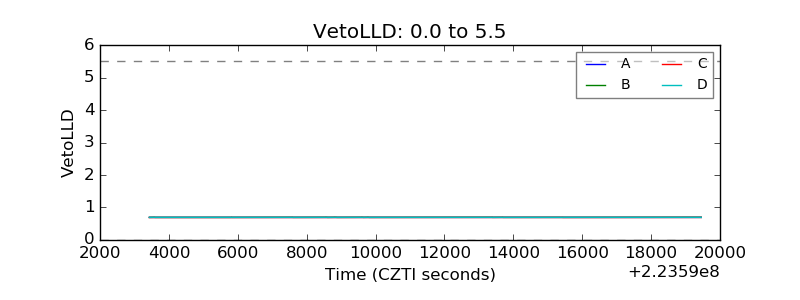 |
| Alpha Counter | 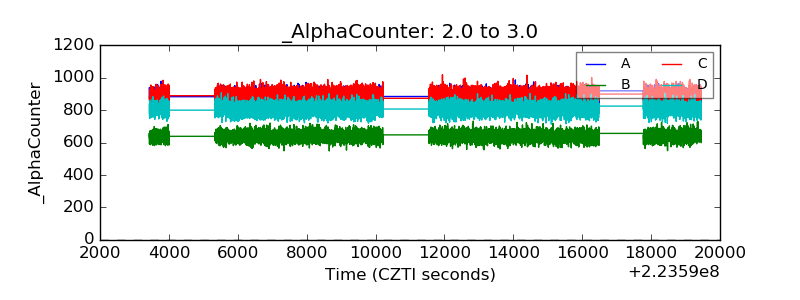 |
| _CPM_Rate | 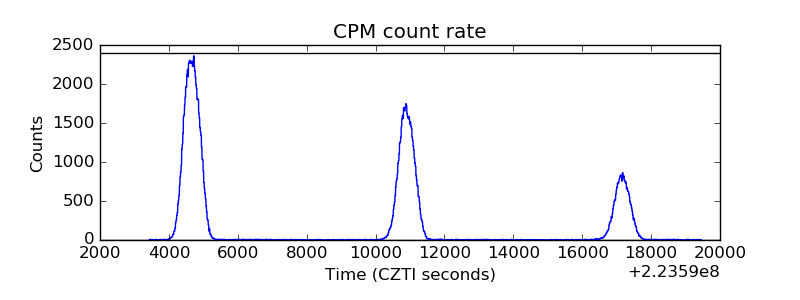 |
| CZT Counter | 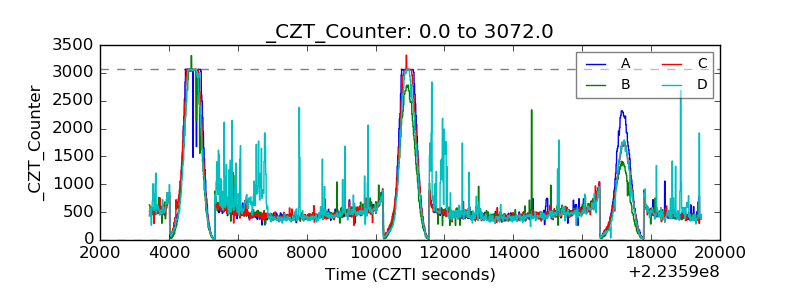 |
| +2.5 Volts monitor |  |
| +5 Volts monitor |  |
| _ROLL_ROT | 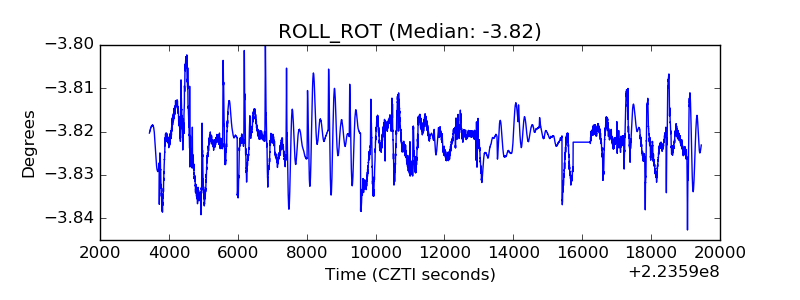 |
| _Roll_DEC | 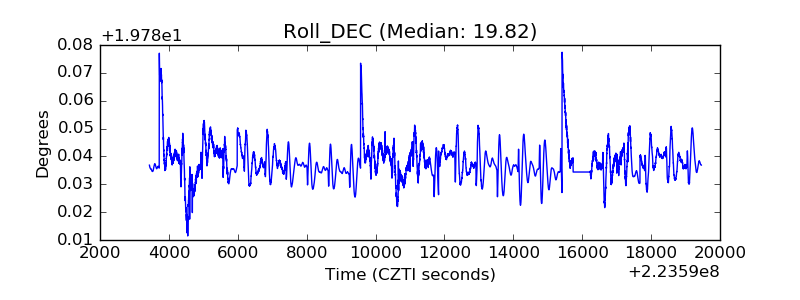 |
| _Roll_RA | 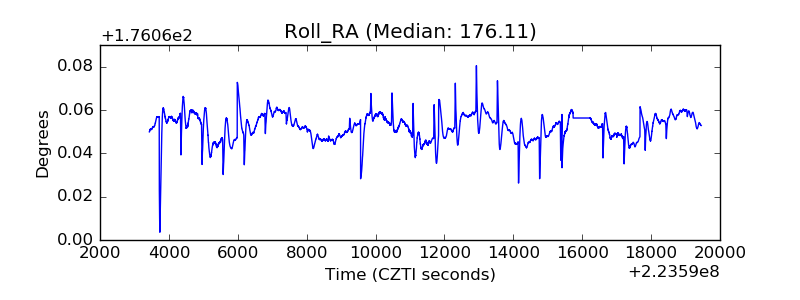 |
| Veto Counter | 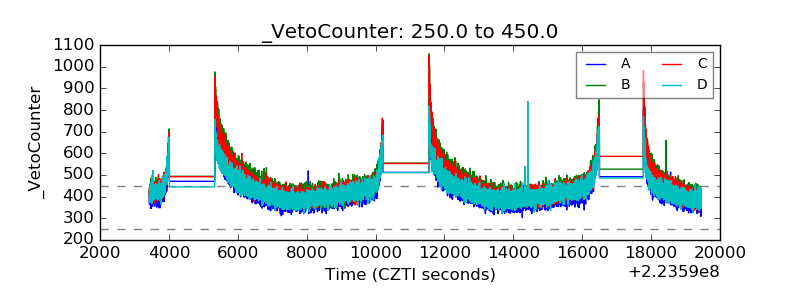 |