| Param | Original file | Final file |
|---|---|---|
| Filename | modeM0/AS1G06_154T03_9000000996_07283cztM0_level2.evt | modeM0/AS1G06_154T03_9000000996_07283cztM0_level2_quad_clean.evt |
| Size (bytes) | 479,678,400 | 95,976,000 |
| Size | 457.5 MB | 91.5 MB |
| Events in quadrant A | 3,520,332 | 602,795 |
| Events in quadrant B | 3,487,402 | 617,670 |
| Events in quadrant C | 3,267,111 | 607,307 |
| Events in quadrant D | 3,764,178 | 578,834 |
| Mode M0 | |||
|---|---|---|---|
| Quadrant | BADHDUFLAG | Total packets | Discarded packets |
| A | 0 | 15351 | 3 |
| B | 0 | 15189 | 2 |
| C | 0 | 14836 | 2 |
| D | 0 | 16402 | 2 |
| Mode SS | |||
|---|---|---|---|
| Quadrant | BADHDUFLAG | Total packets | Discarded packets |
| A | 0 | 146 | 0 |
| B | 0 | 146 | 0 |
| C | 0 | 146 | 0 |
| D | 0 | 146 | 0 |
| Mode M9 | |||
|---|---|---|---|
| Quadrant | BADHDUFLAG | Total packets | Discarded packets |
| A | 0 | 18 | 0 |
| B | 0 | 18 | 0 |
| C | 0 | 18 | 0 |
| D | 0 | 18 | 0 |
| Quadrant | Total seconds | Saturated seconds | Saturation percentage |
|---|---|---|---|
| A | 7184 | 144 | 2.004454% |
| B | 7184 | 132 | 1.837416% |
| C | 7184 | 57 | 0.793430% |
| D | 7184 | 166 | 2.310690% |
Noise dominated data is calculated using 1-second bins in cleaned event files. If a bin has >2000 counts, and if more than 50% of those come from <1% of pixels, then it is considered to be noise-dominated and hence unusable.
| Quadrant | # 1 sec bins | Bins with >0 counts | Bins with >2000 counts | High rate bins dominated by noise | Noise dominated (total time) | Noise dominated (detector-on time) | Marked lightcurve |
|---|---|---|---|---|---|---|---|
| A | 8894 | 7184 | 22 | 22 | 0.25% | 0.31% |  |
| B | 8894 | 7184 | 27 | 27 | 0.30% | 0.38% |  |
| C | 8894 | 7186 | 6 | 6 | 0.07% | 0.08% |  |
| D | 8894 | 7185 | 84 | 84 | 0.94% | 1.17% |  |
Top three noisy pixels from each quadrant. If the there are fewer than three noisy pixels in the level2.evt file, extra rows are filled as -1
| Pixel properties | Quadrant properties | ||||||
|---|---|---|---|---|---|---|---|
| Quadrant | DetID | PixID | Counts | Sigma | Mean | Median | Sigma |
| A | 15 | 239 | 177787 | 1023.28 | 847 | 828 | 172.9 |
| A | 14 | 111 | 41753 | 236.65 | 847 | 828 | 172.9 |
| A | 8 | 15 | 35205 | 198.79 | 847 | 828 | 172.9 |
| B | 4 | 239 | 51899 | 309.33 | 854 | 832 | 165.1 |
| B | 0 | 214 | 45354 | 269.68 | 854 | 832 | 165.1 |
| B | 4 | 81 | 39402 | 233.63 | 854 | 832 | 165.1 |
| C | 1 | 16 | 38960 | 196.83 | 826 | 829 | 193.7 |
| C | 13 | 61 | 6254 | 28.0 | 826 | 829 | 193.7 |
| C | 9 | 68 | 5821 | 25.77 | 826 | 829 | 193.7 |
| D | 2 | 14 | 221836 | 1089.0 | 820 | 794 | 203.0 |
| D | 2 | 216 | 139321 | 682.47 | 820 | 794 | 203.0 |
| D | 15 | 223 | 107476 | 525.59 | 820 | 794 | 203.0 |
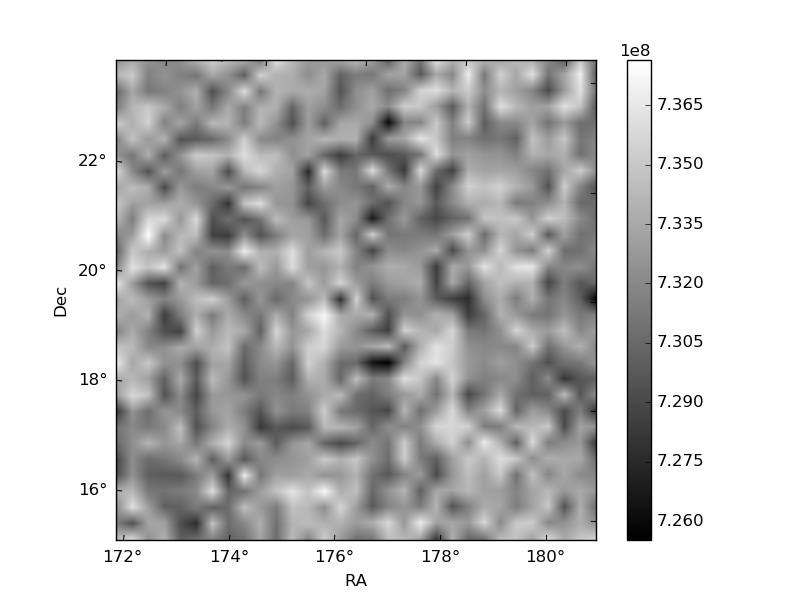
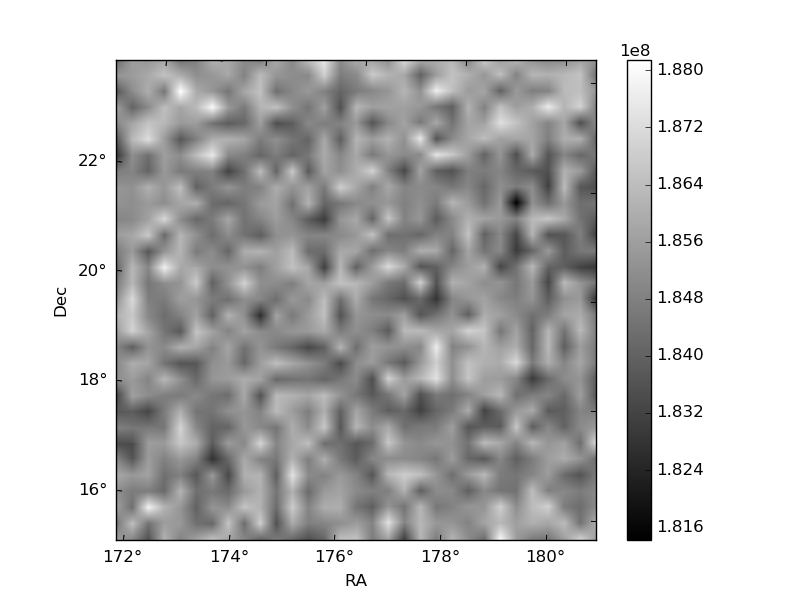
Histogram calculated using DETX and DETY for each event in the final _common_clean file
| Quadrant A | 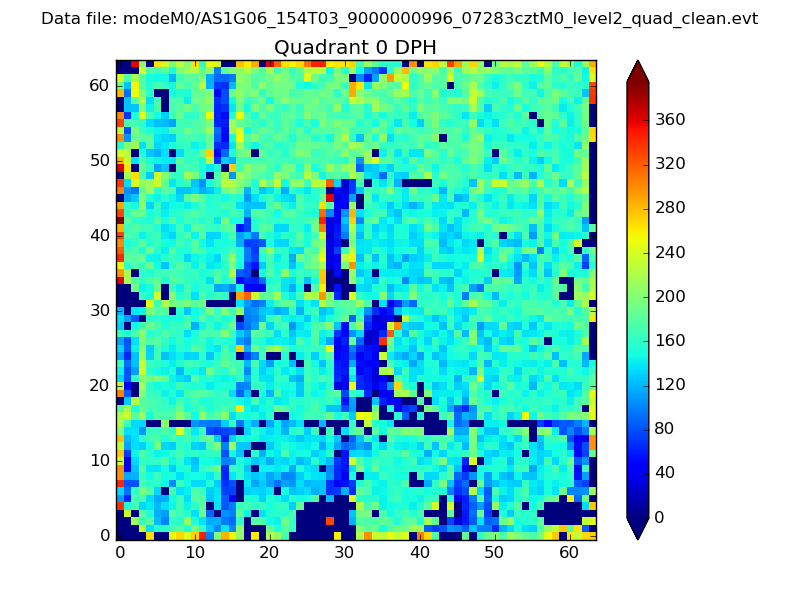 |
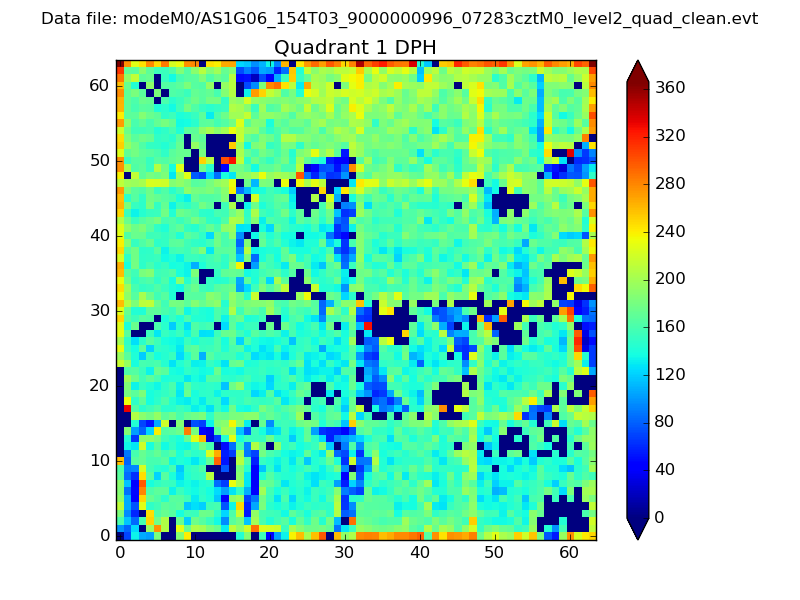 |
Quadrant B |
|---|---|---|---|
| Quadrant D |  |
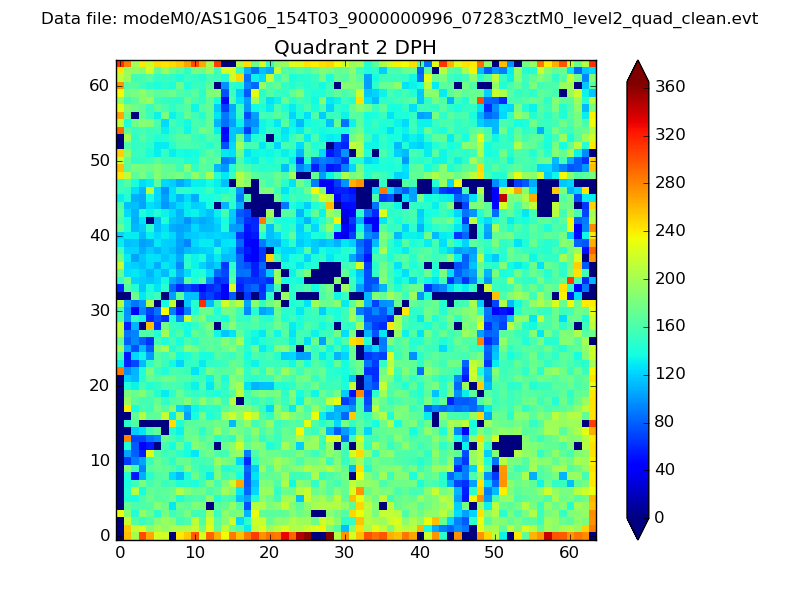 |
Quadrant C |
| Plot type | Count rate plots | Images |
|---|---|---|
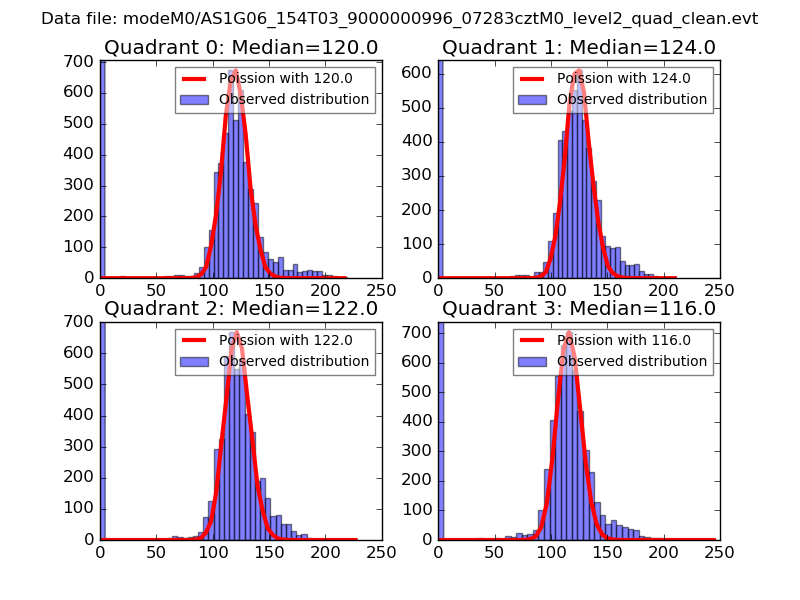
| Comparison with Poisson distribution Blue bars denote a histogram of data divided into 1 sec bins. Red curve is a Poisson curve with rate = median count rate of data. |
 |
 |
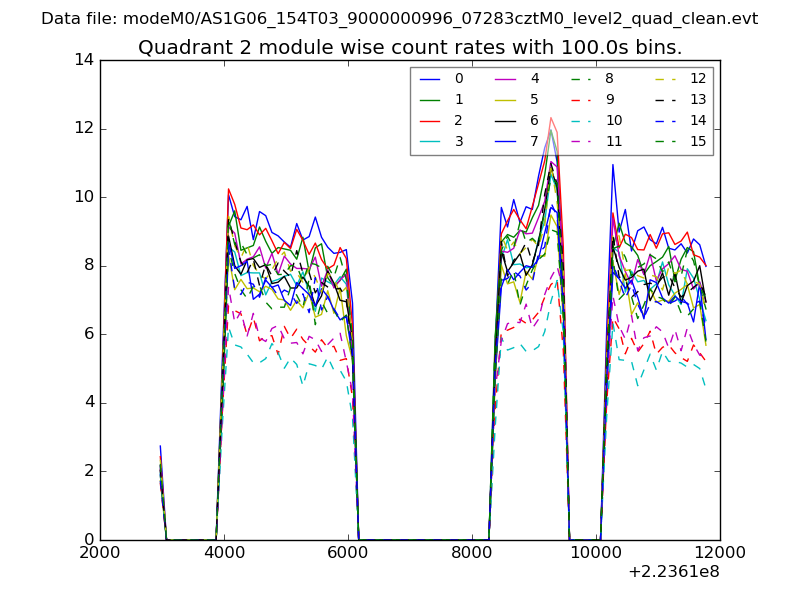
| Quadrant-wise count rates Data is divided into 100 sec bins |
 |
|
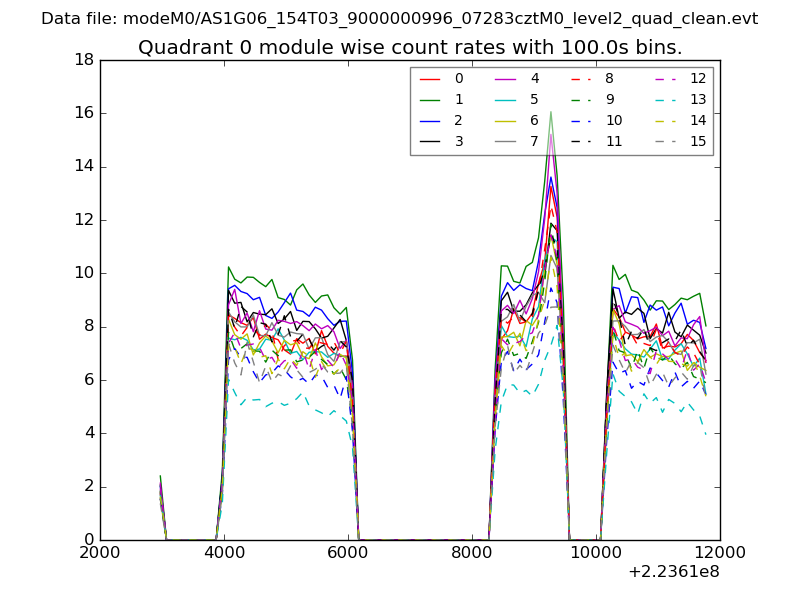
| Module-wise count rates for Quadrant A Data is divided into 100 sec bins |
 |
 |
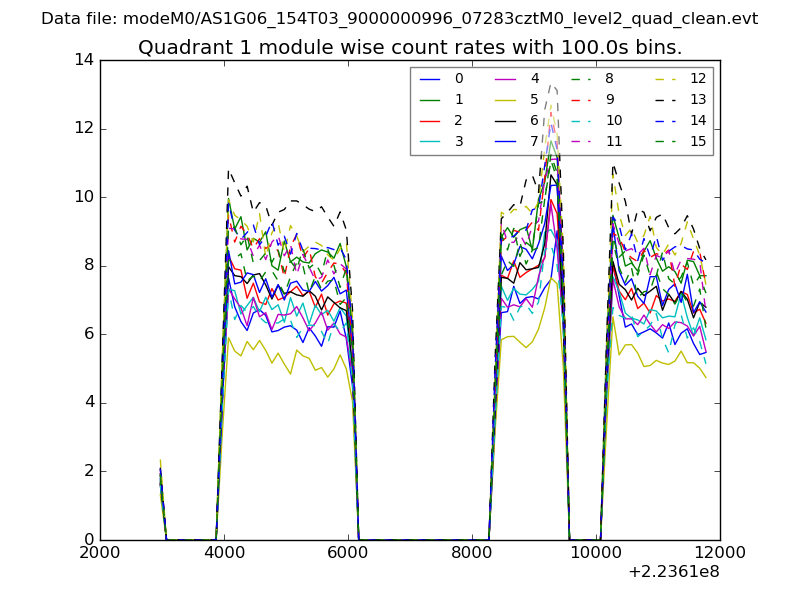
| Module-wise count rates for Quadrant B Data is divided into 100 sec bins |
 |
 |
| Module-wise count rates for Quadrant C Data is divided into 100 sec bins |
 |
 |
| Module-wise count rates for Quadrant D Data is divided into 100 sec bins |
 |
 |
| Parameter | Plot |
|---|---|
| CZT HV Monitor |  |
| D_VDD | 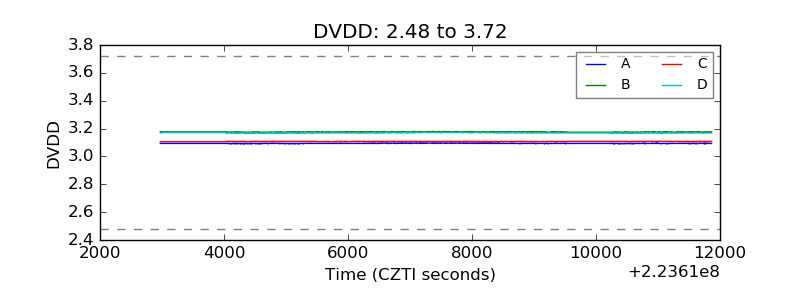 |
| Temperature 1 | 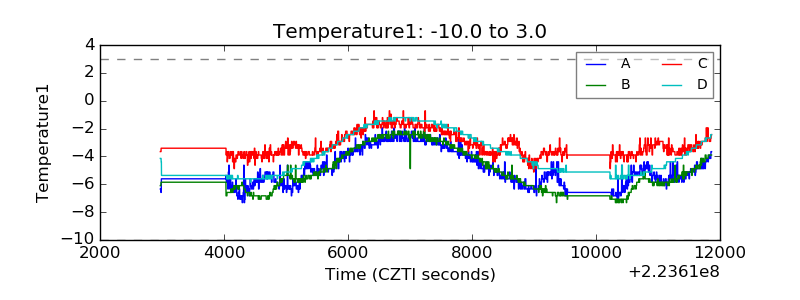 |
| Veto HV Monitor | 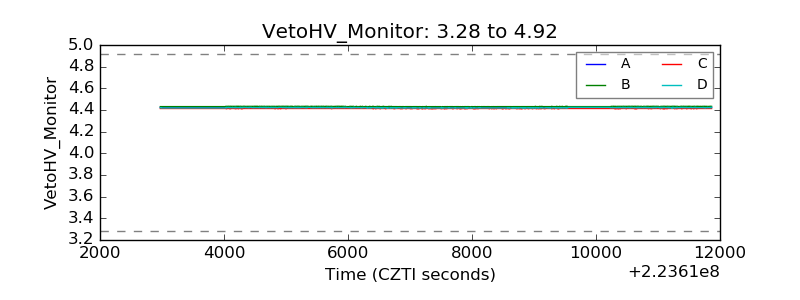 |
| Veto LLD | 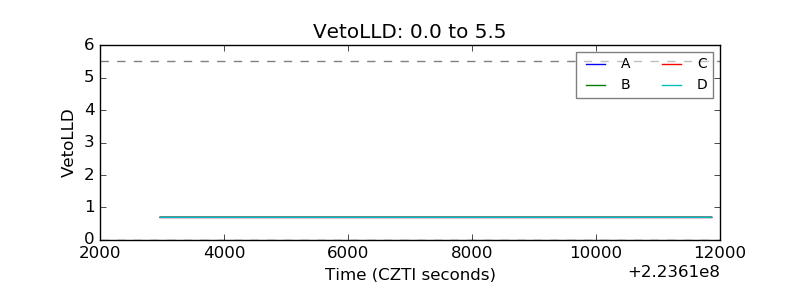 |
| Alpha Counter |  |
| _CPM_Rate | 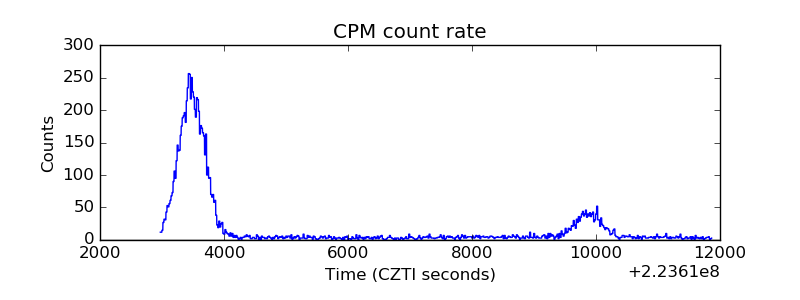 |
| CZT Counter | 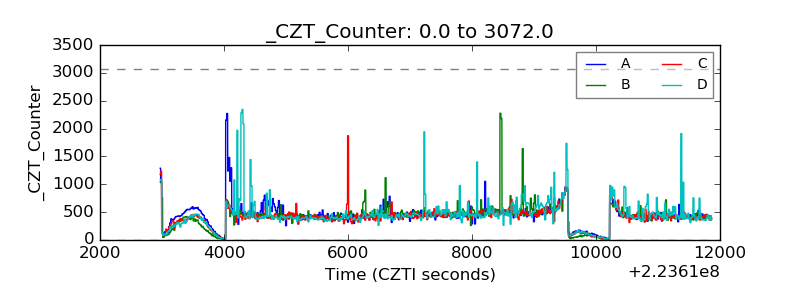 |
| +2.5 Volts monitor |  |
| +5 Volts monitor |  |
| _ROLL_ROT | 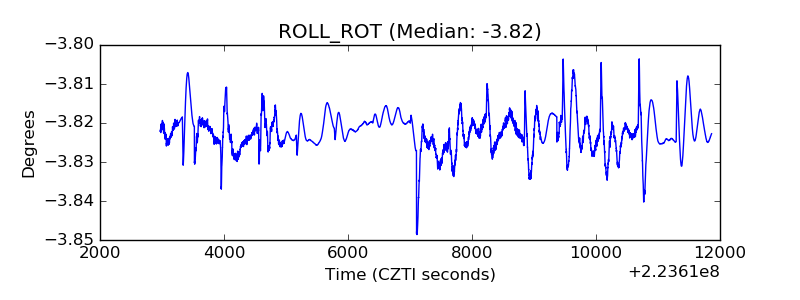 |
| _Roll_DEC | 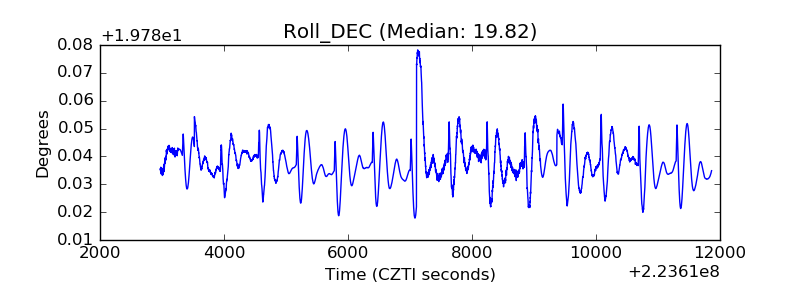 |
| _Roll_RA | 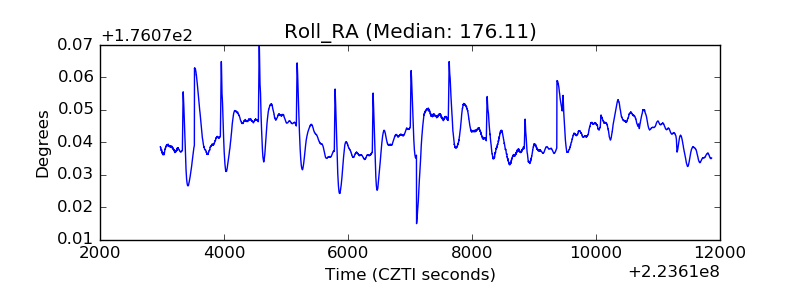 |
| Veto Counter | 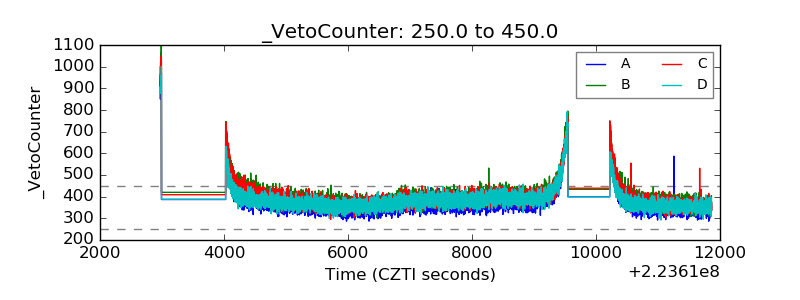 |