| Param | Original file | Final file |
|---|---|---|
| Filename | modeM0/AS1G06_154T03_9000000996_07284cztM0_level2.evt | modeM0/AS1G06_154T03_9000000996_07284cztM0_level2_quad_clean.evt |
| Size (bytes) | 490,083,840 | 91,535,040 |
| Size | 467.4 MB | 87.3 MB |
| Events in quadrant A | 3,269,908 | 568,684 |
| Events in quadrant B | 3,355,063 | 585,437 |
| Events in quadrant C | 3,231,716 | 577,462 |
| Events in quadrant D | 4,501,412 | 544,335 |
| Mode M0 | |||
|---|---|---|---|
| Quadrant | BADHDUFLAG | Total packets | Discarded packets |
| A | 0 | 14684 | 3 |
| B | 0 | 14777 | 2 |
| C | 0 | 14698 | 2 |
| D | 0 | 18444 | 2 |
| Mode SS | |||
|---|---|---|---|
| Quadrant | BADHDUFLAG | Total packets | Discarded packets |
| A | 0 | 144 | 0 |
| B | 0 | 144 | 0 |
| C | 0 | 144 | 0 |
| D | 0 | 144 | 0 |
| Quadrant | Total seconds | Saturated seconds | Saturation percentage |
|---|---|---|---|
| A | 7112 | 196 | 2.755906% |
| B | 7112 | 183 | 2.573116% |
| C | 7112 | 128 | 1.799775% |
| D | 7112 | 543 | 7.634983% |
Noise dominated data is calculated using 1-second bins in cleaned event files. If a bin has >2000 counts, and if more than 50% of those come from <1% of pixels, then it is considered to be noise-dominated and hence unusable.
| Quadrant | # 1 sec bins | Bins with >0 counts | Bins with >2000 counts | High rate bins dominated by noise | Noise dominated (total time) | Noise dominated (detector-on time) | Marked lightcurve |
|---|---|---|---|---|---|---|---|
| A | 7232 | 7112 | 0 | 0 | 0.00% | 0.00% | 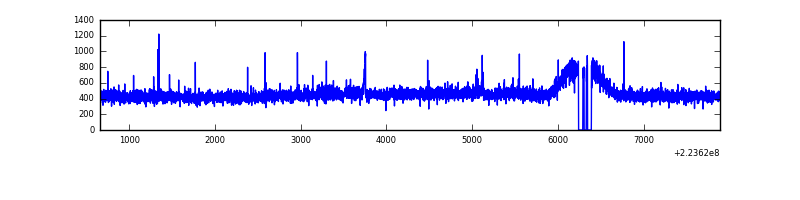 |
| B | 7232 | 7115 | 8 | 8 | 0.11% | 0.11% | 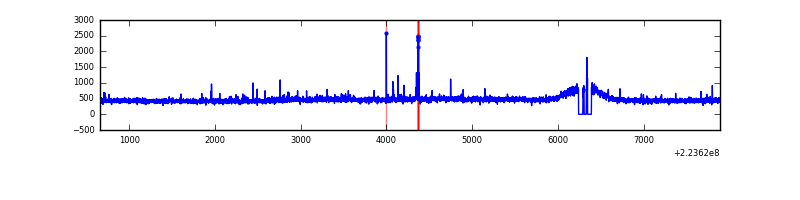 |
| C | 7232 | 7115 | 2 | 2 | 0.03% | 0.03% | 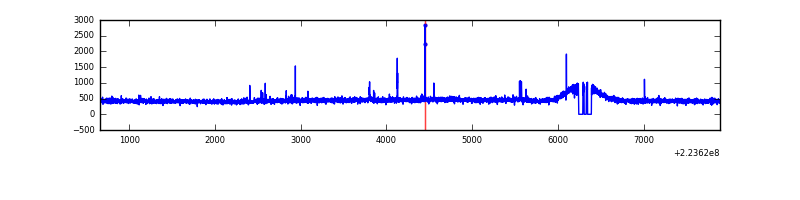 |
| D | 7232 | 7113 | 336 | 336 | 4.65% | 4.72% | 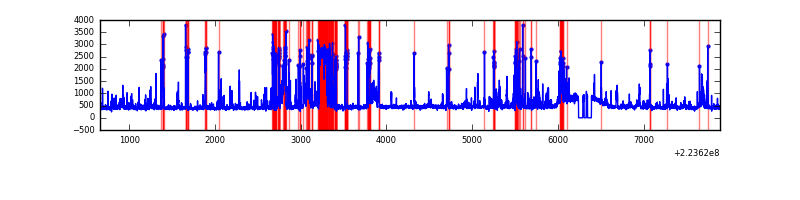 |
Top three noisy pixels from each quadrant. If the there are fewer than three noisy pixels in the level2.evt file, extra rows are filled as -1
| Pixel properties | Quadrant properties | ||||||
|---|---|---|---|---|---|---|---|
| Quadrant | DetID | PixID | Counts | Sigma | Mean | Median | Sigma |
| A | 3 | 243 | 11686 | 62.8 | 839 | 821 | 173.0 |
| A | 14 | 111 | 10945 | 58.52 | 839 | 821 | 173.0 |
| A | 0 | 226 | 7994 | 41.46 | 839 | 821 | 173.0 |
| B | 0 | 214 | 37980 | 229.72 | 841 | 820 | 161.8 |
| B | 4 | 239 | 22724 | 135.41 | 841 | 820 | 161.8 |
| B | 4 | 81 | 19234 | 113.83 | 841 | 820 | 161.8 |
| C | 1 | 16 | 34946 | 180.22 | 815 | 818 | 189.4 |
| C | 10 | 22 | 6838 | 31.79 | 815 | 818 | 189.4 |
| C | 14 | 67 | 6795 | 31.56 | 815 | 818 | 189.4 |
| D | 2 | 216 | 910775 | 4647.79 | 793 | 767 | 195.8 |
| D | 2 | 14 | 217671 | 1107.82 | 793 | 767 | 195.8 |
| D | 13 | 105 | 204017 | 1038.08 | 793 | 767 | 195.8 |
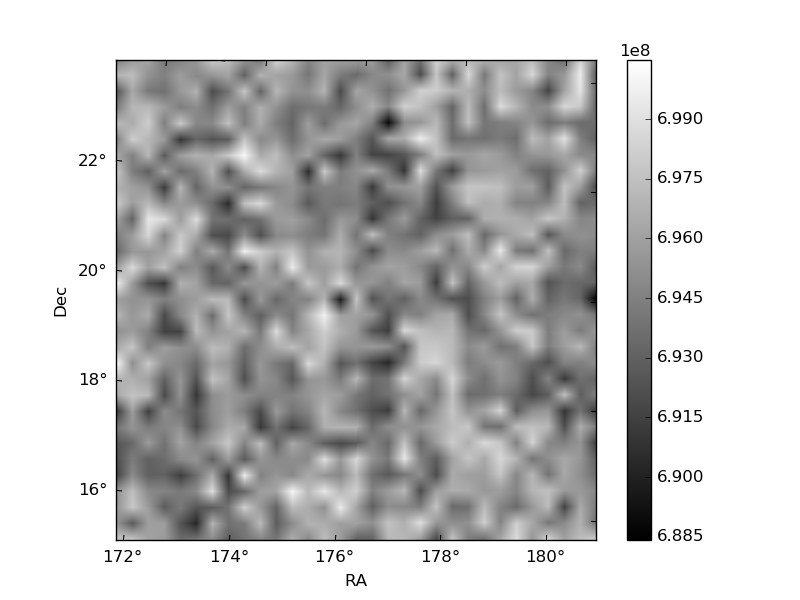
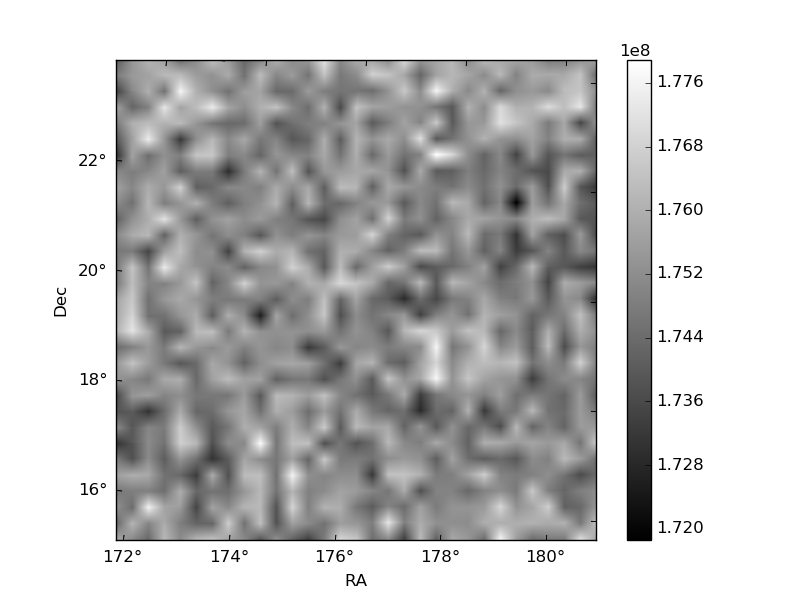
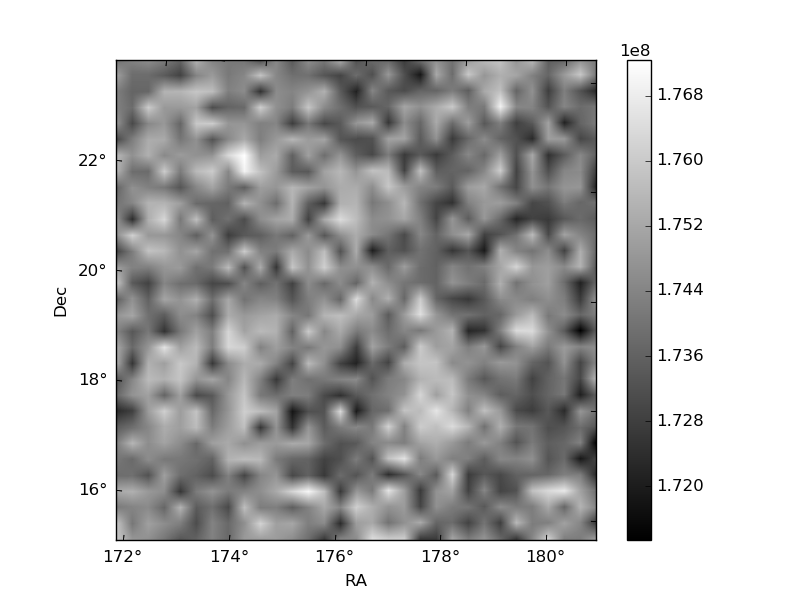
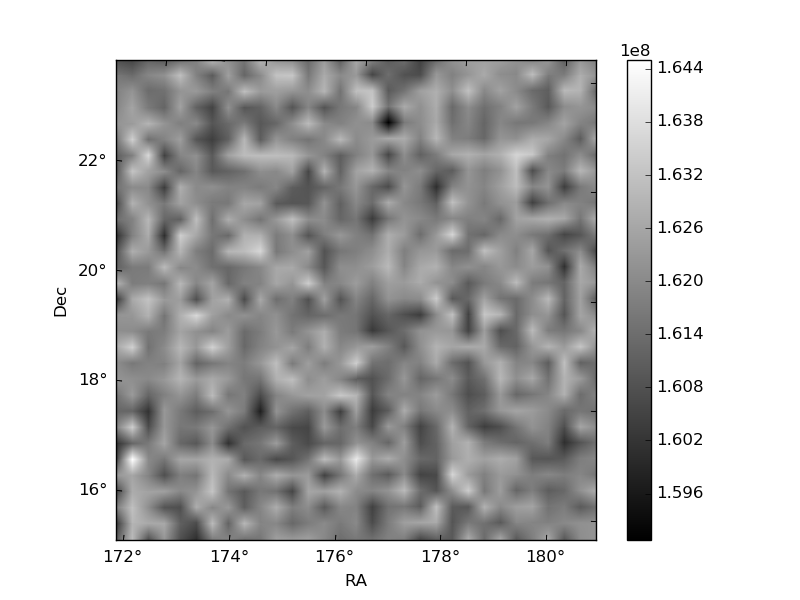
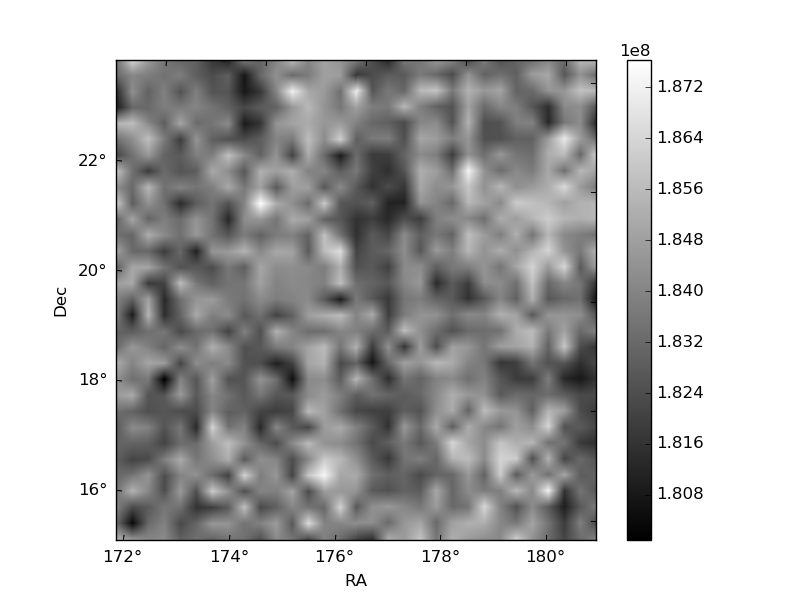
Histogram calculated using DETX and DETY for each event in the final _common_clean file
| Quadrant A | 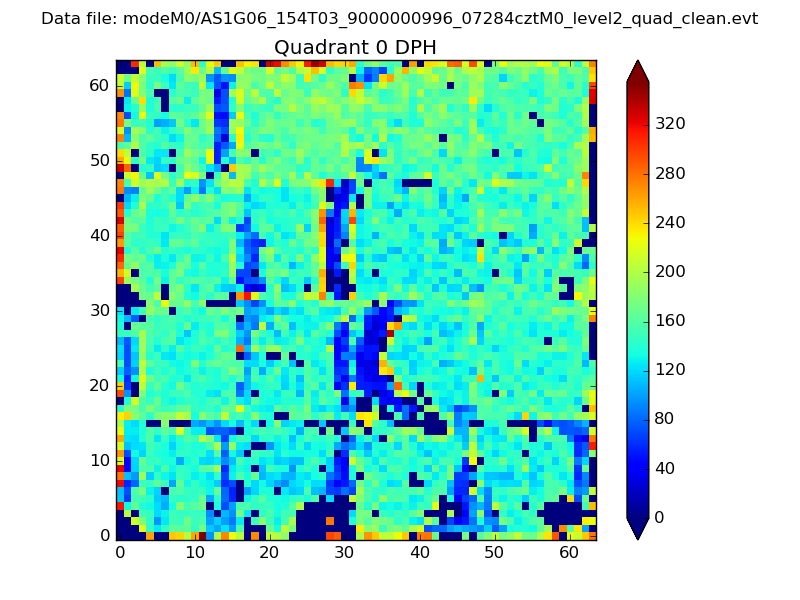 |
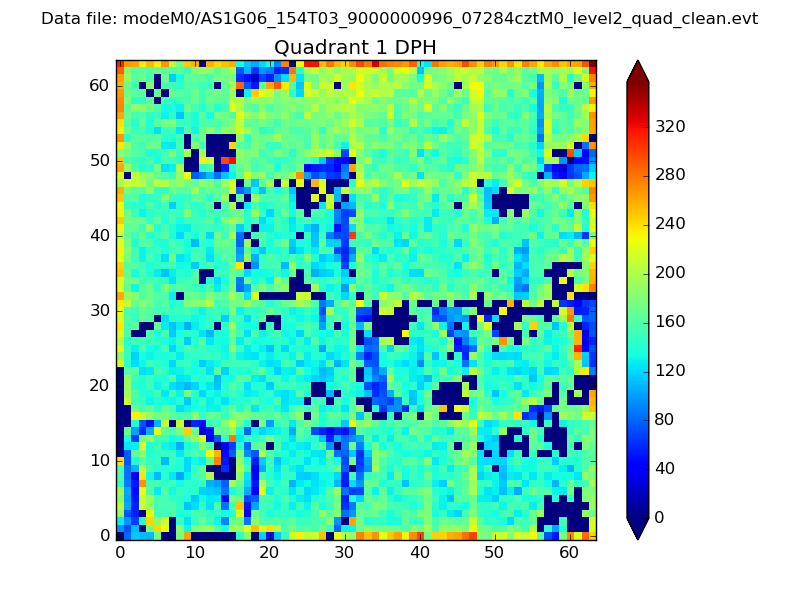 |
Quadrant B |
|---|---|---|---|
| Quadrant D | 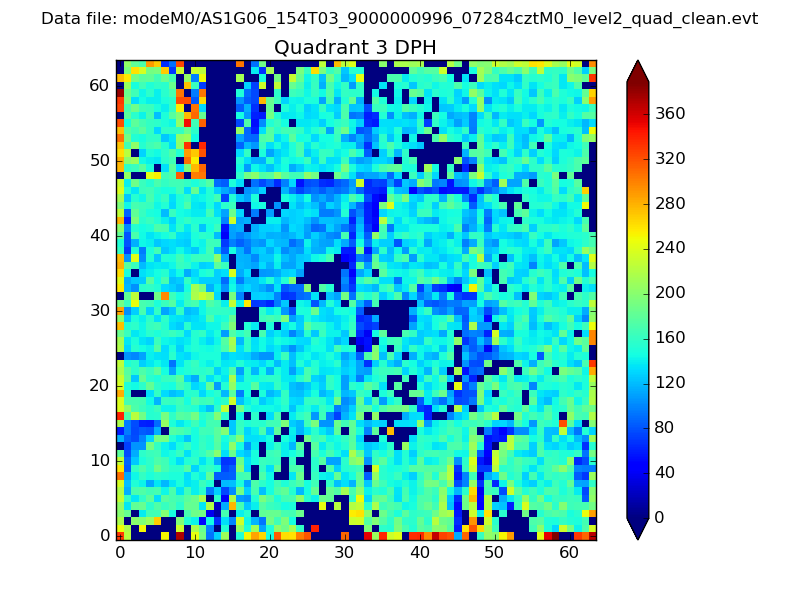 |
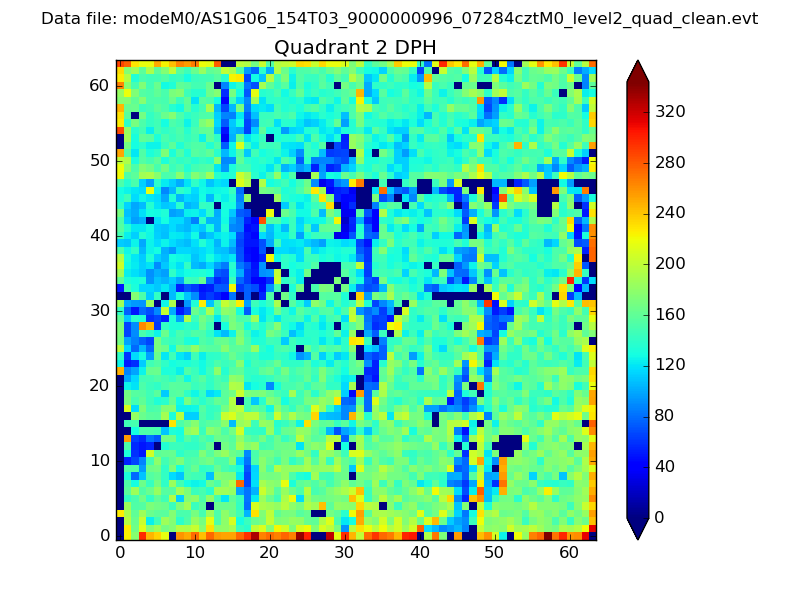 |
Quadrant C |
| Plot type | Count rate plots | Images |
|---|---|---|
| Comparison with Poisson distribution Blue bars denote a histogram of data divided into 1 sec bins. Red curve is a Poisson curve with rate = median count rate of data. |
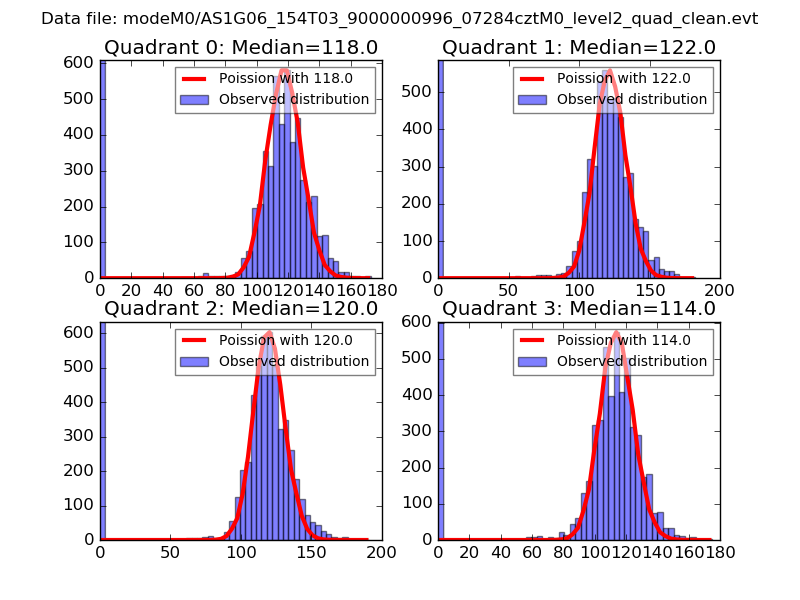 |
 |
| Quadrant-wise count rates Data is divided into 100 sec bins |
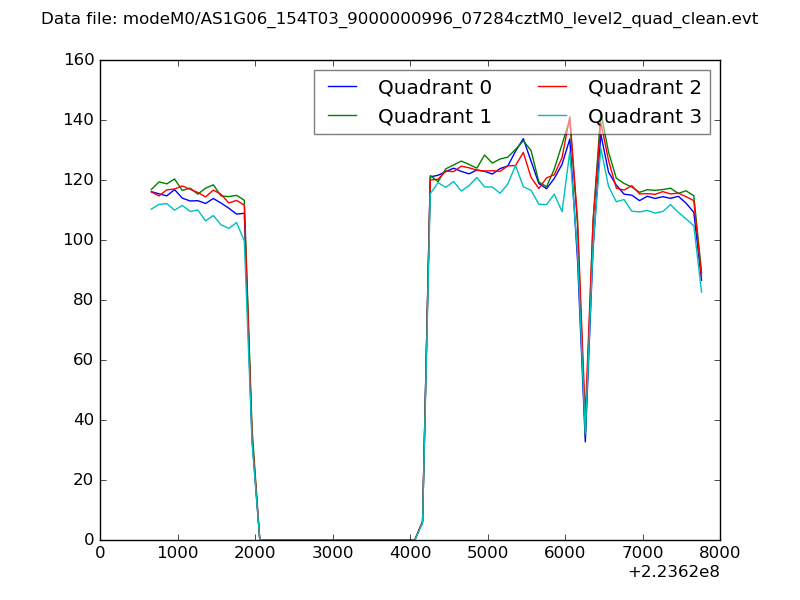 |
|
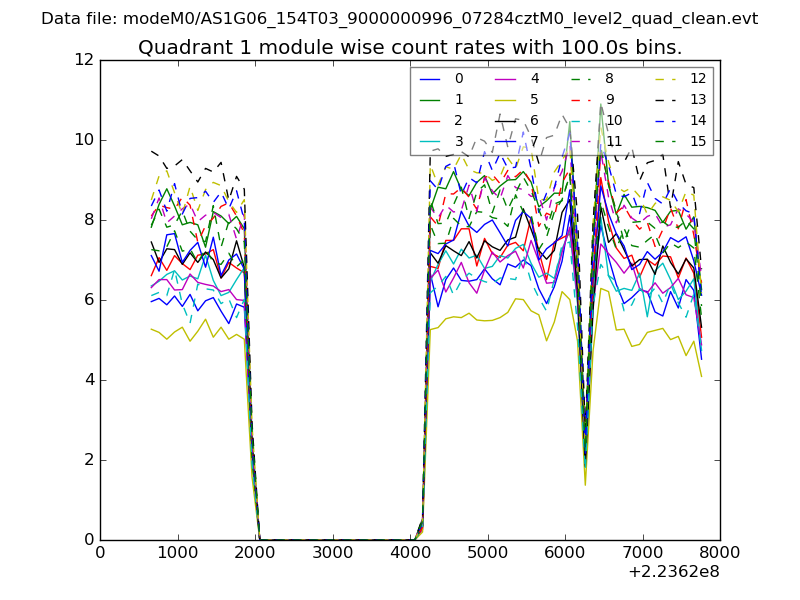
| Module-wise count rates for Quadrant A Data is divided into 100 sec bins |
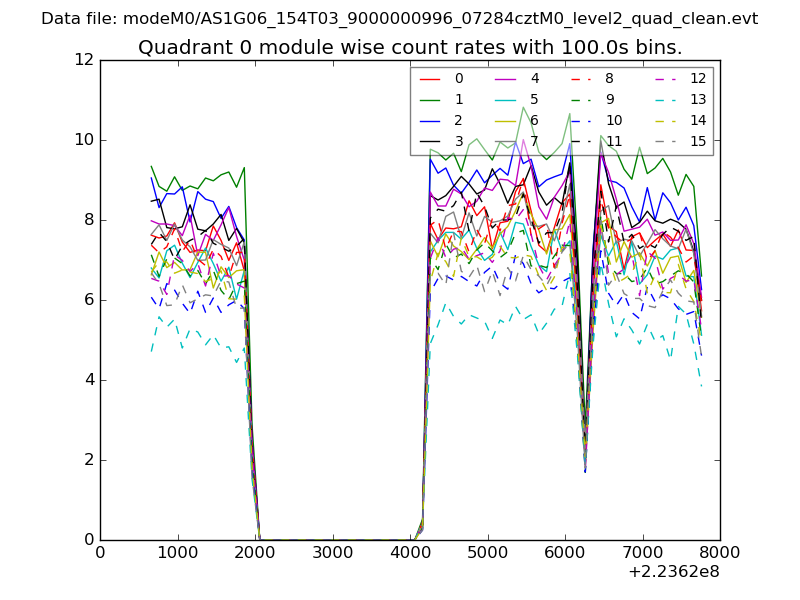 |
 |
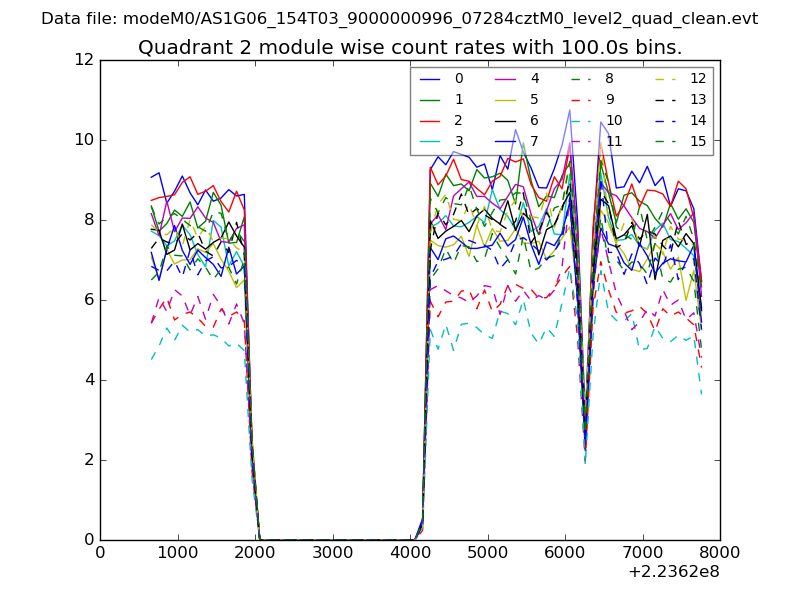
| Module-wise count rates for Quadrant B Data is divided into 100 sec bins |
 |
 |
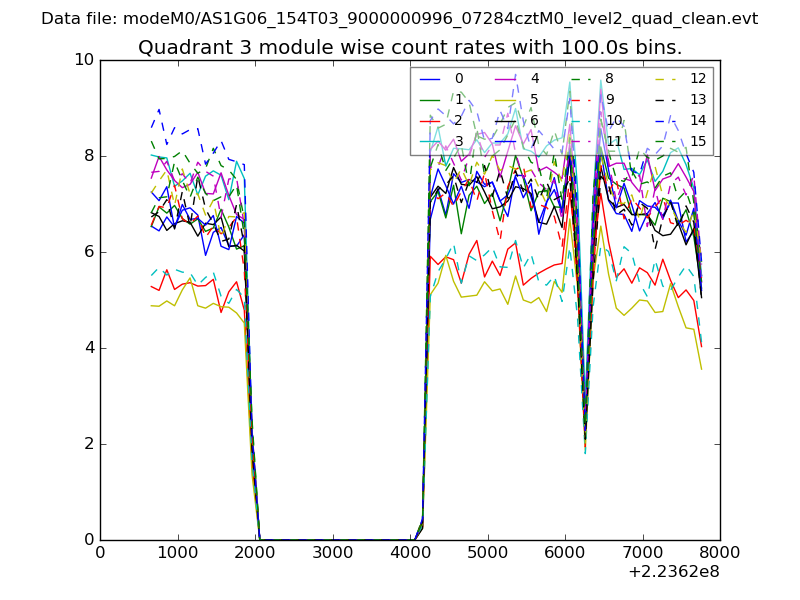
| Module-wise count rates for Quadrant C Data is divided into 100 sec bins |
 |
 |
| Module-wise count rates for Quadrant D Data is divided into 100 sec bins |
 |
 |
| Parameter | Plot |
|---|---|
| CZT HV Monitor | 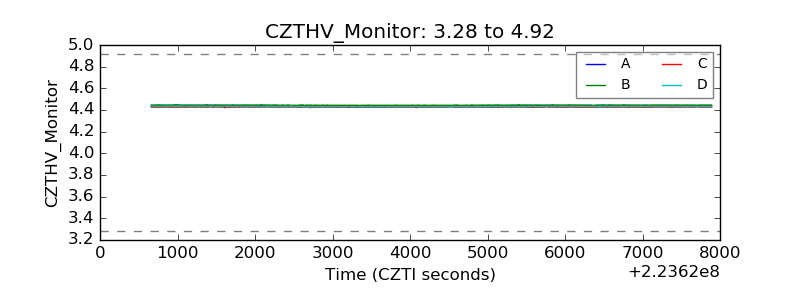 |
| D_VDD | 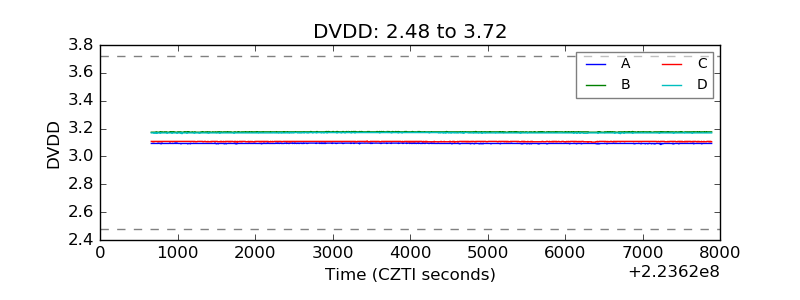 |
| Temperature 1 | 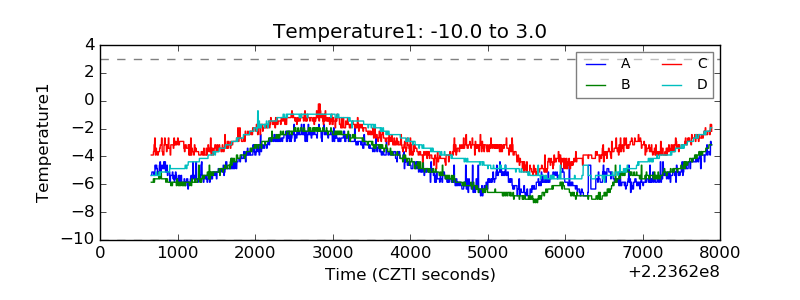 |
| Veto HV Monitor |  |
| Veto LLD | 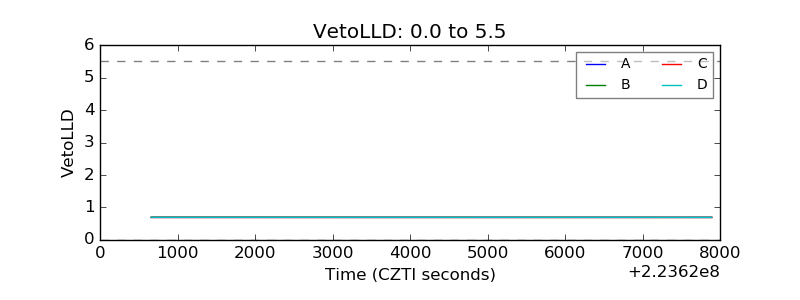 |
| Alpha Counter | 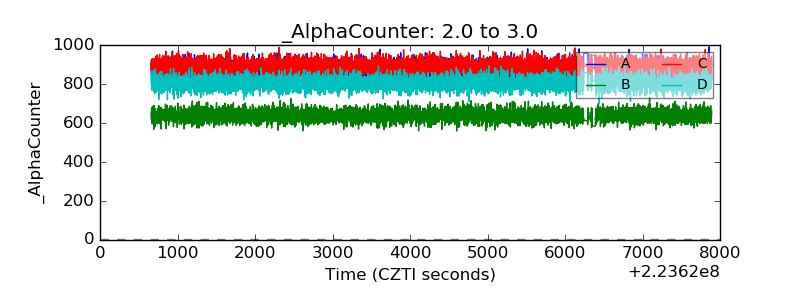 |
| _CPM_Rate | 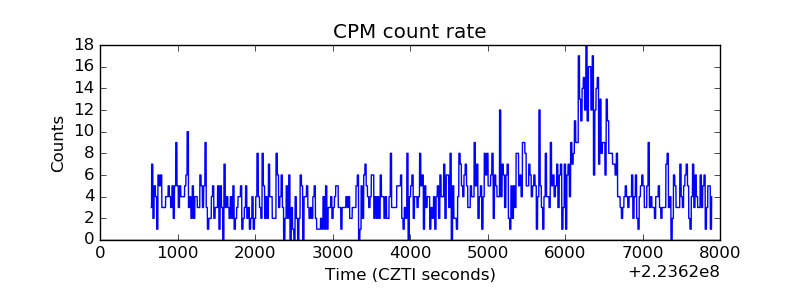 |
| CZT Counter | 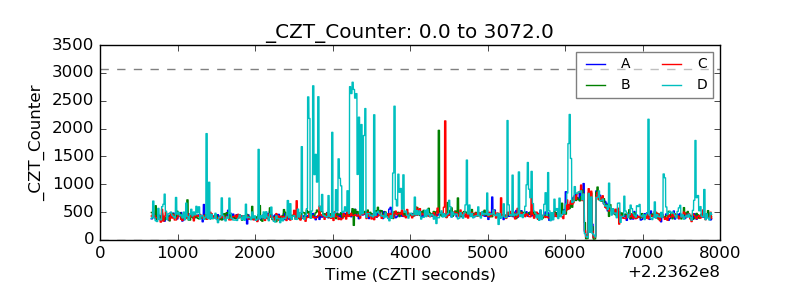 |
| +2.5 Volts monitor | 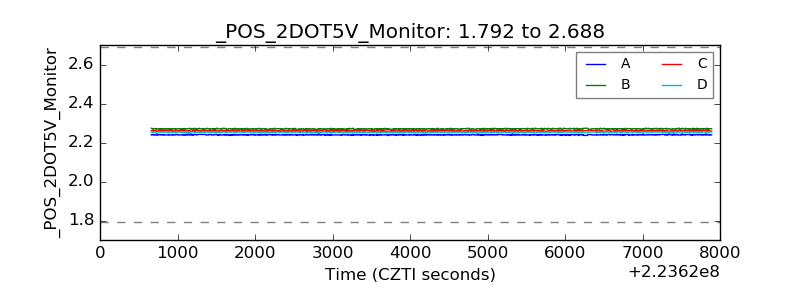 |
| +5 Volts monitor | 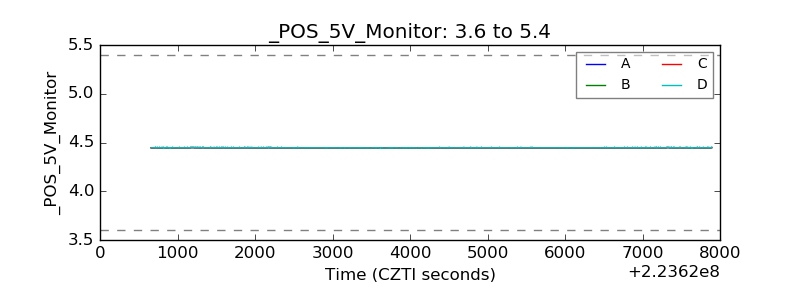 |
| _ROLL_ROT | 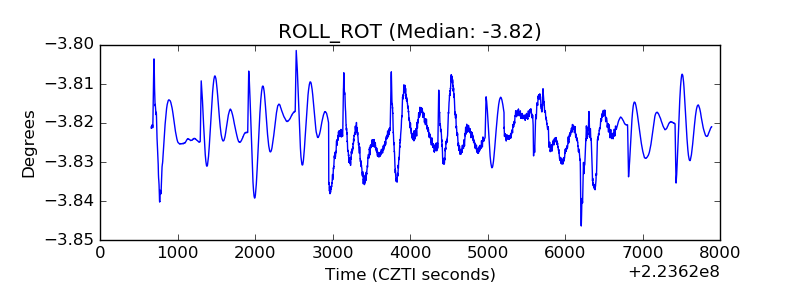 |
| _Roll_DEC | 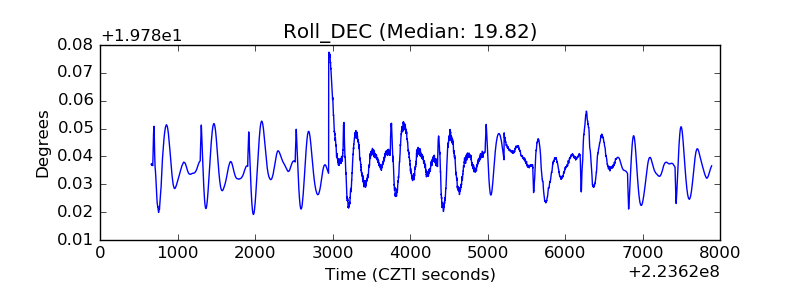 |
| _Roll_RA |  |
| Veto Counter | 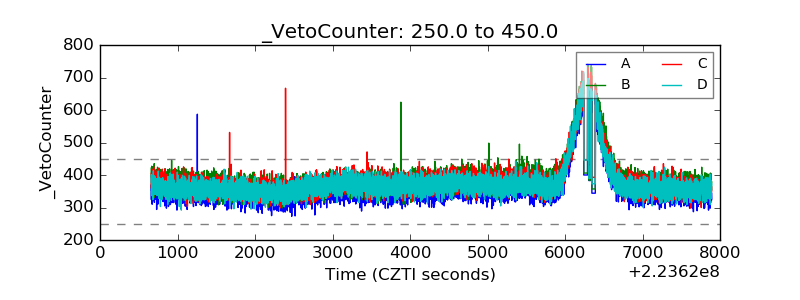 |